PHOTONIC QUANTUM INFORMATION TECHNOLOGIES
Peter J. Thomas
A Thesis Submitted for the Degree of DEng
at the
University of St Andrews
2010
Full metadata for this item is available in
St Andrews Research Repository
at:
http://research-repository.st-andrews.ac.uk/
Please use this identifier to cite or link to this item:
http://hdl.handle.net/10023/3050
The application of spontaneous parametric downconversion
to develop tools for validating photonic quantum
information technologies
Peter J. Thomas
Portfolio submitted for the degree of Engineering Doctorate
I, Peter J. Thomas, hereby certify that this portfolio, which is approximately 55,000 words in length, has been written by me, that it is the record of work carried out by me and that it has not been submitted in any previous application for a higher degree.
I was admitted as a research student in September, 2004 and as a candidate for the degree of Engineering Doctorate in September, 2004; the higher study for which this is a record was carried out at the National Physical Laboratory, Teddington and in the University of St Andrews between 2004 and 2010.
Peter J. Thomas September 2010
I hereby certify that the candidate has fulfilled the conditions of the Resolution and Regulations appropriate for the degree of Engineering Doctorate in the University of St Andrews and that the candidate is qualified to submit this portfolio in application for that degree.
Professor Malcolm Dunn September 2010 (Academic supervisor)
permission for it to be made available for use in accordance with the regulations of the University Library for the time being in force, subject to any copyright vested in the work not being affected thereby. I also understand that the title and the abstract will be published, and that a copy of the work may be made and supplied to any bona fide library or research worker, that my portfolio will be electronically accessible for personal or research use unless exempt by award of an embargo as requested below, and that the library has the right to migrate my portfolio into new electronic forms as required to ensure continued access to the portfolio. I have obtained any third-party copyright permissions that may be required in order to allow such access and migration, or have requested the appropriate embargo below.
The following is an agreed request by candidate and supervisors regarding the electronic publication of this portfolio:
Embargo on both all of printed copy and electronic copy for the same fixed period of one year on the following grounds: publication would be commercially damaging to the researcher, or to the supervisors, or the University.
Peter J. Thomas September 2010
Professor Malcolm Dunn September 2010
I would like to thank my academic supervisor Professor Malcolm Dunn at the University of St. Andrews and my industrial supervisor Dr Christopher Chunnilall at the National Physical Laboratory for allowing me to undertake the EngD with them and for their consistently superb guidance and encouragement throughout.
Within the non-linear optics group at the University of St. Andrews I would like to thank Dr David Stothard, his impressive expertise in electronics was vital to the success of the experiments carried out there. Thanks are also owed to David Walsh for his assistance about the laboratory and for thoughtful technical discussions. I am grateful to Richard Tatham for useful discussions of theoretical concepts. I would also like to thank Caroline Thomson and Shona Matthew for helping to create a friendly and productive working environment.
At the National Physical laboratory I would like to thank all members of the former Optical Technologies and Scientific Computing Team for providing an interesting and educational working environment, particular thanks goes to Dr Jessica Cheung for her expertise about the laboratory and for her constant encouragement, also I thank Dr Richard Hubbard and Rainer Winkler for stimulating conservations.
I would like to give special thanks for the persistent support and encouragement I received from Randi-Helene and my family, without which I surely wouldn’t have made it to this stage.
This portfolio of work contributes to the remit of the National Physical Laboratory (NPL) to develop the underpinning expertise and tools for validating nascent and future optical quantum technologies based on the discrete and quantum properties of photons. This requirement overlaps with the requirement to provide validation for devices operating in the photon-counting regime. A common theme running through the portfolio is photon pairs generated through spontaneous parametric downconversion (SPDC).
A Hong-Ou-Mandel (HOM) interferometer sourced with visible wavelength photon pairs from an SPDC process in beta-barium borate (BBO) was designed, built and characterised. The visibility of the HOM interference is dependent on the indistinguishability of the interfering photons, but is also influenced by imperfections of the interferometer; therefore an investigation was carried out to quantify the effects of the interferometer imperfections on the measured visibility so that the true photon indistinguishability could be measured with a quantified uncertainty.
A bright source of correlated pair photons in the telecoms band based upon a pump enhanced SPDC process in periodically-poled potassium titanyl phosphate (PPKTP) was designed, built and characterised. From the characterisation measurements the source brightness was estimated to be 6.2×10⁴ pairs/ s/ mw pump. The photon pairs were further characterised
through their incorporation as a source in a HOM interference experiment.
Peter Thomas, Jessica Cheung, Christopher Chunnilall and Malcolm Dunn “Metrology using Two Photon Interference” presented at Physics 2005 - A Century after Einstein, Warwick 2005 (Poster)
Peter Thomas, Jessica Cheung, Christopher Chunnilall and Malcolm Dunn “Quantifiable measurements using two photon interference” presented at Photon06, Manchester 2006 (Poster)
Peter Thomas, Jessica Cheung, Christopher Chunnilall and Malcolm Dunn “Towards entangled photon metrology with known uncertainty” presented at SPIE Optics and Photonics, San Diego 2006 (Poster)
Peter Thomas, Jessica Cheung, Christopher Chunnilall and Malcolm Dunn “Few photon and quantum metrology” QNLO 2008 (Poster)
Peter Thomas, Jessica Cheung, Christopher Chunnilall and Malcolm Dunn “The Hong-Ou-Mandel interferometer; A new procedure for alignment”, Review of scientific instruments, 80, 036101-1-3, 2009
Christopher Chunnilall, Peter Thomas and Malcolm Dunn, “ A source of entangled photons for the 1550 nm telecommunications window” Single Photon Workshop, NIST Boulder, 2009
Declarations ...I Acknowledgments...III Abstract ...V Knowledge transfer activities ... VII Contents ... IX
1 Introduction... 1
1.1 Quantum entanglement ... 1
1.2 Quantum entangled photons and Spontaneous Parametric Downconversion ... 2
1.3 This portfolio, in the context of quantum metrology at the National Physical Laboratory... 3
2 Hong-Ou-Mandel interferometer design & build ... 7
2.1 Introduction... 7
2.2 Hong-Ou-Mandel interferometer configurations ... 9
2.3 Photon pair generation ... 12
2.4 Single photon detection... 16
2.5 Coincident photon detection ... 22
2.6 Alignment and path balancing of the HOM interferometer paths... 26
2.7 Interferometer characteristics ... 36
2.8 Conclusions... 44
3 Measurement of photon indistinguishability to a quantifiable accuracy... 47
3.1 Introduction... 47
3.2 Quantifying the visibility of the measured interferogram – VHOM– with an associated uncertainty ... 48
3.3 Photon indistinguishabililty and its determination from VHOM ... 60
3.4 Polarisation effects influencing the measured visibility - int f ... 62
3.5 Beam splitter influence on the measured visibility - fR T, ... 65
3.6 Influence of angular interferometer alignment on the measured visibility – f .... 68
3.7 Influence of beam centre Interferometer alignment on the measured visibility – f ... 76
3.10 Conclusions... 89
4 Pump enhanced source of correlated photons in the telecoms band... 91
4.1 Introduction... 91
4.2 Non-linear crystal choice ... 92
4.3 Waveguide and bulk pump-enhanced approaches to improved downconversion efficiencies ... 97
4.4 Pump enhancement cavity design ... 101
4.5 Experimental setup for pump enhanced pair generation scheme... 111
4.6 Characterisation of pump enhanced pair photon source ... 122
4.7 Further source characterisation; Hong-Ou-Mandel interference ... 131
4.8 Conclusions... 137
5 Pump enhanced source of polarisation entangled photon pairs in the telecoms band . ... 141
5.1 Introduction... 141
5.2 Theory of source design ... 143
5.3 Experimental setup... 148
5.4 Experimental results... 158
5.5 Rebuild of experiment at the NPL ... 164
5.6 Conclusions... 167
6 Design of a wavelength tuneable device for the absolute measurement of detector quantum efficiency. ... 169
6.1 Introduction... 169
6.2 Modelling theory and calculation method... 171
6.3 Modelling of FSQEM system based on noncollinear 351.1 nm (e) 702.2 (o) +702.2 (o) process in BBO ... 177
6.4 Conclusions... 195
7 Conclusions and forward look ... 199
References ... 203
Appendix 1: SPDC wavefunction... 211
1
Introduction
1.1
Quantum entanglement
In the thought experiment of Einstein, Podolsky and Rosen (EPR), [1] measurements are made on two physical systems that are quantum entangled with respect to an observable. The quantum entanglement is characterised by a strong correlation of the measurements between the two systems, which could be spaced an infinite distance apart, while each system individually shows a random outcome for each measurement. The individual measurement outcomes are effectively undetermined before the measurements, and therefore quantum entanglement conflicts with physical reality. In addition locality is violated by the notion that the measurement of an observable in one system instantaneously determines the state of the second system with respect to that observable, even if the two systems are infinitely separated. The incompatibility of quantum theory with local realism led Einstein to believe it to be an incomplete description. Bell developed this discussion into a experimental test of the quantum mechanical disagreement with local realism [2]. The test consists of a set of ‘Bell inequalities’ that must be satisfied for measurements on a system described by any local and realistic model, but the Bell inequalities are violated for measurements on a quantum entangled system. A Bell inequality violation due to measurements from an experimentally produced EPR type system was first demonstrated by Clauser and Shimony [3].
1.2
Quantum entangled photons and Spontaneous Parametric
Downconversion
The first violations of Bell inequalities were reported for entangled systems based upon photon pairs [3-4], and photon pairs remain the most popular resource for Bell inequality tests and other experiments in quantum mechanics. However the atomic cascade method employed in early experiments for the production of photon pairs is associated with low production rates and collection efficiencies. Spontaneous Parametric Downconversion (SPDC) later became the method of choice for producing photon pairs in quantum optics due to relatively large photon pair production rates and narrow emission angles leading to higher collection efficiencies. SPDC is a second order non-linear process whereby a higher energy pump photon is split into two lower energy daughter (signal and idler) photons within a non-linear medium. SPDC was first studied theoretically in 1961 [5] and first experimentally observed in 1967 [6]. The wavelength tuneable nature of downconverted light meant that many of the first studies focussed on applications in spectroscopy [7]. However the majority of SPDC work in the past 25 years has been in the field of quantum optics. Perhaps the most notable quantum optics experiments incorporating SPDC sources include the first demonstration of a Hong-Ou-Mandel interferometer [8] (874 citations) and the first demonstration for the teleportation of entangled states [9] (1680 citations). In addition, proposals that were inspired by the increased availability of SPDC sources were those for quantum cryptography using entangled photon pairs [10] (862 citations) and for quantum lithography, which can beat the classical Rayleigh criterion for the diffraction limit [11] (366 citations). SPDC features heavily in the quantum optical investigations of this portfolio.
Entanglement is always with respect to an observable, one such observable for photons is the spatial information they posses. Spatially entangled states can be produced using a device such as an SPDC-sourced Hong-Ou-Mandel interferometer [8], studies of which are reported in chapters two and three of this portfolio.
Photons can also be entangled in time, so-called ‘time-bin’ entanglement schemes were suggested as an alternative to polarisation entanglement for quantum systems based upon optical fibre networks, because time-bin entangled states are not affected by the polarisation mode dispersion of the fibre [15]. Quantum cryptography systems based on time-bin encoding have been commercialized [16]. Time as an entanglement variable is not studied at length within this portfolio.
1.3
This portfolio, in the context of quantum metrology at the National
Physical Laboratory
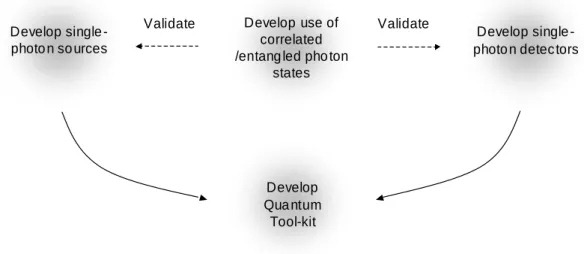
Over the past couple of decades, many have sought to develop devices based on quantum principles such as entanglement. The interest in quantum technology has been fuelled further by the rapid growth of the semiconductor industry, where the current-increasing levels of performance due to component down-sizing is certain to be stifled as quantum mechanical considerations start to grow in importance [17]. The research into quantum technology has resulted in the production of quantum states having specific purposes, and the progress of such work could eventually lead to the formation of a complete and general set of quantum tools; quantum control, quantum communication, and quantum computation. Two critical stumbling blocks in realising such tools stems from the lack of good deterministic single photon sources [18], and the lack of high quantum efficiency photon-counting-regime detectors [19], particularly at telecoms wavelengths where the technology is underdeveloped yet there exists the possibility to establish distributed quantum system based upon existing fibre networks (see Figure 1-1). It has been recognised at the National Physical Laboratory (NPL) that a key step in overcoming these stumbling blocks is through the development of validation techniques based upon Spontaneous Parametric Down conversion (SPDC). All of the work contained within in this portfolio has SPDC at the focus and can be linked to facilitating the validation of single photon sources or detectors.
measurement is developed. A similar procedure to the one presented could be applied to the characterisation of single photon sources, and therefore in the framework of Figure 1-1 the work of chapters two and three contributes to facilitating the validation of single photon sources.
Develop use of correlated /entang led pho ton
states
Develop single -photo n so urces
Develop Qua ntum
Tool-kit
Validate Validate
Develop single -photo n detec tors
Develop single -photo n detec tors Develop single
-photo n so urces
Figure 1-1 Dependencies of quantum information process development on research topics of interest at NPL.
Chapter four describes the design and build for a bright SPDC-based source of correlated photon pairs in the telecoms band. The mechanism for the additional brightness above that for a ‘single-pass’ SPDC process was achieved through enhancement of the pump beam within an optical cavity housing the downconversion medium. The developed correlated photon pair source was incorporated into the heart of a novel design for polarisation entangled photon pairs for which the design, build and characterisation is described in chapter five. This source is intended to be utilized for investigations into how to characterize optical states and processes which may be implemented at this wavelength using fibre or waveguide networks, as well as being available for the characterisation of novel single photon detectors and coupling with other quantum systems.
Chapter six presents a theoretical study of a wavelength tuneable system for the absolute measurement of single photon detector quantum efficiency, and as such the chapter also contributes to facilitating the validation of single photon sources.
2
Hong-Ou-Mandel interferometer design & build
2.1
Introduction
The Hong-Ou-Mandel (HOM) interferometer is a device that recombines individual photons at a beam splitter. Classically there are four outcomes to the recombination; two where the photons leave the beam splitter through different output ports and two where the photons emerge spatially superimposed. (Figure 2-1) Interpreting these outcomes as probability amplitudes, and assuming the incident photons are ‘indistinguishable’ in terms of their spatial, temporal, spectral and polarization modes, it can be shown that the classical possibilities of photons leaving separate ports of the beam splitter are forbidden, and the purely quantum phenomenon of photons always emerging paired from the recombiner occurs [8].
(a) (b)
(c) (d)
Figure 2-1 Possible outcomes when two photons recombine from two separate input ports of a beamsplitter. The defining feature of HOM interference is when (c) and (d) cease to be possibilities and this occurs when the two photons are indistinguishable in all respects.
sources of choice in the experiments are photon pair downconverters [27]. Such sources are widely available and suitable for quantum interference due to the high degree of simultaneity in creation of photon pairs, ensuring temporal indistinguishability.
The high simultaneity of photon production has meant that the parametric pair sourced HOM interferometer has found applications in time delay metrology. Studies have shown that by measuring the shift of the interference feature upon inserting an optical medium into one arm of the interferometer, it is possible determine the medium polarisation mode dispersion with sub femtosecond precision [27]. A materials characterization technique known as Quantum Optical Coherence Tomography (QOCT) is also based on a pair-photon HOM interferometer. QOCT offers a method for material refractive index characterization and exhibits the favourable feature that the form of the interferogram is not influenced by wavelength dispersion of the material [28].
Perhaps the most pressing application for the HOM interferometer was revealed with the possibility to implement quantum computations using only linear optics, detectors and indistinguishable photons [29]. Subsequently there has been intense research to produce triggered sources of indistinguishable photons[30-35]. Since the HOM effect is dependent on photon indistinguishability, a HOM interferometer may be used to test the suitability of photon sources for application to these computation protocols [36-37].
This chapter describes the design and build of a two-photon interferometer sourced by pair photons from a parametric downconversion process. The interferometer was built to serve several purposes. The interferometer would give insight into the measurement process for the HOM interferogram and highlight the practical conditions that need to be fulfilled for optimal performance of the interferometer. In combination with a measurement equation formulated in chapter 3, measurements made on the built interferometer were used to develop a method for the quantification of photon indistinguishability with an estimated uncertainty. The framework of the interferometer was also a key component of two photon fluorescence experiments at NPL.
The single photon detection scheme for the interferometer is described and validated through estimation of the effective non-linear coefficient for the source interaction using a photon counting method presented in the literature [38]. The scheme used for coincident detection of photon pairs is also described, in addition to the methods used in order to optimize the pair collection efficiency.
The chapter also describes the procedure developed for assembling the interferometer. The two critical steps in the alignment procedure were: (i) the overlapping of the two interferometer optical paths at a beam cube and (ii) the balancing of the two interferometer optical paths. Finally the investigations serving to characterize the observed Hong-Ou-Mandel interference feature are discussed.
2.2
Hong-Ou-Mandel interferometer configurations
The Hong-Ou-Mandel interferometer has common properties with a Mach-Zehnder interferometer; i.e. the source light is split between two optical paths which are then recombined at a point that is spatially distant from the interferometer input. The separate paths enable properties such as time delay and relative polarization to be varied between the paths. The difference between the two interferometers lies in the source; for a classical Mach-Zehnder interferometer the source light is amplitude split radiation whereas in the HOM interferometer the source light are individual photons. Since the measurement of interest in HOM experiments is the rate at which photon pairs leave different output ports of the recombiner, a Michelson type configuration would not be practical.
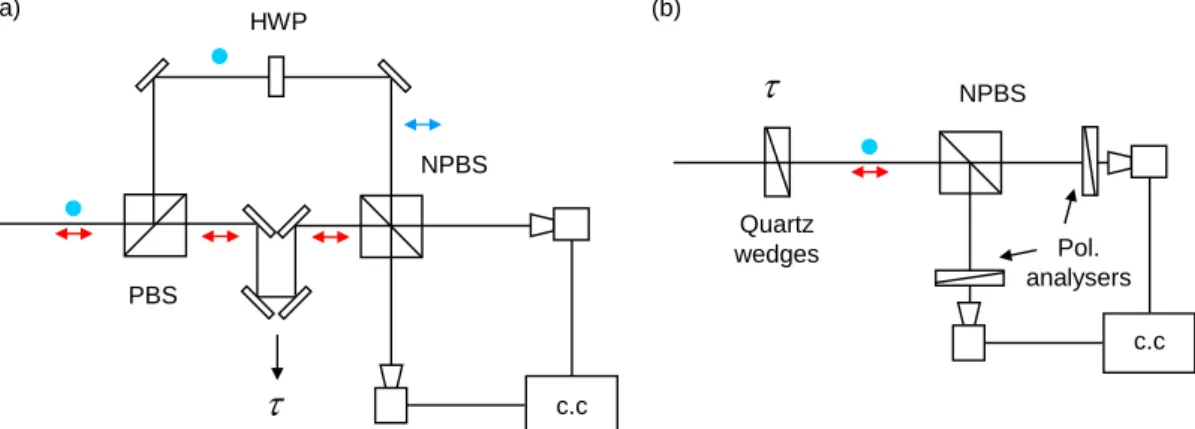
Configuration (a) is an advantageous because polarisation distinguishing information may be removed by positioning a half wave plate at 45° to the polarisation axis in one arm of the interferometer in configuration (b) polarisation analyzers need to be positioned in front of the detectors in order to remove the distinguishing information, resulting in signal loss.
NPBS
c.c Quartz
wedges Pol.
analysers
(a) (b)
PBS
NPBS HWP
c.c
Figure 2-2 Configurations for HOM interferometers source by a type II parametric downconversion process. The -delay mechanisms are either a (a) travelling roof mirror or (b) polarisation dispersive medium. Polarisation distinguishing information is either removed by (a) half wave plate (HWP) in one arm of the interferometer or (b) polarisation analysers in front of each detector. Other symbols, NPBS/PBS- non/polarising beam splitter.
A collinearly phasematched source of parallel polarised (Type I) pair photons could also be used in a scheme similar to that shown in Figure 2-2 (a); first the pairs are split at a non-polarising beam splitter before imposing the temporal delay using travelling mirrors. However in this situation the photon pairs will only follow different paths after the beam splitter half of the time, resulting in the visibility of the HOM dip being limited to 0.5.
In previous investigations of HOM interferometers sourced by type-I non-collinear parametric downconverters, designs have generally taken one of two architectures. The differences lie in the optical delay mechanisms; in the first HOM interferometer, a displacement of the beamsplitter in the perpendicular direction to the recombining surface increased one optical path of the interferometer while decreasing the other, see Figure 2-3(a) [8]. The architecture in Figure 2-3(a) has the advantage of minimizing the required optical components, but alignment of the beams is only maintained for ~d, where d is the beam diameter. In a later experiment [39] the relative optical path change between the two HOM arms was achieved by keeping one path fixed while varying the other through the slide of an optical trombone, see Figure 2-3 (b). Since the alignment of the interferometer holds for a much greater range of optical path changes for the second configuration, this was the basic design chosen for the interferometer build.
(2)crystal
c.c
p (2)crystal
c.c
p
b) a)
Figure 2-3 Configurations for non-collinearly sourced HOM interferometers (a) shows an arrangement where the optical delay is actuated through of the recombiner, and (b) shows an optical trombone arrangement for the delay.
2.3
Photon pair generation
2.3.1 Parametric downconversion medium and phasematching
In the previous section, it was established that the interferometer source would be a parametric downconverter with non-collinear type-I phase matching. This section details the considerations and decisions that were taken in deciding the remaining details of the phase matching interaction, in particular the non-linear medium used, the photon wavelengths involved and the non-collinear emission angle.
It was desirable to have pair photons at visible wavelengths where photon counting technology is well developed and since the HOM effect requires indistinguishable photons the photon pairs created were required to be degenerate. The wavelength and degeneracy constraints precluded the use of the popular downconverters lithium niobate (LiNbO3) [40]
and potassium titanyl phosphate (KTP) [41] crystals since although they transmit visible wavelengths, their linear absorption coefficients are rather high in the near-UV wavelength region that would be required for the pump. Two widely available materials with high transparency across the visible spectrum and down to 350 nm are potassium dihydrogen phosphate (KDP) [8] and beta-barium borate (BBO) [42].
KDP and BBO are both negative uniaxial crystals and birefringent phase matched solutions for both crystal types were investigated for their suitability to the interferometer. The aim of the following analysis was to find the laboratory emission angles of the signal and idler photons from an incident pump photon, s lab, and i lab, respectively. The pump photon was chosen to be extra-ordinarily polarised since the wavevector length kp for a given wavelength can be varied by changing the angle of the wavevector to the optic axis pm therefore increasing the probability of finding a birefringent phasematching solution. Both downconverted photons were chosen to be ordinarily polarised serving to fulfil the indistinguishability requirement for HOM interference without additional polarization control optics. By considering momentum conservation in both horizontal and vertical planes:
cos cos
p s s i i
k k k (2.3.1)
sin sin
s s i i
where kp, ks and ki are the pump signal and idler crystal momenta magnitudes respectively.
s
and iare the angles of the signal and idler wavevectors respectively to the pump wave
vector in the crystal. Squaring equation (2.3.2) and using sin2 1 cos2 gives:
2cos2 2 cos2 1 2
s s i i s
k k k (2.3.3)
Comparing equation (2.3.1) with the square of equation (2.3.3) then yields:
2 2 2
1
cos
2
p s i
s
p i
k k k
k k
(2.3.4)
i
is then obtained through equation (2.3.2) and the application of Snell’s law gives the emission angles in the laboratory space:
,
sins lab nssins, sini lab, nisini (2.3.5)
Since ks and ki wavevectors for a given wavelength do not vary with direction in the crystal, the calculated s lab, and i lab, applies for all azimuthal angles of ks and ki about kp and therefore defines a cone of emission about the pump beam.
Figure 2-4 show the semi cone angles corresponding to the phasematched signal emission from BBO and KDP when considering pump photons from the 351.1 nm line of an argon ion laser; similar solutions were obtained for the 363.8 nm line of the argon ion laser and also the 350.7 nm and 356.4 nm lines of a krypton ion laser. The Sellmeier coefficients given in references [43] and [44] were used to calculate the spectral variation of refractive index in BBO and KDP respectively.
of Figure 2-4, it can be seen that there was a trade off between i) and ii). pm35.0and
55.0
pm
appeared to be good compromise solutions for BBO and KDP respectively.
Figure 2-4 Half cone angles for the e o o downconversion in the laboratory frame with respect to the 351.1 nm pump beam for cuts of the crystal corresponding to different phase matching angles. (a) BBO (b) KDP.
Photon fluxes will be influenced by the effective non-linear optical coefficients for the e o o non-linear processes. BBO belongs to the point group 3m and therefore the effective non-linearity is given by equation (2.3.6) [42]. KDP, which belongs to the point group 42m, has an effective non-linearity given by equation (2.3.7) [45].
31sin 11cos cos3eff pm pm
d BBO d d (2.3.6)
36sin sin 2eff pm pm
pm
is the azimuthal angle of the pump beam about the crystal optic axis. KDP and BBO are
both uniaxial crystals, hence the phasematching calculations were independent of pm.
Choosing pm
BBO
=35.0 º , pm
KDP
= 55.0 º such that s lab, = 5.9 º and choosing
BBO
pm
= 0º, pm
KDP
= 45º such that the magnitudes of (2.3.6) and (2.3.7) areoptimised gives deff
BBO
= 1.26 pm/V and deff
KDP
=0.32 pm/V. Photon fluxes are proportional to 2eff
d (see section 2.4) and therefore BBO was chosen for the interferometer source.
The procured BBO crystal was 5 mm long with a 7 mm x 7 mm cross section. Both the input and output faces were anti-reflection coated to give R < 0.5 % at both the pump and downconverted wavelengths.
2.3.2 Pump photon source characteristics
The pump was the 351.1 nm line of an argon ion laser (Coherent Innova-90). The pump was vertically polarised with a purity of 100:1.
The beam propagation characteristics were estimated by focusing the laser output through a 500 mm converging lens to a waist and then measuring the beam diameter at various points along a 400 mm distance about the waist. A beam profiler (Spiricon) was used for the diameter measurements. A non-linear least squares fitting procedure was used to fit a hyperbola to the data, (equation 4.4.9) which gave an M2 value of 1.28 ± 0.05. An ABCD
matrix transformation (see section 4.4.2 for more detail) of the fitted profile back through the focussing lens implied a beam diameter of 1.80 mm at the laser aperture, and a beam waist of 1.66 mm at 1.01 m behind the aperture, which is consistent with the flat high reflector, long radius output coupler design of the laser.
Distance from focussing lens / m
0.4 0.5 0.6 0.7
B
e
am
r
a
di
us /
m
50 100 150 200 250 300 350
Figure 2-5 Measured profile of the argon pump beam radius with distance from a 500 mm focal length lens 0.6 m in front of the output aperture of the laser. The data points are the average beam radius of measurements in the horizontal and vertical plane. The fitted curve is based on equation 4.4.9.
A half wave plate was positioned before the crystal so that the pump polarisation could be rotated for optimisation or minimisation of phasematching for the e o+o processes, and therefore served as an on-off switch for the downconversion process.
2.4
Single photon detection
2.4.1 Experimental setup
The setup required for detecting the photons from the downconversion process described in section 2.3 is shown in Figure 2-6.
The detectors used in this investigation were silicon avalanche photodiodes (PerkinElmer SPCM-AQR), with dark count rates of ~100 s-1. The detectors are continuously ready to
BBO counter TTL-NIM converter
Interference filter Calibrated
variable aperture
Beam dump
Figure 2-6 Setup for measuring and counting single photons emitted from BBO
The downconverted photons were imaged onto the 180 m detector active area using a 30 mm focal length achromatic lens which was mounted to the detectors using mounts allowing 3 axis translation of the lens relative to the detector and 2 axes of tilt. The degenerate photons from the broadband emission were selected using a narrow band pass (3 nm) interference filter centred at 702.2 nm and optimising the observed count rate by adjusting the detector and lens positions.
Upon detection of a photon, the device gave a single TTL electrical pulse which was converted to a NIM pulse and sent to a single pulse counter (EG&G model 994).
2.4.2 Calculation of single photon count rates and the estimation of d eff
The collection optics and electronics were validated by relating the observed single photon count rates to a value for the effective non-linear coefficient for the interaction deff. The power of the downconverted emission , Ps emitted from a nonlinear crystal within a spectral bandwidth sover all solid angles can be shown to be [46]:
4 2
2 5 2
0 0
2 2
L
eff p
s p s
p s i
cd
P P l dl
n
(2.4.1)
0 lp p
P l P e (2.4.2)
The absorption coefficient for BBO at visible wavelengths is ~ 100 m-1. Because
downconversion is spectrally broad, the total power is given by summing over , and therefore summation limits need to be set. The aperture defines a collection angle collect, which can limit the collected range of s in the absence of spectral filtering. The laboratory emission angle is related to s through equations (2.3.4)-(2.3.5), and within collect it is possible to associate all laboratory emission angles ,
j lab
with a wavelength j, see Figure
2-7(a) . The resulting range of j, collect can then be used for setting limits for s
summation in equation (2.4.1). However, as discussed in section 2.3.1, the
j
values in
Figure 2-7(a) apply for all azimuthal angles about the pump beam and therefore equation (2.4.1) evaluated over collect, gives the total downconversion power into a cone of thickness
collect
.Therefore equation (2.4.1) needs to be modified in order to account for the fact that the aperture selects only a small part of the emission cone, see Figure 2-7 (b). In addition, the measured singles count rate will be further reduced by transmittance losses along the optical path to the detector and by the non-unity quantum efficiency of the detector. Accounting for
the collect limits, the aperturing of the emission cone and systems losses, equation (2.4.1) is
re-written as [38]:
2 4 2 20 5 0
2 2
2 sin ,
1 1
j collect
j L
j D
eff p collect
s j p s
p lab
j
p j
T
cd R
P P l dl
n R
(2.4.3)SinceNs Ps s hc, Ps can be associated with a photon count rate Ns. Equation (2.4.3) assumes square apertures and that Rcollect<< sin
,
j lab
and deff are the only non-directly determined quantities. The product deff for a given set of experimental parameters may be determined using a numerical approach whereby equation (2.4.3) is evaluated for a range of deff, the solution value of deff corresponds to when the calculated Ns equals the measured count rate associated with the experimental parameters of the calculation.
R L
s
collect
~Rcollect
BBO Aperture
(a)
(b)
s/ nm
692 696 700 704 708 712
s
/ de
gre
e
s
5.93 5.97 6.01 6.05
j collect
collect
j
j
Figure 2-7 (a)Plot of laboratory emission angle versus wavelength in BBO (pm = 35º) with 351.1 nm
pump. collect defines the range of j used for the calculation of singles count rates using equation
(2.4.3) (b) Side and 3D projection of the geometry of downconversion collection through square apertures. R is the crystal centre to aperture separation.
Figure 2-8 plots the measured singles count rate at the detector for various collect that were defined by a calibrated aperture. The plotted values include a correction to the measured counts rates Ns measured, , due to the experimentally measured detector dark count rates
,
DC measured
,
, ,
,
1
s measured
s corrected DC measured
d s measured
N
N N
N
(2.4.4)
By examination of the phase matching curve in Figure 2-7 (a), it was determined that for all collection angles represented by the data in Figure 2-8 the spectral bandwidth was filter limited, and therefore the contribution to Ns due to photons collected from the horizontal plane should remain constant with collect. Therefore the linear increase in Ns up to
collect
~ 8 mrad must either be associated (i) the increasing vertical dimension of the aperture, allowing photons within the same spectral band but with different (azimuthal angle about pump) to pass, and/or (ii) due to an increase in proportion of the crystal length over which parametric photons are collected as collect increases.
The first option would be consistent with the collectterm in equation (2.4.3). The second
option implies some change in the loss factor with collect, therefore deffwould also change since deff is a constant. The approximately constant solution value for deff upto
collect
~ 8 mrad suggests that there is no change with collect of the crystal depth from which downconverted photons are collected, and can be assumed constant. This is further justified by realising from geometry that the length along the pump beam within the crystal that is viewed by the detector is approximated byLcollect:
,
tan cosj j
collect collect lab
L R (2.4.5)
j
is the crystal emission angle corresponding to ,
j lab
; taking collect= 1.4 mrad (the
smallest collection angle used) with the crystal and laboratory emission angles at 702.2 nm,
collect
L ~ 16.2 mm which is much greater than the crystal length. Therefore the increase in
s
N with collect is likely the cause of explanation (i).
It is also informative to look at the spot size formed by the collected beam at the detector surface wD; by assuming R >>Rcollect wD can be approximated by ~ f R R collect, where f is the focal length of the detector mounted lenses. For collect =1.4 mrad, wD ~ 40
collect / mrad
0 2 4 6 8 10 12 14 16
Ns
, m
easur
ed / s
-1
0.0 5.0e+4 1.0e+5 1.5e+5 2.0e+5 2.5e+5
deff
, m
easur
ed / pm
V
-1
0.7 0.8 0.9 1.0 1.1 1.2
Figure 2-8 The filled circles show the measured singles counting rate for various aperture sizes in the downconversion beam path. The unfilled circles show the deff values calculated by matching the measured count rates with those calculated through equation (2.4.3) . The quantity is actually the
product deff and it has been assumed that 1 for all collect. The pump power was 21 mW.
The measured non-linear coefficient begins to drop away when the collection angle grows beyond 8 mrad where the spot size at the detector is estimated to be ~ 190 m. Note that for the largest collection angle at which measurements were made Rcollect~ 0.07
,
sinj lab
R and therefore the assumption Rcollect << sin
,
j lab
R required for equation (2.4.3) still holds.
Considering the seven data points corresponding to the smallest aperture radii in Figure 2-1 gives an estimate for deff of 1.03 ± 0.04 pm/ V. This is slightly less than the value of 1.26 pm /V found in the literature [42], and the difference could be due to some unaccounted for loss factor in the experiment such as imperfect optical alignment, or due to some minor damage to the non-linear crystal that had occurred over time. Note that the exact value for D was not known, the value taken was an ‘optimistic’ estimate given by the typical peak value at 650 nm. If the actual quantum efficiency of the detector was lower, then the determined
eff
2.5
Coincident photon detection
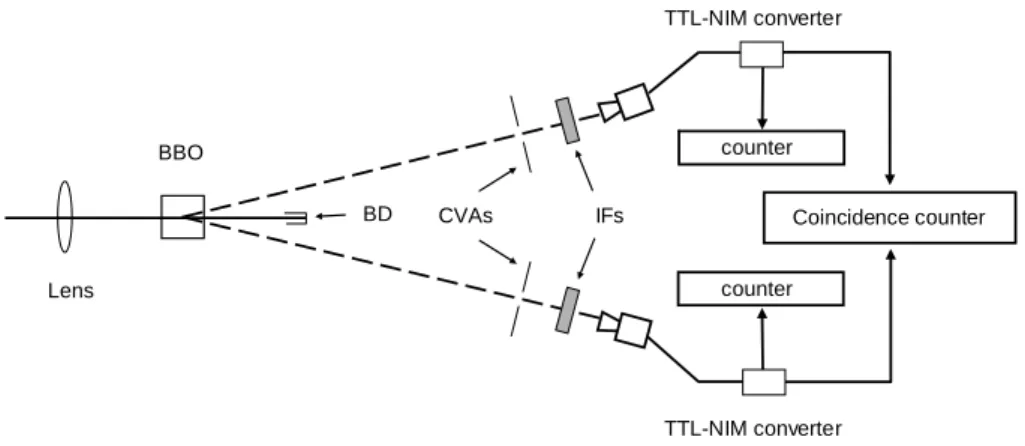
The setup required for measuring the coincident arrival of photons from the downconversion process described in section 2.3.1 is shown in Figure 2-9.
BBO counter
counter
Coincidence counter TTL-NIM converter
TTL-NIM converter IFs
CVAs BD
Lens
Figure 2-9 Setup for measuring coincident arrival of BBO generated pair photons at two detectors. BD stands for beam dump, CVAs; calibrated variable apertures and IF; interference filters.
The output pulse from each detector is split between the single event counter and one of two ports on a coincidence counter (EG&G model 9308). The coincidence counter distinguishes between the two detectors; one detector is designated ‘start’ and the second ‘stop’. The coincidence counter is unable to directly record a coincidence event due to the simultaneous arrival of pulses because it is rendered inactive during a ‘dead-time’ of ~50 ns after receiving one pulse. Therefore the ‘stop’ pulse is delayed relative to the ‘start’ pulse by 60 ns using a coaxial delay line. A coincidence is logged provided the ‘stop’ pulse is received within an 80 ns window after receiving the ‘start’ pulse. After the ‘stop’ pulse is received, or the expiration of the 80 ns time window, the coincident counter is readied to receive a ‘start’ pulse again. Depending on the exact time separation between when the counter receives the ‘start’ and ‘stop’ pulses, the coincidence event is assigned to one of 65536 time bins of equal size, in this way a histogram of coincidence events with time delay is built up for a set of start events, see Figure 2-10.
photons created into different pairs, and secondary pulses from earlier detection events [47]. The number of accidentals was estimated by calculating the average bin population outside the coincidence peak (between 60-70ns and 80-140 ns), and then multiplying this figure by the total number of bins. The accidental-corrected coincidence measurement was the total number of coincidences in the histogram minus the estimated number of accidentals. Typically the estimated accidental coincidence events accounted for ~1 % of the total number of measured events.
Figure 2-10 Coincidence histogram of photon arrivals from the system in Figure 2-9. The data was collected over one minute.
Maximisation of the singles count rates at the two detectors does not always correspond to a maximum in the coincidence counting rate. In order to maximize the coincidence counting rate, the two detectors are placed to collect photons from regions of the downconversion cone that are diametrically opposed and equally distant from the cone centre (since the required photons are degenerate). In practice this is achieved by positioning one detector for the optimum singles count rate and then making small positional adjustments of the second detector in order to optimise the coincidence counting rate while maintaining the overall single count rate at that detector. However even with perfect detector positioning, the efficiency at which photon pairs are detected is still less than unity, i.e. the observed singles count rate at the two detectors is greater than the observed coincidence counting rate. The pair detection efficiency is defined as:
12 12
1 2
R R R
Where R1 and R2 are the dark count corrected single photon counting rates at detectors 1 and 2 respectively and R12 represent the accidental corrected coincidence rate between the two detectors.
For a Gaussian pump beam of radius w close to the detection plane and finite circular detector apertures of radius a, the pair detection efficiency may be shown to be given by [48]:
2
2
12 2 2
2 2
2 1 1
2
1 2 1
2
a erf
w B
a
w a
a w
(2.5.2)
Equation (2.5.2) shows that as a0, 12
a 0. This is because those photons occupying a cross sectional area A1in one optical path between the crystal and detector have correlations with photons in the second path that occupy a cross sectional area A2 A1, even though A1 and A2 may be equally distant from the point of generation. When the apertures are large, it is possible to collect all of the generated photons, and 12is dominated by the constant B:
12 a a B start stop filter1 filter2 lens1 lens2
(2.5.3)
Where start and ηstopare the quantum efficiencies of the start and stop detectors respectively,
while filter1
lens1
and filter2
lens2
are the transmittances of the spectral filter (focussing lens) in front of the start and stop detectors respectively.Significantly, equation (2.5.2) indicates that for fixed collection apertures 12 can be maximized by minimising w , i.e. by focusing of the pump beam to a waist at the detection plane.
for these data there was no focussing of the pump beam. The measurements were then repeated after positioning a 1 m focal length converging lens before the crystal such that the optical path along the pump beam from the lens to the crystal in addition to the downconversion path from the crystal to the detector was ~ 1 m. As a result of the focusing the pump beam was focussed to a 656 m diameter waist at the detection plane. A non-linear least squares fitting routine was used to fit expression (2.5.2) to the 12 measurements as a function of a, where A and w were the fitting parameters. The data and associated fits are shown in Figure 2-11.
It is clear from the data in Figure 2-11 that the deleterious effect on 12 of small aperture radii is reduced when the pump beam was focussed. This is because the focussed pump beam results in a focussing down of the correlation area A 2 occupied by photons in one optical path that are correlated to those photons occupying an area A1 in the other optical path [49].
a / mm
0.0 0.5 1.0 1.5 2.0 2.5 3.0 12
0.00 0.05 0.10 0.15 0.20 0.25 0.30
Figure 2-11 Measurements of the pair collection efficiency. The unfilled circles denote data where the pump beam was unfocussed whereas the filled circles describe data where the pump has been focussed as described in the text. The solid lines are fit to expression (2.5.2)
The system losses were estimated in order to determine value of B from equation (2.5.3). Using the phasematching arguments outlined in section 2.4.2 that relate an aperture-defined collection angle with the spectral bandwidth associated with the collected photons, it was determined that the bandwidth of the collected photons was filter limited. Therefore filter1
and filter2 were estimated by the average measured filter transmission across the entire 3 nm
detector spectral response curve as quoted by the manufacture (0.65). Since the lenses coupling the photons onto the detector were AR coated at 700 nm, lens1,lens21. Combining the estimated efficiencies through equation (2.5.3) gives
12 a a B 0.284 0.031
. This value is in good agreement with the value 0.280 0.013
nolens
B determined from the fit to the ‘no lens’ data in Figure 2-11, and also the value Blens 0.296 0.009 resulting from the fit to the ‘with lens’ data. The uncertainty on B was dominated by the estimated 0.05 uncertainty estimation on start and stop. The uncertainty on Bnolens was greater than the uncertainty on Blensbecause the ‘with lens’ data available to the fitting procedure covered a greater proportion of the slope than for the ‘without lens’ data.
From the least-squares fit procedure to the data in Figure 2-11, the values for w under non-focussed and non-focussed pump conditions were 751 ± 33 m and 258 ± 19 m respectively. This made reasonable correspondence with the directly measured pump beam radii near the detection plane (844 m and 328 m without and with the lens respectively.)
2.6
Alignment and path balancing of the HOM interferometer paths
2.6.1 The HOM interferometer layout and HOM interferogram measurement
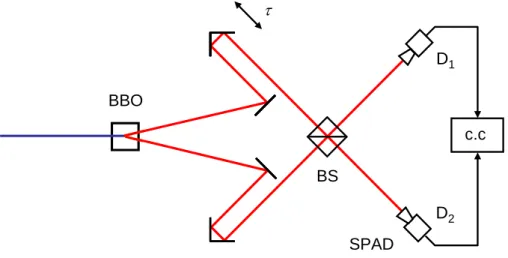
The basic HOM interferometer configuration is shown in Figure 2-12. The pump beam, downconversion medium, single photon and coincidence counting setups are those described in previous sections. The measurement of interest is the coincidence counting rate between the two detectors as a function of . Since HOM interference corresponds to when the photon pairs always emerge from recombiner (BS) through the same output, the interference feature is marked by a drop in the measured coincidence counting rate. The extent or visibility of the HOM interferogram is defined as:
, ,
,
c classical c min
HOM
c classical
N N
V
N
Where Nc classical, is the measured coincidence counting rate in the absence of HOM interference and Nc min, is the minimum in the measured coincidence counting rate due to the HOM interference. In order to observe HOM interference the photon pairs must have some level of indistinguishability; this is discussed further in the following section.
BS
SPAD
c.c
BBO
D1
D2
Figure 2-12 Schematic of built HOM interferometer. The blue line shows the pump beam path and the downconversion is shown by the red lines.
2.6.2 The removal of distinguishing information
HOM interference is an interference effect between the probability amplitudes of different but indistinguishable experimental outcomes as opposed to direct interference between the photon wavepackets at the beam splitter. This implies that under certain experimental conditions quantum interference could be observed in a HOM-like interferometer without the photons ever meeting at the recombiner [22].
amplitudes lead to detectors D and 1 D triggering with the same relative time separation (in 2 Figure 2-13 (a)-(b) this time separation is shown to be zero). Therefore the two probability amplitudes described by (a) and (b) are spatially and temporally indistinguishable and will quantum-interfere provided they have no other property (e.g. wavelength, polarisation) that makes them distinguishable. (c) and (d) represent two coincidence probability amplitudes that occur when the photons paths overlap spatially at the beam splitter but due to a delay imposed on photon A, photon A arrives at the beam splitter after photon B; in this situation
1
D1 D2 ti m e space A B A B D1 D2 ti m e space A B D1 D2 ti m e space A B B A D1 D2 ti m e space A B D1 D2 ti m e space A B (a) (b) (c) (d) (e)
Figure 2-13 Feynman diagrams illustrating the coincidence probability amplitudes for (a)-(b) a well aligned and optical path-balanced interferometer, (c)-(d) a well aligned but optical path-imbalanced interferometer, (e) Two amplitudes corresponding to a misaligned but optical path-balanced interferometer. The ‘twice reflected’ amplitude is given shown by broken lines, the ‘twice transmitted’ amplitude given shown by solid lines.
2.6.3 Alignment of the optical paths through two-beam laser interference
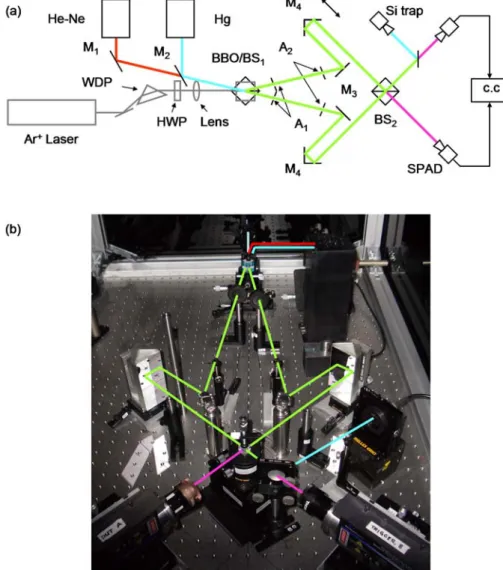
The low-flux and broadband nature of the downconverted photons makes them unsuitable for direct use in a second order interference alignment procedure. Alignment was aided by merging the framework of the HOM interferometer with a Mach-Zehnder interferometer illuminated by a 633 nm helium-neon (HeNe) laser, see Figure 2-14. The required non-collinear amplitude-split alignment laser beams to match the downconversion beam paths were provided by passing the HeNe laser beam through a beam splitter BS positioned in 1 place of the non-linear crystal, and oriented such that the beam enters the cube at an angle to the surface normal.
A key feature of the method is that aperture pairs A1 and A2 (500 m diameter) were
maximized (see Figure 2-9) each of the four apertures were positioned in-turn while maintaining the singles and coincidence counting rate as far as possible.
Figure 2-14 (a) Schematic of alignment/balancing interferometer and HOM interferometer. The flip mirror M2, switches between HeNe and Hg illumination of the Mach-Zehnder interferometer. The
deflecting mirrors M3 and roof mirrors M4 precede the beam splitter BS2. The coincidence counter
(c.c) records the coincident detection events between the SPADs. The optical paths in (a) are drawn with the same colour scheme applied to the photo of the setup in (b).
the alignment laser beam. The tilt of M and 3 BS were adjusted such that a single 2 interference fringe was observed by eye on a viewing screen at one output port of BS . 2
One optical path of the interferometer could be scanned through the movement of the roof mirror M , which was mounted on a piezo translation stage (Physik Instrumente P-625.1)4 .
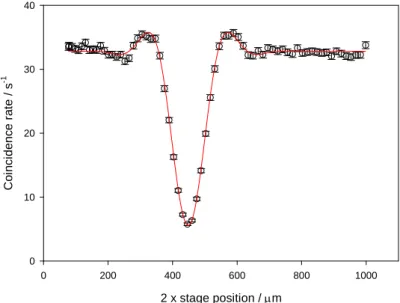
The interference fringes obtained by temporally scanning the interferometer, shown in Figure 2-15, were measured using a silicon trap detector [50]. The uniformity and smoothness of the measured fringes were indicative of good mechanical properties of both the optical delay mechanism and beam steering optics.
2 x roof mirror stage position
243 244 245 246 247
N
o
rm
li
zed
i
net
nsi
ty
0.0 0.2 0.4 0.6 0.8 1.0
Figure 2-15 Interference fringes measured when illuminating the interferometer framework with a 633 nm He-Ne alignment laser, and then scanning one optical path.
2.6.4 Balancing of the interferometer optical paths using 2-beam interference of a short coherence length source
The paths of the interferometer were instead balanced by retaining the Mach-Zehnder framework and exchanging the laser for a spectrally broad emitter (a 100 W high-pressure Hg lamp) by use of a flip-mirror M , Figure 2-14. The light was focussed through a 50 2 m pinhole to ensure good spatial coherence of the beam and then collimated. Interference was only observable at the output port of the recombining beam splitter when the optical paths of the interferometer were balanced to within ~30 m. The balancing was achieved through manual adjustment of the roof mirror such that strongly modulated fringes were observed by eye on a viewing screen.
The profile of the Hg interferogram measured upon scanning the interferometer is shown in Figure 2-16 (a), together with the Fourier transform of the interferogram and the emission spectra of the lamp measured using a SAD portable spectrophotometer. The main peak in the Fourier transform corresponds well to the 577 nm Hg doublet, and the shorter wavelength secondary peak corresponds well to the 546 nm Hg emission line. The line at 546 nm is more intense than the line at 577 nm in the directly measured spectrum whereas in the interferogram Fourier transform the opposite is true; this is because the reflectivity of the interferometer mirrors fall off rapidly in going from 577 nm to 546 nm.
Another useful feature of the Hg source was that although the emission lines of Hg do not coincide with the SPAD pass bands, there was sufficient optical noise at the filter wavelengths for a singles count of ~106 s-1 at the SPADs, the bright signal therefore aided the
repositioning of the detectors from their locations in Figure 2-9 to those shown in Figure 2-14.
To complete the alignment process, the non-linear crystal was repositioned in place of BS1
2 x roof mirror stage position
480 500 520 540
Norm
al
iz
ed
m
e
asured i
n
ten
s
it
y
0.0 0.5 1.0
Wavelength / nm
400 450 500 550 600 650 700
N
o
rm
li
ze
d sp
ect
ral
d
e
n
s
it
y
0.0 0.2 0.4 0.6 0.8 1.0 (a)
(b)
Figure 2-16 (a) Interference fringes measured when illuminating the interferometer framework with a Hg lamp, and then scanning one optical path about the point where it is equal to the other path. The black trace in (b) is the Fourier transform of the interferogram in (a) and the red line is the measured emission spectrum from the lamp.
2.6.5 Comparison of the alignment technique with a published alternative
Here, pairs of apertures in each arm of the interferometer ensure that the alignment beams align with the downconverted fields. The use of a beamsplitter to split the alignment beam ensures that all of the source light is used, facilitating a fully visual alignment procedure without need for an expensive detector array, or the positioning of components based upon calculation.
Closer inspection of the optical paths obtained when using the method described here shows that the alignment beams do not overlap with the downconverted beams back to the point of their creation, instead the alignment beams emerge at a greater angle with respect to the pump beam direction, and refraction at the glass-air surface of the beam splitter parallelizes and overlaps them with the downconverted beams. Figure 2-17(a) shows that the two alignment beams share the same path symmetry about the pump as the downconverted fields, meaning that the path deviation of the alignment beams from the downconverted fields does not have a deleterious effect on the balancing procedure. Note that if the cube beam splitter was replaced with a plate beam splitter, the shared symmetry would be lost and an error would occur in the found balanced state of the downconversion HOM interferometer.
The method described previously in the literature [52] will only work for one downconversion emission angle, pre-determined by the grating characteristic and the wavelength of the alignment laser. The method described here may be applied to the construction of an interferometer where the parametric photons have arbitrary crystal emission angles. For smaller emission angles, the input trajectory of the alignment laser should be set at a smaller angle with respect to the beam splitting surface, and the split alignment beams will emerge from the cube closer to the forward edge. If the angle becomes very small so as to limit the aperture of the output beams, then the beamsplitter should be moved along the pump propagation direction. Figure 2-17(b) shows a suitable scheme for the HOM interferometer of ref. [52] where the crystal and lab downconversion emission angles were 0.66º and 1.0º respectively.
downconversion emission angle may require a larger beam splitter due to the shallow angle between the input alignment beam and beam splitting surface.
Figure 2-17 How the cube beam-splitter alignment technique may be applied to various experimental schemes; the graduations correspond to 10 mm intervals in the main figure and 1 mm intervals in the insets. The blue lines represent the alignment beams while the red lines represent the paths of the pump and downconverted fields. The downconverted and alignment fields are displaced for clarity, although they overlap. (a) For the experiment of this chapter, the cube beam splitter was positioned in place of the downconverter. (b) For smaller emission angles, or situations where the downconverter cannot be removed for the alignment, the cube beam splitter may be placed a distance in front of the crystal. (c) By changing the tilt of the beam splitter and its position perpendicular to the pump, the alignment beams may be made to overlap with downconverted beams having different angles about the pump beam.
alignment beams will emerge from the cube further from the front edge and alignment with the downconversion fields will hold from a point slightly further along the optical path, see Figure 2-17(b).
The beamsplitter technique may also prove useful in aligning experiments incorporating non-degenerate photon pairs where the two photons of a pair are emitted at different angles relative to the pump beam. Alignment of the downconverted field with an alignment beam may be achieved through a translation of the beam splitter perpendicular to the pump direction accompanied by a rotation in the plane of the non-linear interaction. Figure 2-17(c) shows a possible alignment solution for the experiment described in ref. [53] where photon pairs are emitted at lab angles of 5.9º and 11º. Although this scheme may be of use for alignment of optics, the shared symmetry about the pump beam of the alignment and downconverted fields observed in Figure 2-17(a)-(b) is lost, and the technique is therefore of less value for path balancing. However a non-degenerate source is unlikely to be used in a HOM type experiment due to the spectral distinguishability between the photons and they will not interfere even if the temporal distinguishability is removed.
2.7
Interferometer characteristics
2.7.1 Interference dip bandwidth for different interferometer collection angles and frequency filtration
The bandwidth of the HOM dip interferogram is indicative of the spectral bandwidth of the interfering photons; a wider spectral bandwidth corresponds to a narrower interference feature. (c.f. classical two beam interferometry). Figure 2-18 shows that increasing the collection angle has little effect on the dip bandwidth when 3 nm interference filters were used, suggesting that over the entire range of tested collect the filters limited the bandwidth of the interfering photons. Confirmation that the emission bandwidth into 1 mrad was > 3 nm was indicated by a halving of the dip FWHM when 12 nm filters were used. For the 12 nm filter system, the data suggested that the interfering photon spectral bandwidth increased up to collect~ 6 mrad where the HOM dip bandwidth starts to level off, therefore the data indicates that there is a transition from an aperture limited bandwidth collect to a filter limited bandwidth through the increasing range of collect.
collect / mrad
2 4 6
Meas
u
red
H
O
M di
p F
W
H
M
/
m
32 40 48 94 96 98
Figure 2-18 Measured HOM dip bandwidth with varying two photon interferometer collection angle. The filled circles joined by a solid line correspond to measurements where 3 nm filters were mounted at the front of the detectors. The unfilled circles joined by broken lines are associated with measurements using 12 nm bandwidth filters
From the phase matching curve in Figure 2-7 , it was found that when collect 1 mrad,
collect