The Journal of Neuroscience
http://jneurosci.msubmit.net
JN-RM-1350-16R3
Phase-dependent interactions in visual cortex to combinations of first- and
second-order stimuli
Curtis Baker Jr, McGill University
Claire Hutchinson, University of Leicester
Timothy Ledgeway, The University of Nottingham
Phase-dependent interactions in visual cortex to combinations of
first- and second-order stimuli
Abbreviated title:Phase-dependent second-order responses
Claire V. Hutchinson1, Timothy Ledgeway2, & Curtis L. Baker, Jr. 3*
1College of Medicine, Biological Sciences and Psychology, University of Leicester, Leicester, United
Kingdom, LE1 9HN
2School of Psychology, University of Nottingham, Nottingham, United Kingdom, NG7 2RD 3McGill Vision Research Unit, MUHC Research Institute, Department of Ophthalmology, McGill
University, Montreal, QC, Canada H3A 1A1
*Correspondence should be addressed to:
Curtis L. Baker Jr McGill Vision Research MUHC Research Institute 1650 Cedar Ave, Room L11.112 Montreal, Quebec, Canada, H3G 1A4
Tel: +1-514-934-1934 ext.34819 Fax: +1-514-934-8216
Number of pages: 35
Number of figures: 8
Number of words for Abstract: 230
Number of words for Introduction: 467
Number of words for Discussion: 1497
Conflict of interest: none
Acknowledgements:
This research was supported by CIHR Operating Grants (MOP-119498, MOP-9685) to C.B.
C.V.H was supported, in part, by a Human Frontier Science Program Organization Short
Term Fellowship. The authors would like to thank Lynda Domazet, Guangxing Li, and
Vargha Talebi for assistance with some of the experiments. The authors declare no
competing financial interests.
Abstract
2
3
A fundamental task of the visual system is to extract figure-ground boundaries between
4
objects, which are often defined not only by differences in luminance but also by
"second-5
order" contrast or texture differences. Responses of cortical neurons to both first- and
second-6
order patterns have been previously studied extensively, but only for responses to either type
7
of stimulus in isolation. Here we examined responses of visual cortex neurons to the spatial
8
relationship between superimposed periodic luminance modulation (LM) and contrast
9
modulation (CM) stimuli, whose contrasts were adjusted to give equated responses when
10
presented alone. Extracellular single unit recordings were made in area 18 of the cat, whose
11
neurons show very similar responses to CM and LM stimuli as those in primate area V2 (Li
12
et al, 2014). Most neurons showed a significant dependence on the relative phase of the
13
combined LM and CM patterns, with a clear overall optimal response when they were
14
approximately phase-aligned. The degree of this phase preference, and the contributions of
15
suppressive and/or facilitatory interactions, varied considerably from one neuron to another.
16
Such phase-dependent and phase-invariant responses were evident in both simple- and
17
complex-type cells. These results place important constraints on any future model of the
18
underlying neural circuitry for second-order responses. The diversity in the degree of phase
19
dependence between LM and CM stimuli that we observe could help disambiguate different
20
kinds of boundaries in natural scenes.
21
22
23
24
25
Significance
27
28
Many visual cortex neurons exhibit orientation-selective responses to boundaries defined by
29
differences either in luminance or in texture contrast. Previous studies have examined
30
responses to either type of boundary in isolation, but here we systematically measure
31
responses of cortical neurons to the spatial relationship between superimposed periodic
32
luminance-modulated (LM) and contrast-modulated (CM) stimuli whose contrasts
33
are adjusted to give equated responses. We demonstrate that neuronal responses to these
34
compound stimuli are highly dependent on the relative phase between the LM and CM
35
components. Diversity in the degree of such phase dependence could help disambiguate
36
different kinds of boundaries in natural scenes, for example those arising from surface
37
reflectance changes or from illumination gradients such as shading or shadows.
38
39
Introduction
41
42
Natural scenes contain a multiplicity of complex features that provide important information
43
concerning object position, surface structure, boundaries and contours, spatial scale, motion
44
and relative distance. The visual system uses these cues to detect and identify objects in a
45
scene by segregating them from their background. An object may be delineated from its
46
background by intensive "first-order" properties, e.g. variations in luminance or color within
47
different regions of the image, or by more complex "second-order" attributes in which areas
48
are differentiated by cues such as contrast, texture, relative motion and binocular disparity. In
49
natural images, there is a highly structured spatial relationship between occurrences of first-
50
and second-order information (Schofield, 2000; Johnson & Baker, 2004). Human
51
psychophysical studies show that combined first- and second-order cues improve texture
52
segmentation (Smith & Scott-Samuel, 1998; Johnson et al, 2007), and could potentially be
53
used to help resolve ambiguities in first-order information, for example to distinguish surface
54
reflectance vs. illumination effects (Schofield et al, 2006, 2010; Sun & Schofield, 2011).
55
56
Neurons responsive to both first- and second-order stimuli are evident in many visual cortical
57
areas (V1, V2, V5/MT) of the monkey (Albright, 1992; Chaudhuri & Albright, 1997; Li et al,
58
2014; but see El-Shamayleh & Movshon, 2011) and areas 17 and 18 of the cat (Zhou &
59
Baker, 1994; Tanaka & Ohzawa, 2006; Rosenberg & Issa, 2011). Many of these demonstrate
60
form-cue invariance to first- and second-order motion patterns, in that they respond to either
61
kind of stimulus with consistent direction-selectivity and preferred orientation (Albright,
62
1992; Geesaman & Anderson, 1996; Mareschal & Baker, 1999; Li et al, 2014). Human fMRI
63
also reveals orientation- or direction-selective responses to first- and second-order stimuli in
many extrastriate cortical areas as well as primary visual cortex (Nishida et al, 2003; Seiffert
65
et al, 2003; Larsson et al, 2006; Hallum et al, 2011).
66
67
In natural images, first- and second-order information often occur at coincident locations
68
(Johnson & Baker, 2004), for example at occlusion boundaries. Therefore it is important to
69
understand how these two types of information are combined in visual cortex. However
70
previous neurophysiological studies have only examined neuronal responses to first- or
71
second-order stimuli in isolation. Here we systematically measure responses of cortical
72
neurons to the spatial relationship between superimposed periodic luminance-modulated
73
(LM) and second-order contrast-modulated (CM) stimuli whose contrasts are adjusted to give
74
equated responses. These recordings are done in area 18 of the cat, whose neurons show CM
75
and LM responses largely similar to those in macaque area V2 (Li et al, 2014). We find that
76
many of the neurons exhibit responses to compound stimuli that are highly dependent on the
77
relative phase between the LM and CM components, with differing degrees of suppressive
78
and/or facilitatory interactions in different neurons. Such dependent and
phase-79
invariant responses are evident in both simple- and complex-type cells.
80
81
82
Materials and methods
8384
Animal Preparation and Maintenance
85
Initial anesthesia of adult cats of either sex was induced by isoflourane/oxygen (3-5%)
86
inhalation, followed by intravenous cannulation and bolus I.V. delivery of thiopentone
87
sodium (8 mg/kg) or propofol (5 mg/kg), atropine sulphate (0.05 mg/kg) and dexamethasone
88
(0.2 mg/kg). The corneas were protected during surgery with topical carboxymethylcellulose
(1%). Surgical anesthesia was maintained with supplemental doses of thiopentone as
90
required, or with propofol (6 mg/kg/hr), and all surgical wounds were infused with
91
bupivacaine (0.25%). A secure airway was established by tracheal cannulation or intubation.
92
A craniotomy (H-C A3/L4) provided access to cortical area 18 (Tusa et al, 1979) using
glass-93
coated platinum-iridium or parylene-coated tungsten microelectrodes (Frederick Haer). The
94
cortical surface was protected with 2% agarose (Sigma, Type 1-A) and petroleum jelly.
95
96
After completion of surgery, animals were paralyzed with an intravenous bolus injection of
97
gallamine triethodide (10mg/kg), followed by infusion (10 mg/kg/hr). Anesthesia was
98
maintained with sodium pentobarbital (1.0 mg/kg/hr) in earlier experiments, or with fentenyl
99
(9 mcg/kg bolus, then 26 mcg/kg/hr) and propofol (5 mg/kg-hr) in later experiments,
100
supplemented with oxygen/nitrous oxide (70:30) and dextrose-saline (2ml/hr). Expired CO2,
101
blood O2, heart rate, electroencephalogram, and temperature were monitored throughout the
102
experiment and maintained at appropriate levels. Corneal protection was provided by neutral
103
contact lenses, and emmetropia at a distance of 57 cm was provided by spectacle lenses
104
selected with slit retinoscopy, and artificial pupils (2.5 mm). All animal procedures were
105
approved by the McGill University Animal Care Committee and are in accordance with the
106
guidelines set out by the Canadian Council on Animal Care.
107
108
Visual Stimuli
109
Visual stimuli were produced on a Macintosh computer (MacPro 4,1, MacOS 10.6.8, 2.66
110
Ghz/4 core, 6 Gb, NVIDIA GeForce GT120) using custom software written in Matlab (The
111
Mathworks) with the Psychophysics Toolbox (Brainard, 1997; Pelli, 1997; Kleiner et al,
112
2007). Stimulus patterns were displayed on a CRT monitor (NEC FP1350, 20”, 640x480
113
pixels, 75 Hz, 36 cd/m2, bit depth 8), placed at a viewing distance of 57 cm. The monitor’s
gamma nonlinearity was measured with a photometer (United Detector Technology) and
115
corrected with an inverse lookup table.
116
117
Three types of stimulus patterns were employed: first-order luminance-modulated (LM)
118
gratings, second-order contrast-modulated (CM) envelopes, and a compound of the two (LM
119
+ CM). In each case, these were zero-balanced patterns of contrast against a mean luminance
120
background, L0.
121
122
Luminance gratings were spatially one-dimensional sinusoidal modulations (Fig. 1A,B):
123
124
L(x, y, t) = L0{1 + CL sin[2π(ωωs(x cos θ + y sin θ) - ωtt)]}, (1)
125
126
where CL = Michelson contrast of luminance modulation, ωs= spatial frequency, θ =
127
orientation, and ωt = temporal frequency. The second-order stimuli (“contrast envelopes” -
128
Fig. 1C,D) were spatially one-dimensional sinusoidal modulations of the contrast of a
high-129
spatial frequency carrier grating:
130
131
L(x, y, t) = L0{1 + Carr(x, y) [1 + Env(x, y, t)] / 2}, (2)
132
133
The carrier grating was a high spatial frequency, stationary sine wave grating:
134
135
Carr(x, y) = Cc sin[2π ωc(x cos θc + y sin θc)], (3)
136
where Cc = carrier contrast, ωc = carrier spatial frequency, and θc = carrier orientation. The
138
carrier was multiplied by an envelope pattern, consisting of a low spatial frequency, drifting
139
sine wave grating:
140
141
Env(x, y, t) = CEsin[2π (ωωs(x cos θ + y sin θ) - ωt t) + φ], (4)
142
143
where CE= envelope contrast, ωs and ωt = envelope spatial and temporal frequency, and θ =
144
envelope orientation. The compound stimuli were superpositions of the LM and CM patterns:
145
146
L(x, y, t) = L0{{1 + Carr(x, y) [1 + Env(x, y, t)] / 2}
147
+ {CL sin[2π (ωωs(x cos θ + y sin θ) - ωtt)]}}, (5)
148
149
Note that these three stimuli have identical envelope orientation (θ and spatial and temporal
150
frequencies (ωs, ωt), but can have varying values of relative spatial phase (φ) — examples of
151
single frames and 1-d profiles are shown in Figures 1E,G and 1F,H (φ= 0 and φ = 180 deg,
152
respectively). LM and CM stimuli were considered to be "in-phase" (0 degrees) when the
153
high and low luminance bars of the grating were centered on the high and low contrast bars
154
of the envelope, and "anti-phase" (180 degrees) in the opposite case - this definition was
155
determined a priori.
156
157
Stimulus patterns were presented within a cosine-tapered circular aperture, against a uniform
158
background at the mean luminance of the pattern. The same mean luminance was also
159
maintained during intervals between stimuli, and presented as blank conditions for
160
measurement of spontaneous activity.
161
163
Electrophysiology
164
The microelectrode was advanced with a stepping-motor microdrive (M. Walsh Electronics,
165
West Covina, CA). Single units were isolated with a window discriminator (Frederick Haer)
166
and isolation was monitored on a delay-triggered oscilloscope. Manually controlled
bar-167
shaped stimuli were used to approximately map the receptive field and determine ocular
168
dominance. The display screen was centered on the receptive field and subsequent stimuli
169
were delivered only to the neuron’s dominant eye. Spike times were recorded with 0.1 msec
170
resolution (ITC-18, Instrutech), and their temporal registration with the stimulus was
171
established with reference to an optical sensor (T2L12S, TAOS, Texas) placed over a corner
172
of the display containing stimulus timing information. Within an experimental run, different
173
stimulus conditions were presented for 0.5-1.0 sec in randomly interleaved order (0.5 sec for
174
LM gratings, 1.0 sec for CM or LM + CM stimuli), with 5-20 repetitions of each stimulus.
175
Poststimulus time histograms and plots of average spike frequency as functions of varied
176
stimulus parameters were displayed on-line. Spike times and stimulus information were
177
recorded to hard disk files for subsequent detailed analysis.
178
179
Each neuron was quantitatively characterized with conventional tuning-curve measurements
180
using first-order grating patterns to establish its optimal orientation, spatial/temporal
181
frequency, simple/complex classification, and location and size of its receptive field. Each
182
neuron was assessed for responsiveness to second-order stimuli using procedures like those
183
employed previously (e.g., Mareschal & Baker, 1999; Tanaka & Ohzawa, 2006): contrast
184
envelope stimuli were presented, using envelope parameters (orientation, spatial/temporal
185
frequency) which were optimal for first-order stimuli, and a series of relatively high carrier
186
spatial frequencies were tested (typically ~ 0.5 to 3.0 cpd). A neuron was considered
envelope-responsive if the data exhibited a bandpass tuned response to the spatial frequency
188
of the carrier, which was clearly distinct from its response to luminance gratings, such that
189
the contrast envelope response clearly could not be mediated by the same mechanism
190
underlying the response to first-order gratings. Then using this optimal carrier spatial
191
frequency, the response to a series of carrier orientations was systematically tested to further
192
optimize the response. All subsequent tests employed these individually optimized
193
parameters for contrast envelopes, and first-order luminance gratings were used with
194
parameters matched to those of the second-order envelopes.
195
196
Following these preliminary measurements, subsequent experiments were performed on
197
envelope-responsive neurons. Contrast response functions (Ledgeway et al, 2005) were
198
measured for both first-order (luminance grating) and second-order (contrast envelope)
199
stimuli, using identical values of envelope orientation and spatial/temporal frequency. From
200
these data, contrast values for the two stimuli were selected that would produce
201
approximately equated responses. Because neurons are typically more responsive to LM than
202
to CM patterns, we chose a high CM envelope contrast (typically 100%) and matched the
203
spike frequency with an equivalent LM contrast. Unless otherwise noted these values were
204
used for the compound (LM + CM) stimuli which were presented at a series of values of
205
relative spatial phase.
206
207
Quantitative measurements for this study were obtained from 76 neurons in nine animals.
208
Note that this work was carried out in conjunction with other studies on the same animals,
209
being conducted concurrently. Of these neurons, 28 were significantly envelope-responsive
210
and their isolation was maintained sufficiently long (ca 2 hours) to obtain all the preliminary
measurements and the contrast-response and phase-interaction datasets to qualify for
212
inclusion in the study.
213
214
Data Analysis
215
Spike times were collected into poststimulus time histograms (bin width 10 msec), and plots
216
of time-averaged spike frequency as functions of varied parameters were constructed.
217
Neurons were classified as simple or complex type based on the ratio of response at the first
218
harmonic of stimulus temporal frequency to the average firing rate (Skottun et al, 1991).
219
Optimal parameters for descriptive mathematical functions (see below) were estimated using
220
curve-fitting functionality of Kaleidagraph (Synergy Software) or Matlab (The Mathworks).
221
222
223
Results
224225
Contrast response functions
226
Neurons were markedly less responsive to CM than to LM stimuli, consistent with previous
227
studies (Ledgeway et al, 2005). To maximize the opportunity to detect interactions between
228
the two stimuli, and ensure that the response would not be dominated by the LM stimulus, we
229
amplitude-equated (‘matched’) the two stimulus types in terms of each neuron’s
230
responsiveness. This was achieved by measuring contrast response functions (CRFs) for each
231
stimulus type, using optimized stimulus parameters as outlined above. Note that for each 232
neuron the orientation, spatial frequency, temporal frequency and direction of motion 233
of the modulation waveforms were identical for LM and CM, and in the case of CM the 234
optimal carrier was also used. Based on these measurements we selected values of grating
235
and envelope contrast that elicited an approximately equivalent response (Fig. 2A,B, green
dashed lines). A CM carrier contrast of 70% was used throughout to ensure that the sum of
237
carrier contrast for CM and luminance contrast for LM would be physically realizable, i.e.
238
not exceeding 100%.
239
240
Phase-dependent responses
241
LM and CM stimuli were superimposed, at their response-matched amplitudes, and responses
242
(average spikes/sec) were recorded as a function of their relative spatial phase offset. In the
243
example of a complex-type cell shown in Figure 2C, the response was markedly dependent
244
on the relative spatial phase difference between LM and CM stimuli, with a peak response at
245
a relative spatial phase somewhat greater than zero (close to phase-alignment, Fig. 1C). As
246
the spatial phase offset between the two stimuli increased, responses became less vigorous,
247
producing the weakest responses when LM and CM stimuli were close to anti-phase (180
248
deg, Fig. 1F).
249
250
To quantify the magnitude of spatial phase dependence of a neuron's responses, the measured
251
spontaneous activity was subtracted, and the response R as a function of relative spatial phase
252
φ was fit with a descriptive function:
253
254
R = a [0.5 1 + cos (φ - φmax)]0.5 + Rmin, (6)
255
256
where φ is relative spatial phase between the stimuli, Rmin is the minimum response
257
(spikes/sec), a is a scaling factor, φmax is the spatial phase producing maximum response
258
(Rmax = Rmin + a). This function corresponds to linear vector summation between two
259
sinusoids of equivalent amplitude. Rmax would only equal Rmin if there were no vector
260
summation (i.e. if the summation process was phase-invariant). An example of such a
fit is shown by the blue contour in Figure 2C - for illustration, the spontaneous rate has been
262
added back onto the fitted function values, to compare to the data points on the plots that also
263
include the spontaneous rate.
264
265
To assess the degree of anisotropy in a neuron's response vs. the relative spatial phase, a
266
phase-dependency index (PDI) was calculated as:
267
268
PDI = (Rmax – Rmin) / (Rmax + Rmin), (7)
269
270
where Rmax and Rmin are the maximal and minimal spontaneous-subtracted responses,
271
respectively. This PDI value lies between zero, indicating no phase-dependent interaction
272
(i.e. spike frequency remained relatively constant irrespective of the relative spatial phase
273
between LM and CM), and unity, indicating a pronounced interaction (highest degree of
274
anisotropy, with a well-defined null phase having zero response).
275
276
Six additional examples of such relative-phase responses are shown in Figure 3.
277
In the majority of cases exhibiting a marked phase interaction, maximal responses
278
corresponded to a spatial phase offset close to 0 deg (in-phase). However, some neurons
279
responded maximally at other relative spatial phase offsets (e.g. Fig. 3E). Minimal responses
280
typically occurred around 180 deg relative to the phase offset that produced the maximal
281
response and corresponded to either a distinct ‘null’ or to a general ‘flattening’ of responses
282
at a number of phase offsets around anti-phase. However the responses of some neurons
283
showed little or no phase dependency (e.g. the complex cell in Fig. 3D) and were largely
284
invariant irrespective of the phase-relationship between the two superimposed visual stimuli.
285
For cells with low PDI, it is possible that the estimated φmaxcould depend heavily on the
287
initial value chosen for the curve fitting procedure. To address this concern, we re-ran the
288
curve fitting for every neuron using a series of initial φmaxvalues. For this we used a least
289
squares simplex (Nelder-Mead) method to fit Equation 6 repeatedly to each neuron’s
290
spontaneous-subtracted data, and systematically varied the initial φmaxestimate from 0 to 360
291
deg in steps of 1 deg. The initial estimates for the other curve-fit parameters were jittered by
292
±50% on each pass. We then found the set of best-fitting parameters that gave the highest
293
goodness-of-fit (R2) overall for each cell. Thus we are confident that the tendency for a φmax
294
close to 0 deg is not an artifact of initial conditions in the curve fitting procedure.
295
296
A scatterplot of PDI values and φmax (deg) for each neuron in our sample (N = 28) is shown in
297
Figure 4. Different neurons displayed a wide range of responses to the combined LM and CM
298
patterns, with many examples exhibiting a ‘peak’ with maximal response at one particular
299
spatial phase, and therefore having a PDI substantially greater than zero.A paired-samples
t-300
test confirmed maximal and minimal responses were significantly different (t = 5.829; df =
301
27; p < 0.0001) across the sample population, demonstrating the existence of
phase-302
dependent interactions between LM and CM responses. Irrespective of their PDI value,
303
neurons typically produced their maximal responses at spatial phase offsets (φmax) close to 0
304
deg. This was true of both simple (circles) and complex cells (triangles) (Fig. 4). Indeed, 86%
305
of neurons exhibited their peak response at spatial phases within ± 45 deg of zero. A
306
complete ‘null’ (PDI = 1.0) was exhibited by 36% of the neurons. The relationship between
307
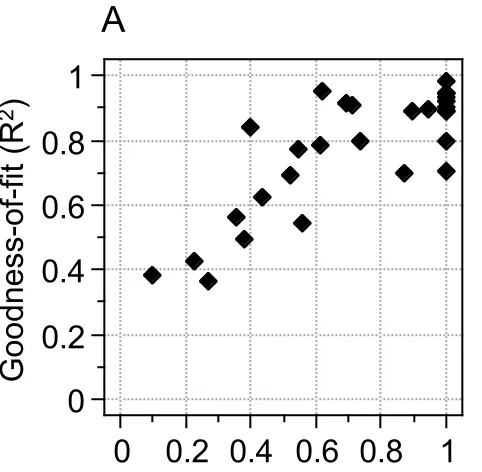
PDI and goodness-of-fit (R2) values derived from fitting Equation 6 is shown in Figure 5A.
308
Although in principle a relatively low R2 could equally reflect either a weak
phase-309
dependency or a jagged (noisy) but strong phase-dependence, there is a clear systematic trend
for low R2 values to be associated with the low PDI values, suggesting it is predominantly a
311
characteristic of cells exhibiting little or no phase-selectivity.
312
313
Since the anesthesia changed between earlier and later experiments, we checked whether the
314
anesthesia type was predictive of the degree of phase sensitivity. For each anesthesia type,
315
the PDIs were distributed across the possible range. An independent samples t-test showed
316
that the PDIs did not differ significantly with the type of anesthesia (t = 1.76; df = 26; p =
317
0.0902). Therefore we do not believe the change in anesthesia had an effect on the degree of
318
phase sensitivity.
319
320
The preference of most neurons for a near-zero phase might suggest that this is a
321
consequence of visual neurons responding better to “dark” than to “light” stimuli (e.g. Yeh et
322
al, 2009; KombanJin et al, 201408), since there is a perceptual appearance that the dark bars
323
of LM appear more prominent for the in-phase condition (Figure 1E, F). However in our
324
stimuli the luminance modulation (LM) was simply linearly added to the contrast modulation
325
(CM) - so both the light and dark bars/bands of the LM are always physically present, i.e. at
326
all relative spatial phases. From the 1-d profiles in Figure 1G,H it is clear that the net
327
excursions above and below the mean are equivalent for both the in-phase and anti-phase
328
stimuli.
329
330
Our electrode penetrations were slightly oblique to the surface, traversing all the laminae
331
down to white matter. However there was no systematic significant relationship between the
332
PDI value and depth of the recording (Pearson product-moment correlation r = -0.0248; df =
333
26; p = 0.9023). The neurons with the highest PDI values (1.0) spanned the full range of
334
recorded depths. Thus it is highly unlikely that the high PDI cells were concentrated
preferentially within a particular range of depths.
336
337
To quantify how a given neuron's summation of the two kinds of stimuli differs from simple
338
linear additivity, and how this nonlinearity differs from one neuron to another, we also
339
calculated the following ratios:
340
341
Enhancement ratio = Rmax / (Req - Rspon), (8)
342
343
Suppression ratio = Rmin / (Req - Rspon), (9)
344
345
where Req is the firing rate of the neuron that was chosen to equate the grating and envelope
346
contrasts of the stimuli used to investigate phase interactions, and Rspon is the neuron's
347
spontaneous firing rate. Note that Rspon is not removed in the numerators of these ratios,
348
because Rmax and Rmin are obtained from curve-fits to spontaneous-subtracted responses. Req,
349
however, is a measured response value, which includes the spontaneous rate. The Rspon values
350
were measured from the average responses to the blank conditions that were interleaved with
351
the phase conditions in the LM + CM experiment. These spontaneous rate values were not
352
significantly different from those similarly obtained from the LM and CM contrast response
353
measurements, as confirmed with a 1-way, repeated measures ANOVA (F(2, 50) = 1.335; p =
354
0.2724).
355
356
One neuron was excluded from this analysis because the derived Rspon values marginally
357
exceeded the Req values. An enhancement ratio of two (red dashed line, Fig. 5B) indicates
358
that the maximal response (Rmax) of the cell is exactly twice as much to both stimuli together
359
as to each in isolation (linear summation). Similarly a suppression ratio of zero (blue dashed
line, Fig. 5B) indicates complete nulling of the neuron’s response when the stimuli are in
361
anti-phase (Rmin), relative to φmax. Enhancement ratios spanned 0.627 to 4.209 (mean = 2.082)
362
and suppression ratios spanned 1.647 to -0.933 (mean = 0.342), indicating considerable
363
heterogeneity amongst our neuron population (Fig. 5B). There was a moderate tendency for
364
the magnitude of the suppression ratio to decrease as PDI increased, indicating a greater
365
suppressive influence for neurons that exhibited the largest phase-dependencies. Whether
366
neurons were simple- or complex-type did not systematically affect either ratio.
367
368
To confirm the appropriateness of our LM and CM response-matching procedure, for a
369
number of neurons we measured phase-dependent interactions between LM and CM at two
370
different response-matched contrasts. An example from a simple-type neuron is shown in
371
Fig. 6. LM (Fig. 6A) and CM (Fig. 6B) contrasts were matched at either 14 (purple dotted
372
lines) or 28 (green dotted lines) spikes/sec. Comparable phase-dependence was evident at
373
both response-matched amplitudes (14 spikes/sec, Fig 6C; 28 spikes/sec, Fig. 6D), with
374
similar φmax and PDI values for each, thereby verifying the robustness of our matching
375
paradigm and confirming that the absolute firing rate chosen to equate the two types of
376
stimuli was not critical to the pattern of results found.
377
Some of the sampled neurons were simple-type cells, and thus had modulated
378
responses to the drifting LM or CM stimuli. We wondered whether analysis of the temporal
379
phases of these responses might be related to the dependence on relative phase of LM and
380
CM stimuli. To do this we examined the temporal phase of the first harmonic at the equated
381
contrast value, in the contrast response measurements (interpolating where necessary) for LM
382
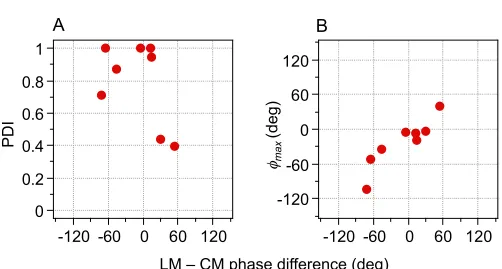
and CM gratings. Figure 7A shows that the amount of phase interaction, PDI, did not show a
383
significant relationship with the difference in temporal phases for LM and CM responses
384
(Pearson product moment correlation coefficient r = -0.4750; df = 6; p = 0.2342), though this
may not be surprising in view of the small sample size. However in Figure 7B, φmax shows a
386
clear and statistically significant positive association (r = 0.9088; df = 6; p = 0.0018) with the
387
temporal phase difference. As the temporal phase difference increases, the φmax also
388
systematically increases. So it looks like a lawful and expected relationship, for the simple
389
cells at least, that the variation in φmax away from a relative spatial phase of zero is driven by
390
the difference in the temporal phases of the response to the two types of stimulus.
391
392
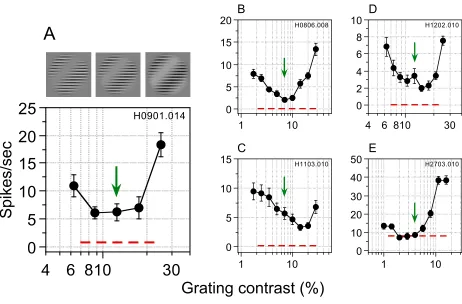
Amplitude-dependent responses
393
Neurons typically exhibited an enhanced response when LM and CM stimuli were
phase-394
aligned and a diminished response at or around anti-phase (Fig. 2C, Fig. 3 and Fig. 6C,D).
395
However the magnitude of the neuronal response might be not only determined by the spatial
396
phase offset between LM and CM — it could also be affected by other factors such as the
397
relative amplitudes of the two spatially superimposed stimuli. When LM and CM stimuli
398
were equated in terms of response, neurons produced a ‘null’ or minimum response at
anti-399
phase, compared to their ‘in-phase’ response. This is presumably because, in the former
400
condition, LM and CM effectively cancelled each other out (Fig. 1F) and no net driving
401
signal was available to the neuron. At anti-phase, effective visual information can be
402
reintroduced by increasing the amplitude of one stimulus relative to the other so that they are
403
no longer effectively balanced. If one stimulus drives the neuron more strongly than the
404
other, the nulling would be abolished and the neuron should become more responsive. To test
405
this notion, we fixed the amplitude of the CM stimulus at the value used to measure
phase-406
dependent interactions, and varied the contrast of the LM stimulus at the neuron's null-phase,
407
so that it was either less than, greater than, or equal to that derived from the
response-408
matching procedure (green arrows in Fig. 8). When stimuli were superimposed in anti-phase
409
with their amplitudes carefully equated, the neuron produced a minimal response. However
when the LM contrast was either reduced or increased beyond this match point, the neuron's
411
response increased as the two superimposed stimuli became progressively mismatched.
412
Figure 8B-E shows results from a further four representative neurons. The precise nature of
413
the interaction varied according to the contrast range employed in each neuron, which was
414
determined by the contrast response functions (CRFs) for each stimulus type and constrained
415
by the requirement that the sum of the LM grating contrast and CM carrier contrast cannot
416
exceed 100%. Among the examples of these measurements shown in Figure 8, some cells
417
exhibited responses that were reasonably symmetrical around the central match point (Fig.
418
8A,B,D), indicating that LM and CM were well equated at this contrast level. In some cases
419
the responses were appreciably less symmetrical, which may be due in part to imperfect
420
equating of the stimulus components (Fig. 8C) or the limited contrast range available (Fig.
421
8E).
422
423
424
Discussion
425
426
We have shown that neurons in early visual cortex, which respond form-cue invariantly to
427
first-order luminance gratings (LM) and second-order contrast envelopes (CM), responded in
428
a systematic manner to the relative spatial phase offset between the two kinds of patterns
429
when they are superimposed. In both simple- and complex-type cells, maximal responses
430
typically occurred when response-equated LM and CM were superimposed at or close to
431
phase-alignment, with a minimal response when in anti-phase. In many cases maximal and
432
minimal responses were markedly different, to varying degrees in different neurons. Neurons
433
varied substantially in the relative roles of suppressive or facilitative interaction effects. The
434
degree of this interaction between LM and CM at anti-phase could be modified by increasing
the amplitude of one stimulus relative to the other - when the LM amplitude was either
436
reduced or increased around a fixed CM amplitude, responses increased as the two
437
superimposed stimuli became progressively mismatched.
438
439
An important concern in experiments utilizing CM stimuli is that the observed neuronal
440
responses might be due to "distortion products" from nonlinearities of the display device or
441
the photoreceptors (Zhou & Baker, 1994; MacLeod et al., 1992). Such artifactual responses
442
would occur irrespective of carrier pattern characteristics. CM responses here were
443
selectively tuned to relatively high values of carrier spatial frequency, well outside the
444
luminance passband, and thus highly unlikely to be artifactual. The phase-dependence of the
445
response to combined LM and CM could arise in a similarly artifactual manner. However, in
446
that case the optimal phase value would always be the same - for example an early expansive
447
nonlinearity would always give φmax = 0 deg. This is because an expansive nonlinearity
448
introduces a distortion product into the neural representation of a contrast-modulated image,
449
with the same frequency and phase as the modulating waveform (see Figure 1 of Smith &
450
Ledgeway, 1997), that will combine with a superimposed luminance grating of the same
451
spatial phase to produce a maximal response. We observed a considerable scatter in values of
452
optimal phase in different neurons, again making such a possibility highly unlikely.
453
454
It is entirely possible that we may have missed some relevant neurons, due to our protocol.
455
Our neuron search stimulus was a bar of light and, as such, would not reveal neurons that
456
were responsive to only CM stimulus attributes, or even possibly a CM-driven neuron whose
457
response to CM can be modulated by LM. We only examined neurons that responded both to
458
LM and to CM in isolation, so we might have missed, for example, neurons that are
459
unresponsive to CM in isolation, but whose LM response is differentially affected by
superposition of CM stimuli in different relative phases. Moreover there might exist neurons
461
that respond only to specific stimulus combinations, but not to LM or CM stimuli alone.
462
Currently there is no evidence for the existence of neurons having such highly nonlinear
463
summation, but if they were present we would have missed them.
464
465
Psychophysical studies of LM and CM mixtures
466
Psychophysical studies have examined the degree to which first- and second-order cues
467
interact perceptually when they are spatially superimposed. Smith and Scott-Samuel (1998),
468
for example, showed that spatial frequency discrimination and speed discrimination could be
469
enhanced when first- and second-order gratings were superimposed compared to when each
470
was presented alone. Similarly Johnson et al. (2007) found that texture discrimination was
471
enhanced or impaired depending on whether the local elements comprising the textures
472
contained spatially correlated or uncorrelated LM and CM information respectively.
473
474
Masking studies have also investigated whether LM and CM gratings interact in a
phase-475
specific manner, the underlying assumption being that if the two types of stimuli are encoded
476
by a common mechanism, then detection should be highly dependent on the two patterns'
477
relative spatial phase. For example Badcock and Derrington (1989) explored the possibility
478
that second-order motion, defined by variations in contrast, is detected on the basis of a
479
distortion product, by adding a moving sine grating (LM) to a drifting beat (CM) pattern of
480
the same spatial frequency. The LM was 180 degrees out of phase with the CM and its
481
amplitude was varied in an attempt to null the hypothetical distortion product. They found
482
that direction-identification performance was unimpaired by the presence of the moving LM.
483
Lu and Sperling (1995) also found no appreciable phase-dependency when performance was
484
measured for combinations of drifting LM and CM noise matched for spatial frequency and
effective amplitude, although others (Scott-Samuel & Georgeson, 1999; Allard & Faubert,
486
2013) have reported phase-dependence but only at high temporal frequencies (15 Hz).
487
Studies using stationary patterns are also equivocal with regard to the influence of relative
488
spatial phase. Some have found moderate to strong phase-selectivity (e.g. Henning et al,
489
1975; Nachmias, 1989) whilst others have reported that masking magnitude is independent of
490
phase (e.g. Cropper, 1998; Willis et al., 2000). A complication is that other factors such as
491
extended practice, individual differences, local luminance cues in the image and the
492
predictability of the phase relationships on each trial are also known to influence performance
493
on this task (Nachmias & Rogowitz, 1983; Badcock, 1984). One possibility that could
494
reconcile these discrepant results is that the human visual system contains neurons responsive
495
to both LM and CM but with a range of phase selectivity (c.f. Fig. 3). Performance in a given
496
situation could depend on which neurons are most sensitive, giving rise to either
phase-497
independent or phase-specific masking.
498
499
Neural mechanisms
500
In early visual cortex of the cat and the macaque, a substantial fraction of the neurons
501
respond both to first- and second-order patterns (Zhou & Baker, 1994; Li et al, 2014). Most
502
proposed models of such responses involve two parallel signal processing pathways, each
503
specialized for one or the other type of stimulus, whose signals are then combined (Mareschal
504
& Baker, 1999). Alternatively, cortical second-order responses could originate from LGN
505
(and ultimately retinal) Y-cells, whose responses carry both luminance information at low
506
spatial frequencies and specificity for carrier attributes at high frequencies (Rosenberg &
507
Issa, 2011). The present findings of phase-dependent combination are not incompatible with
508
either of these schemes. Models based on human psychophysics have involved separate early
509
detection of the two kinds of stimuli, with subsequent interactions at a later stage (Georgeson
& Schofield, 2002). A model with cross-wise gain control interactions between pathways
511
carrying a mixture of first-and second-order information (Schofield et al, 2010; Sun &
512
Schofield, 2011) predicts our observations of stronger responses to in-phase than anti-phase
513
conditions.
514
515
As a baseline reference, it is worth considering that a cortical neuron might just linearly add
516
the separately computed responses to LM and CM stimuli. In the case of a simple-type cell,
517
the modulated responses to the LM and CM stimuli would sum maximally at one phase, and
518
cancel out at the opposite phase, giving a PDI approaching unity. In fact the optimal relative
519
phase values were linearly predictable from the phase lags of the LM and CM alone (Fig.
520
7B). The lack of relationship to the PDI value (Fig. 7A) may be because the effect of the
521
temporal phase lag is to effectively shift the φmax value in a neuron which already is, or is not,
522
phase-selective. Complex-type cells might be thought of as linearly adding energy-like
523
responses to LM and CM stimuli, which would not be modulated, and hence their summation
524
should be phase-invariant (PDI about zero). Alternatively a complex cell might result from an
525
energy-type operation on pooled responses of simple cell (modulated) responses to LM and
526
CM stimuli, whose early summation would give a high PDI. In our sample the complex-type
527
cells showed a wide range of PDI values (Fig. 4), suggesting a continuum between such types
528
of models.
529
530
Functional implications / Significance
531
These neurons show complex interactions between both amplitude and phase of LM and CM
532
components, which are in some cases consistent with vector summation. This finding
533
suggests a modification of the form-cue invariance principle (Albright, 1992) - while these
534
neurons are form-cue invariant to orientation, spatial frequency, and motion direction, they
are in most cases not invariant to the relative phase of superimposed first- and second-order
536
components.
537
538
These properties might have implications for how the visual system processes natural images.
539
Neurons with little or no LM + CM phase-dependence would respond to boundaries
540
regardless of the configuration of their components, while those having a strong phase
541
dependency would respond selectively to particular co-occurrences of first- and second-order
542
information in natural images (Johnson & Baker, 2004). These neurons’ responses carry
543
information that may help disambiguate whether luminance changes in the retinal image arise
544
from surface reflectance changes, or from illumination gradients such as shading or shadows
545
(Schofield et al, 2006; 2010; Sun and Schofield, 2011). More generally, the heterogeneity in
546
degree of phase-dependent interactions and suppression vs. enhancement might provide a
547
basis for disambiguating or decoding a variety of different kinds of boundaries. A promising
548
future direction would be to examine the relative phases of LM and CM components at
549
boundaries in natural images that arise from different causes.
550
References
552553
Albright TD (1992) Form-cue invariant motion processing in primate visual cortex. Science
554
255:1141-1143.
555
556
Allard R, Faubert J (2013) No second-order motion system sensitive to high temporal
557
frequencies. Journal of Vision 13(5):4, 1–14, http://www.journalofvision.org/content/13/5/4,
558
doi:10.1167/13.5.4.
559
560
Badcock DR (1984) Spatial phase or luminance profile discrimination. Vision Research
561
24:613-623.
562
563
Badcock DR, Derrington AM (1989) Detecting the displacement of spatial beats: no role for
564
distortion products. Vision Research 29:731-739.
565
566
Brainard DH (1997) The psychophysics toolbox. Spatial Vision 10:433-436.
567
568
Chaudhuri A, Albright TD (1997) Neuronal responses to edges defined by luminance vs.
569
temporal texture in macaque area V1. Visual Neuroscience 14:949-962.
570
571
Cropper SJ (1998) Detection of chromatic and luminance contrast modulation by the visual
572
system. Journal of the Optical Society of America A 15:1969-1986.
573
574
Efron B, Tibshirani RJ (1993) An Introduction to the Bootstrap. London: Chapman & Hall.
575
El-Shamayleh Y, Movshon JA (2011) Neuronal responses to texture-defined form in
577
macaque visual area V2. J Neuroscience 31:8543-8555.
578
579
Geesaman BJ, Anderson RA (1996) The analysis of complex motion patterns by form/cue
580
invariant MSTd neurons. Journal of Neurophysiology 16:4716-4732.
581
582
Georgeson MA, Schofield, AJ (2002) Shading and texture: Separate information channels
583
with a common adaptation mechanism? Spatial Vision 16:59-76.
584
585
Hallum LE, Landy MS, Heeger, DJ (2011) Human primary visual cortex is selective for
586
second-order spatial frequency. Journal of Neurophysiology 105:2121-2131.
587
588
Henning GB, Hertz BG, Broadbent DE (1975) Some experiments bearing on the hypothesis
589
that the visual system analyzes patterns in independent bands of spatial frequency. Vision
590
Research 15:887-899.
591
592
Jin JZ, Weng C, Yeh C-I, Gordon JA, Ruthazer ES, Stryker MP, Swadlow HA, Alonso J-M.
593
(2008) On and off domains of geniculate afferents in cat primary visual cortex. Nature
594
Neuroscience 11:88-94.
595
596
Johnson AP, Baker CL (2004) First- and second-order information in natural images: A
597
filter-based approach to image statistics. Journal of the Optical Society of America A
21:913-598
925.
599
Johnson AP, Prins N, Kingdom FA, Baker CL Jr. (2007) Ecologically valid combinations of
601
first- and second-order surface markings facilitate texture discrimination. Vision Research
602
47:2281-90.
603
604
Kleiner M, Brainard D, Pelli D (2007) What's new in Psychtoolbox-3? In: Paper presented at
605
the 36th European Conference on Visual Perception. Arezzo, Italy.
606
607
Komban SJ, Kremkow J, Jin J, Wang Y, Lashgari R, Li X, Zaidi Q, Alonso J-M (2014)
608
Neuronal and perceptual differences in the temporal processing of darks and lights. Neuron
609
82(1): 224-234.
610
611
Larsson J, Landy MS, Heeger DJ (2006) Orientation-selective adaptation to first- and
second-612
order patterns in human visual cortex. Journal of Neurophysiology 95:862–881.
613
614
Ledgeway T, Zhan C, Johnson AP, Song Y, Baker, CL Jr. (2005) The direction selective
615
contrast response of area 18 neurons is different for first- and second-order motion. Visual
616
Neuroscience 22:87-99.
617
618
Li G, Yao Z, Wang Z, Yuan N, Talebi V, Tan J, Wang Y, Zhou Y, Baker CL Jr. (2014)
619
Form-cue invariant second-order neuronal responses to contrast modulation in primate area
620
V2. J Neuroscience 34:12081-12092.
621
622
Lu Z-L, Sperling G (1995) The functional architecture of human visual motion perception.
623
Vision Research 35:2697-2722.
624
MacLeod DI, Williams DR, Makous W (1992) A visual nonlinearity fed by single cones.
626
Vision Res 32:347-363.
627
628
Mareschal I, Baker CL Jr. (1999) Cortical processing of second-order motion. Visual
629
Neuroscience 16:1-14.
630
631
Nachmias J (1989) Contrast modulated maskers: test of a late nonlinearity hypothesis. Vision
632
Research 29:137-142.
633
634
Nachmias J, Rogowitz BE (1983) Masking by spatially modulated gratings. Vision Research
635
23:1621-1630.
636
637
Nishida S, Sasaki Y, Murakami I, Watanabe T, Tootell RBH (2003) Neuroimaging of
638
direction-selective mechanisms for second-order motion. Journal of Neurophysiology
639
90:3242-3254.
640
641
Pelli DG (1997). The VideoToolbox software for visual psychophysics: transforming
642
numbers into movies. Spatial Vision, 10(4), 437-442.
643
644
Rosenberg A, Issa NP (2011) The Y cell visual pathway implements a demodulating
645
nonlinearity. Neuron 71:348-361.
646
647
Schofield AJ (2000) What does second-order vision see in an image ? Perception
29:1071-648
1086.
649
Schofield AJ, Hesse G, Rock PB, Georgeson MA (2006) Local luminance amplitude
651
modulates the interpretation of shape-from-shading in textured surfaces. Vision Research,
652
46:3462-3482.
653
654
Schofield AJ, Rock PB, Sun P, Jiang X, Georgeson MA (2010) What is second-order vision
655
for? Discriminating illumination versus material changes, Journal of Vision 10(9): 2;
656
doi:10.1167/10.9.2.
657
658
Scott-Samuel NE, Georgeson MA (1999) Does early non-linearity account for second-order
659
motion? Vision Research 39:2853-2865.
660
661
Seiffert AE, Somers DC, Dale AM, Tootell RBH (2003) Functional MRI studies of human
662
visual motion perception: texture, luminance, attention and after-effects. Cerebral Cortex 13:
663
340-349.
664
665
Skottun BC, De Valois RL, Grosof D, Movshon JA, Albrecht DG, Bonds AB (1991)
666
Classifying simple and complex cells on the basis of response modulation. Vision Research
667
31:1079–1086.
668
669
Smith AT, Ledgeway T (1997) Separate detection of moving luminance and contrast
670
modulations: Fact or artifact. Vision Research 37:45–62.
671
672
Smith AT, Scott-Samuel NE (1998) Stereoscopic and contrast-defined motion in human
673
vision. Proceedings of the Royal Society of London B. 265:1573-1581.
674
Sun P, Schofield AJ (2011) The efficacy of local luminance amplitude in disambiguating the
676
origin of luminance signals depends on carrier frequency: Further evidence for the active
677
role of second-order vision in layer decomposition. Vision Research 51:496-507.
678
679
Tanaka, H., & Ohzawa, I. (2006). Neural basis for stereopsis from second-order contrast
680
cues. J. Neurosci. 26:4370-4382.
681
682
Tusa RJ, Rosenquist AC, Palmer LA (1979) Retinotopic organization of area 18 and 19 in the
683
cat. J Comp Neurol 185:657-678.
684
685
Willis A, Smallman HS, Harris JM (2000) Comparing contrast-modulated and
luminance-686
modulated masking: effects of spatial frequency and phase. Perception 29:81-100.
687
688
Yeh C-I, Xing D, Shapley RM (2009) "Black" responses dominate macaque primary visual
689
cortex V1. J Neurosci 29(38) 11753-60.
690
691
Zhou YX, Baker CL Jr. (1994) Envelope-responsive neurons in area 17 and 18 of cat. Journal
692
of Neurophysiology 72:2134-2150.
693
694
695
Figure legends
697698
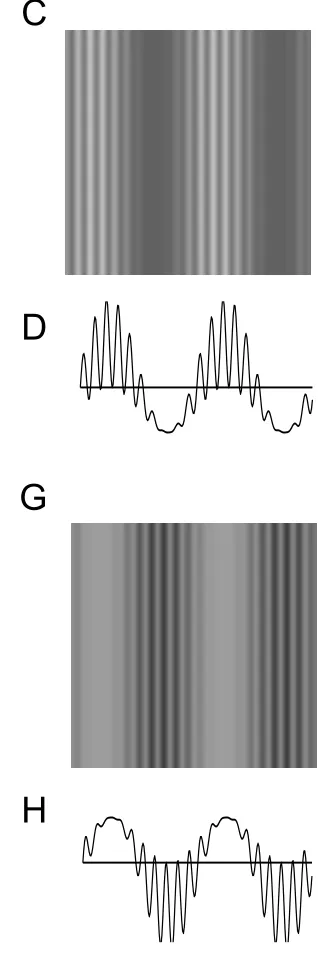
Figure 1. Examples of stimulus composition for main experiment., in which one
699
luminance grating (LM) phase is combined with two different contrast envelope (CM)
700
phases. A, Luminance grating (LM) added to CB, contrast envelope (CM) of the same
701
spatial phase produced EC, an in-phase (0 deg offset) composite stimulus. - note that
702
only the contrast variations about the mean background were added, as detailed in
703
Equation 5. Luminance and contrast modulations (LM & CM) were taken to be in-phase
-704
aligned when high and low luminance and high and low contrast bars of the grating and 705
envelope, respectively, were phase-aligned. B,D,1-d luminance profile corresponding
706
to stimulus image in C. E,F,G,H, same as A,B,C,EDbut the component patterns were
707
summed in anti-phase (180 deg relative phase offset) producing a composite stimulus 708
(F)G in which the high and low luminance bars of the grating were centered on the low
709
and high contrast bars of the envelope, respectively. G,H, 1-d luminance profiles
710
corresponding to stimulus images in E,F respectively See text for further details. 711
712
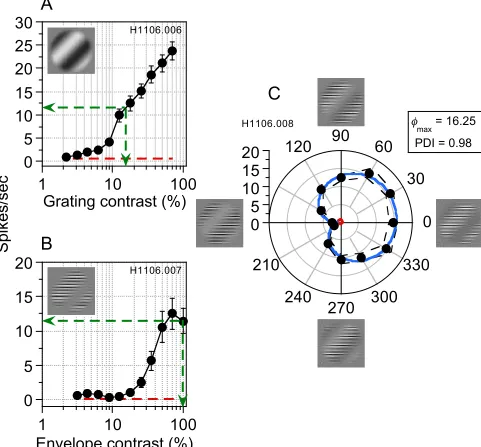
Figure 2. Contrast response functions (CRFs) and phase-dependent interaction, for LM and
713
CM stimuli whose parameters are optimized for an example complex-type cell. A,B, CRFs
714
for a luminance grating and an envelope, respectively. Error bars represent ± 1 S.E.M.
715
Dashed red lines represent spontaneous activity (responses to a blank field). Dashed green
716
lines show the grating (LM) contrast and envelope (CM) contrast that elicited an equivalent
717
average spike frequency from the neuron. These response-matched contrasts were used to
718
superimpose the grating and envelope at a series of relative phase offsets (0-330 deg). Both
719
components of the composite stimuli moved together in the neuron’s preferred direction. C,
720
Average spike frequencies as a function of relative phase offset of the composite stimuli.
Dashed black lines represent ± 1 S.E.M. The red line indicates spontaneous activity. This
722
neuron exhibited responses that depended upon the relative phase relationship between LM
723
and CM stimuli, with maximal response when they were superimposed approximately ‘in
724
phase’ and minimal response when close to ‘anti-phase’. These data were well fit (solid blue
725
line) by a descriptive function (Equation 6), used to derive a phase-dependency index (PDI,
726
Equation 7) and an estimate of the phase offset (φmax) that produced maximal responses.
727
728
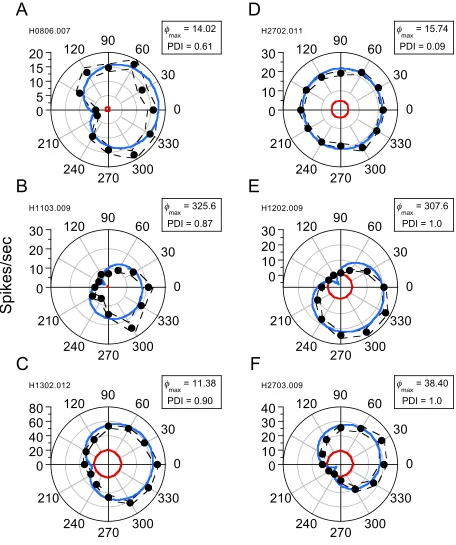
Figure 3. Phase-dependent interactions for 6 representative neurons. Average spike
729
frequency is plotted as a function of the spatial phase offset between response-equated LM
730
and CM stimuli. Dashed black lines indicate ± 1 S.E.M. Dashed red lines show spontaneous
731
activity. Data from each neuron have been fit (solid blue lines) with a descriptive function
732
(Equation 6). Data from simple-type (B,E) and complex-type (A,C,D,F) cells are shown.
733
Neurons displayed varying amounts of phase-dependent interaction. Phase offsets (φmax)
734
corresponding to maximal responses and phase-dependency indices (PDI) are shown at the
735
top right of each polar plot.
736
737
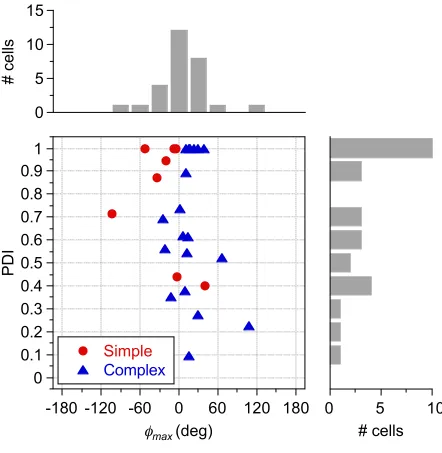
Figure 4. Phase-dependent indices (PDI) plotted against optimal phase alignments (φmax)for
738
all neurons in the sample (N = 28). Simple-type neurons are denoted by red circles and
739
complex-type by blue triangles. Marginal histograms show the distribution of φmax (top) and
740
PDI (right) values within the sample population. φmax ranged from -103.42 to 107.35, with a
741
meanof 6.57 deg. PDI values ranged from 0.09 to 1.0, with a mean of 0.71, indicating a wide
742
range of relative phase dependencies in different neurons.
743
744
Figure 5. Goodness-of-fit and summation ratios for phase-dependent interactions. A, R2
745
values derived from fitting Equation 6 to each neuron’s responses to the combined LM and
CM patterns, plotted against the corresponding PDI values. Equation 6 best fit responses of
747
neurons that exhibited a high degree of interaction with a well-defined null phase (PDI values
748
~ unity). B, Enhancement and suppression ratios (Equations 8 and 9, respectively), indicating
749
neurons' responses to LM and CM stimuli in isolation compared to responses to their
750
composite at φmax (enhancement ratio, red triangles) and φmax - 180 deg (suppression ratio,
751
blue triangles). An enhancement ratio of two (red dashed line) indicates Rmax of the cell is
752
exactly twice as much to both stimuli together as to each in isolation (linear summation). A
753
suppression ratio of zero (blue dashed line) indicates complete nulling of the neuron’s
754
response at Rmin. Different neurons exhibited a range of enhancement and suppression ratios,
755
not always consistent with simple linear summation. Error bars around each of these ratios
756
represent 68% confidence intervals (~ equivalent to ± 1 standard error) generated by a 757
nonparametric, bias corrected and accelerated (BCa) bootstrapping technique that created
758
10,000 bootstrapped replications of each fitted function, without assuming a Gaussian
759
distribution for the raw data or the residuals (Efron & Tibshirani, 1993).
760
761
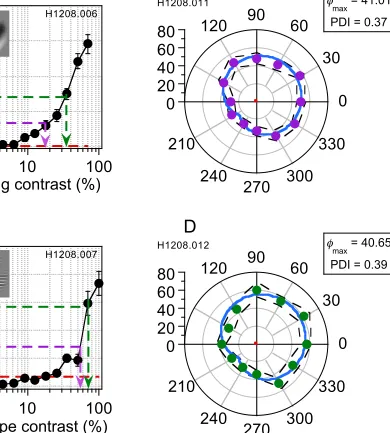
Figure 6. CRFs and phase-dependent interactions at two different response-matched
762
contrasts for a simple-type neuron. A,B, CRFs for a luminance grating (LM) and a contrast
763
envelope (CM), respectively. Error bars denote ± 1 S.E.M. Dashed red lines represent
764
spontaneous activity. Dashed purple and green lines show the stimulus contrasts evoking
765
equivalent responses from the neuron at two different spike frequencies (14 and 28
766
spikes/sec, respectively). C, Phase-dependent interaction plot for component stimuli matched
767
at 14 spikes/sec. D, Same as C, but for response-matching at 28 spikes/sec. In C and D
768
dashed black lines above and below the data points represent ± 1 S.E.M. The red line shows
769
spontaneous activity. Data were well fit by a descriptive function (Equation 6, solid blue
770
line), which produced qualitatively and quantitatively similar results irrespective of the
absolute firing rate chosen to equate the two types of stimuli. Note that the derived φmax and
772
PDI values are almost identical (φmax values were 40.01 deg and 40.65 deg and PDIs were
773
0.37 and 0.39) in each case.
774
775
776
Figure 7. Relationship of LM + CM phase interactions to temporal phase lags of responses
777
in simple-type cells. A, Amount of phase-dependent interaction (PDI) as a function of
778
difference in temporal phase lag, measured for LM and for CM stimuli presented alone, in
779
simple-type cells having modulated discharges. B, Same as A, but optimal phase (φmax) for
780
response to LM + CM compound stimuli, showing an approximately linear relationship.
781
782
Figure 8. Contrast dependent interactions for 5 representative neurons. Data from
simple-783
type (D) and complex-type (A,B,C,E) neurons are shown. A luminance grating (LM) and a
784
contrast envelope (CM) were superimposed at the phase offset that produced the minimal
785
response (A:210 deg, B:180 deg, C:150 deg, D:120 deg, E:180 deg) and their relative
786
amplitudes (contrasts) varied. An example stimulus set is shown in A. Envelope (CM)
787
contrast was fixed (100%), and grating (LM) contrast varied above and below the
response-788
matched value. Red dashed lines show spontaneous activity. Green arrows show
response-789
matched grating contrasts. Error bars represent ± 1 S.E.M. In most cases examined, firing
790
rates increased as the two superimposed stimuli became progressively mismatched.
!"
#"
#"
!"
A
B
C
D
E
Figure 1
G
F
[image:37.720.455.614.49.530.2]Figure 2
Sp
ike
s/
se
c
0
5
10
15
20
0
30
60
90
120
210
240
270
300
330
H1106.008
φ
max
= 16.25
PDI = 0.98
C
0
5
10
15
20
H1106.007
B
Grating contrast (%)
0
5
10
15
20
25
30
1
10
100
H1106.006
Sp
ike
s/
se
c
0
5
10
15
20
0
30
60
90
120
210
240
270
300
330
H0806.007 φ max = 14.02 PDI = 0.610
10
20
30
0
30
60
90
120
210
240
270
300
330
H1103.009 φ max = 325.6 PDI = 0.870
20
40
60
80
0
30
60
90
120
210
240
270
300
330
H1302.012 φ max = 11.38 PDI = 0.90A
B
C
0
10
20
30
0
30
60
90
120
210
240
270
300
330
H2702.011 φ max = 15.74 PDI = 0.090
10
20
30
0
30
60
90
120
210
240
270
300
330
H1202.009 φ max = 307.6PDI = 1.0