Edited by: Thiago Motta Venancio, Universidade Estadual do Norte Fluminense, Brazil
Reviewed by: Tie Koide, Universidade de São Paulo, Brazil Daniel Paul Tonge, Staffordshire University, UK
*Correspondence: Richard D. Emes, School of Veterinary Medicine and Science, University of Nottingham, Sutton Bonington Campus, Loughborough, LE12 5RD, UK [email protected]
Specialty section: This article was submitted to Bioinformatics and Computational Biology, a section of the journal Frontiers in Genetics
Received:01 March 2015 Accepted:23 March 2015 Published:09 April 2015
Citation: Blanchard AM, Leigh JA, Egan SA and Emes RD (2015) Transposon insertion mapping with PIMMS – Pragmatic Insertional Mutation Mapping System. Front. Genet. 6:139. doi:10.3389/fgene.2015.00139
Transposon insertion mapping with
PIMMS – Pragmatic Insertional
Mutation Mapping System
Adam M. Blanchard1,James A. Leigh1,Sharon A. Egan1andRichard D. Emes1,2*
1School of Veterinary Medicine and Science, University of Nottingham, Loughborough, UK,2Advanced Data Analysis
Centre, University of Nottingham, Loughborough, UK
The PIMMS (Pragmatic Insertional Mutation Mapping System) pipeline has been developed for simple conditionally essential genome discovery experiments in bacteria. Capable of using raw sequence data files alongside a FASTA sequence of the reference genome and GFF file, PIMMS will generate a tabulated output of each coding sequence with corresponding mapped insertions accompanied with normalized results enabling streamlined analysis. This allows for a quick assay of the genome to identify conditionally essential genes on a standard desktop computer prioritizing results for further investigation.
Availability: The PIMMS script, manual and accompanying test data is freely available at
https://github.com/ADAC-UoN/PIMMS
Keywords: TnSeq, INseq, TraDIS, transposon mapping, sequencing
Introduction
Blanchard et al. Transposon insertion mapping with PIMMS
The PIMMS Pipeline
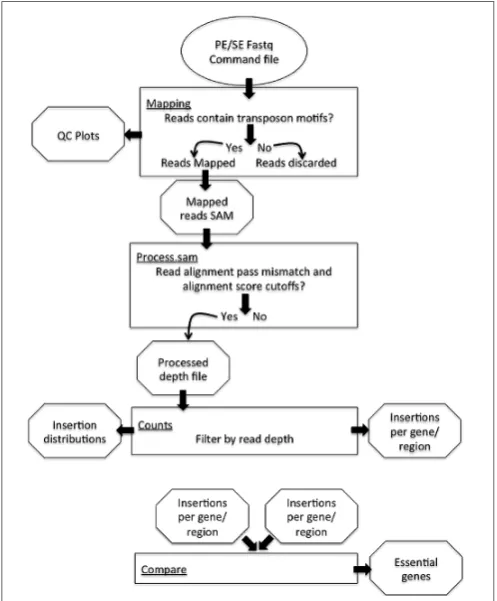
The PIMMS pipeline comprises four modules; mapping, pro-cess.sam, counts, and compare (Figure 1). Examples shown are from data-sets resulting from experiments conducted as part of a PIMMS development project. Consequently, the results and bio-logical interpretation of these are not discussed here but will be presented elsewhere (Blanchard et al., in preparation). For full description of parameter options and a description of output types and directory structure please see the PIMMS handbook available athttps://github.com/ADAC-UoN/PIMMS.
FIGURE 1 | Schematic of the Pragmatic Insertional Mutation Mapping System (PIMMS) pipeline.
PIMMS Mapping
[image:2.595.44.293.206.507.2]A simple and universal approach for sample enrichment for Tn-mapping is through inverse PCR from the inserted element or transposon into flanking genomic DNA. The initial problem to overcome when dealing with these data is that the resulting sequence reads will consist of components from both transposon and chromosome, meaning that the raw sequence will not map faithfully to the target genome. Therefore, the first step is to sep-arate these and create a file containing only the part of the read that follows from the end of the transposon fragment. Control of PIMMS mapping is primarily by the PIMMS.commands.txt file which must contain motifs (corresponding to the Tn termini) to be matched in the sequence reads and can additionally con-tain aligner commands (an example command.txt file is provided when downloaded from GitHub). The decision to have this com-mands file rather than ask for this information on the command line was to avoid potential typographical errors when entering the sequence motif on the command line. Sequence data entered into the PIMMS pipeline does not require any pre-processing, but rather uses raw fastq files. Reads that contain either of the motifs (including those on the reverse strand as reverse comple-ment motifs are automatically generated) are identified and the sequence immediately following the motif and its correspond-ing quality score are extracted to a new fastq file (Figure 2). The user can specify a minimum and maximum length of potential genome sequence. As a default we retain sequences of minimum 20, maximum 50 bp. Keeping the maximum length relatively short avoids problems of re-entering the transposon where the PCR product was generated from a small circular template. To avoid double counting of insertion positions where both ends of a single insertion are sequenced, a single read is discarded if reads are from a paired end sequence experiment and extracted reads remain as paired after processing. If single end reads are used as input then this step is not considered. As a result, a com-bined single end read fastq file is aligned to the reference genome using the parameters provided in the PIMMS.command.txt file. The current version (version 1.9), allows automatic use of bowtie2 (Langmead and Salzberg, 2012) or BWA (Li and Durbin, 2009). Other aligners could also be used if given as a command in the PIMMS.command.txt. Any non-standard aligner will be queried by PIMMS prior to running. By default, BWA with options “mem –t 2” is used. BWA is recommended as this produced
FIGURE 2 | Process of read motif matching and trimming. (A)Reads in fastq format are scanned for motifs which are designated by the user to correspond to the end of the transposon element used in mutant library
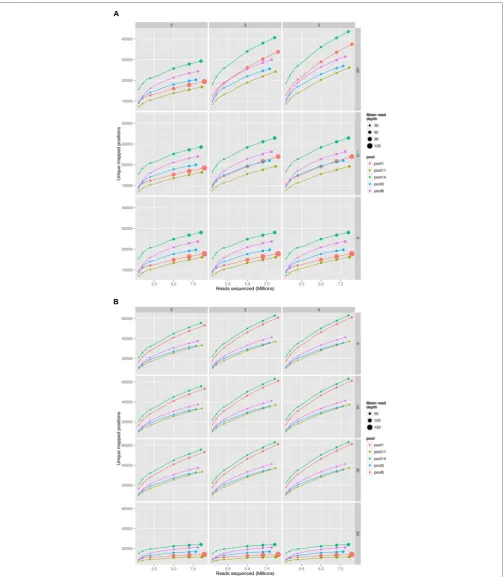
FIGURE 3 | Comparison of read aligners, cumulative number of unique positions mapped from five pools of mutant Streptococcus uberis sampled at increasing sequence depth. (A)Bowtie2 (version 2.2.1) with parameters –end-to-end –very-sensitive. (B)BWA mem (version 0.7.10) with default parameters. Columns of the plot show changes with mismatches (0, 3, or 5 mismatches per read), and rows changes in
Blanchard et al. Transposon insertion mapping with PIMMS
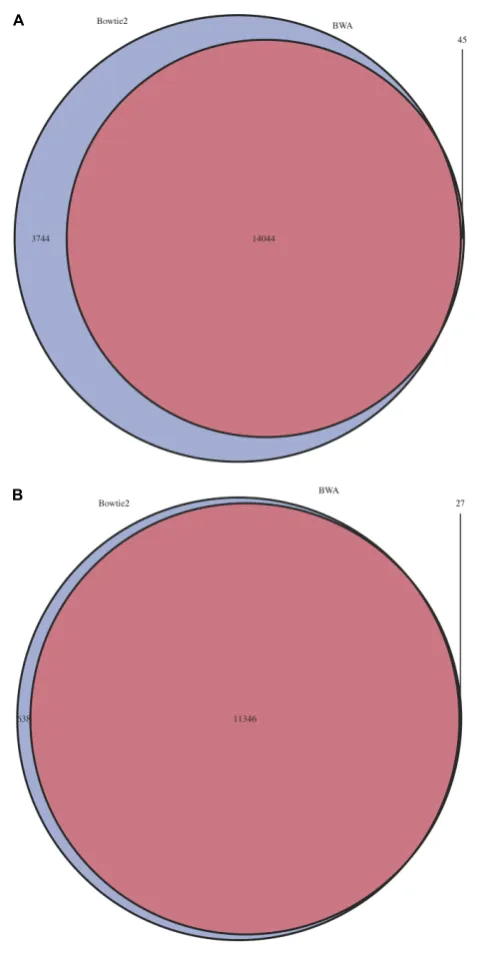
FIGURE 4 | Overlap of predicted insertion positions between BWA and Bowtie2.For a single pool with an estimated number of possible mutations of 16,000 mutants estimated by colony counts, positions of predicted mutations were compared. Blue=Bowtie2, Purple=BWA.(A)All mutation positions.
(B)Mutation positions with a minimum depth of>1.
the most robust results in our test datasets. (See PIMMS pro-cess.sam for discussion). The resulting output is a mapped reads file in SAM format1 and plots of percent nucleotide
distribu-tion at each read posidistribu-tion and read quality quartile plots of raw and processed reads (those that match a motif and post trimming).
1http://samtools.github.io/hts-specs/
PIMMS process.sam
Whilst we generally use the PIMMS process.sam module to process reads directly following PIMMS mapping, the PIMMS pipeline can be initiated at this step following any read map-ping that produces a standard SAM formatted output. Each read in the SAM file is assessed for number of mismatches between read and reference sequence (using the “MD” tag of the SAM file) and alignment score (using the “AS” tag of the SAM file). Reads with mismatches greater than that chosen by the user or alignment scores less than requested are ignored. For those that exceed user’s criteria the position of the initial base of the align-ment (that immediately adjacent to the insertional elealign-ment) is recorded. At this processing step, insertion positions can also be collapsed if they are exactly a given distance apart. This is impor-tant as the transposon system pGhost9::ISS1 used to develop this protocol incorporates an exact 8 bp repeat during inser-tion. The process.sam generates a simple text file of insertion coordinates and read depth at each unique insertion position in addition a log file of all parameter choices and run statistics is generated.
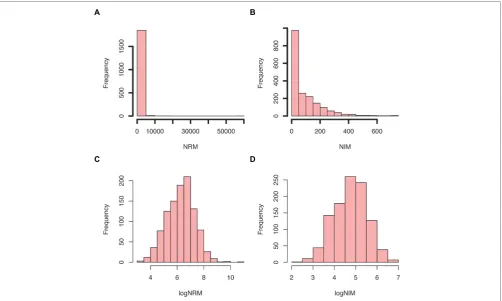
FIGURE 5 | Example summary plots of normalized insertions mapped (NIM) and normalized reads mapped (NRM) scores generated by PIMMS counts. (A)Histogram of NRM=(total number of reads/length of gene in Kb) /total mapped read count/106. This provides a number of reads mapped that is
comparable between genes and experiments.(B)Histogram of NIM=(total unique insertions mapped/length of gene in Kb) /total insertions mapped/106.
This provides a number of insertions per gene that is comparable between genes and experiments. The distribution of NRM and NIM is skewed and highlights that many genes have a low NRM and NIM. The log transformation of these(C,D)provides an approximate normal distribution that allows comparison of NRM and NIM between experiments. The ratio and difference of these is compared in PIMMS compare module.
In addition when the unique insertion positions were compared between aligners, BWA positions were almost entirely contained within predictions of Bowtie2 (Figure 4). The removal of posi-tions with a single sequence read at a position dramatically reduces the Bowtie2 unique positions. Suggesting that the major-ity of disagreement was due to insertions with low read depth in Bowtie2. Whilst data for a single pool of mutants is shown, the same trend is seen across all experiments we have con-ducted. We therefore have engineered PIMMS to default to BWA aligner and we recommend use of filters alignment score=50 and mismatch = 0, (PIMMS –m process.sam –a 50 –mis 0). We also recommend filtering of positions where only a single read is mapped. This is achieved with the coverage (-cov) option of PIMMS counts module (see PIMMS counts PIMMS Counts below).
PIMMS Counts
The PIMMS counts script requires a GFF file to match annota-tion to the inserannota-tion posiannota-tions depth file generated by PIMMS process.sam. This is then used to generate tabulated output files (named×summary.table) of unique insertions, read depths at a position, normalized insertions per kb, the percentile posi-tion of the first and last insert within the coding sequence and
normalized read values (NRM and NIM). NRM – Normalized Reads Mapped (total number of reads/length of gene in Kb)/(total mapped read count/106) and NIM – Normalized Insertions
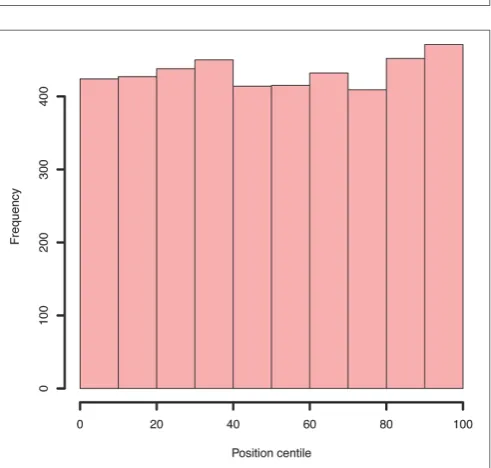
Mapped (total unique insertions mapped/Length of gene in Kb)/(total insertions mapped/106) provide an indication of the disruption of a given gene in comparison to others within the population and also takes into account the variability of the number of mapped sequence reads for each experiment. Summary figures of the distribution of NIM and NRM are gen-erated (Figure 5) and plots of per position NIM together with a smoothed average plus expected insertion ratio allowing a sim-ple visualization of “hot” or “cold” spots of insertions within the genome (Figure 6). In addition the distribution of the centile positions of insertions are generated (Figure 7). From our expe-rience at a global level, there is little bias toward insertion in the start or end of protein coding genes withinStreptococcus uberis.
Underlying data for the generation of the plots are retained as text files so that additional plotting or investigation can be conducted by the user. To create a usable GFF2 file from an available EMBL file we recommend using seqret2.
Blanchard et al. Transposon insertion mapping with PIMMS
[image:6.595.46.292.372.606.2]FIGURE 6 | Example NIindex plots for single mutant pool.Circles represent the NIindex (observed count per position – expected count per position), where expected count per position determined as total mapped reads/unique mapped positions. If observed=expected NIindex would=0. Green line is the smoothed summary of points. Red dotted line is the expected count per position.
FIGURE 7 | Example histogram of centile positions of all insertions within all genes.Whilst a very slight increase is seen toward the end of genes, this is clearly not a significant bias.
PIMMS Compare
The compare module allows processing of data obtained from phenotypic studies. Following use of the counts module, PIMMS compare, compares two pools termed “input” and “output” to
FIGURE 8 | Overlap between identified essential genes detected by TraDIS (seeLangridge et al., 2009for data) and PIMMS.Genes were classified as essential if log2-LR<−2 (TraDIS) or NIM<2 (PIMMS).
identify common and unique mutation events between exper-imental conditions. Three output tables are produced (input only, output only, and shared positions). Tables consist of insertion position normalized observed and expected num-ber of reads and associated gene information. For the shared positions an indication of the magnitude of deviation from an expected norm is determined. Within an experiment the natural logarithm (base e) transformed proportion ratio (the share of reads mapped at a location) approximates a nor-mal distribution. Using the mean (shared mean) and stan-dard deviation (shared sd) of this population, for each inser-tion the input/output proporinser-tion ratio (Proporinser-tion ratio) the Zscore is calculated as: Zscore = [(log(Proportion ratio)) – (shared mean)]/(shared sd). To provide an approximation of statistical importance, Zscores > SD equivalent to a p-value of 0.001, 0.01, 0.05 are flagged as |Zscore| > = 3.291, Flag = “∗∗∗” (∼ p-value = 0.001), if 3.291 > |Zscore|
>=2.579, Flag=“∗∗” (∼p-value=0.01), if 2.579>|Zscore|
>=1.960, Flag=“∗” (∼p-value=0.05) and if | Zscore|<1.960, Flag=“”.
Analysis of Existing Data using PIMMS
To compare the performance and utility of PIMMS, sequence reads generated as part of the study of essential genes in
Salmonella typhi(Langridge et al., 2009) were analyzed. The data set ERR004088 available from the sequence read archive3
com-prises 14,201,779 single end reads. Using the TraDIS method Langridge et al. (2009) reported mapping of 370,000 inser-tions at a mean inter-insertion distance of 13 bp (Langridge
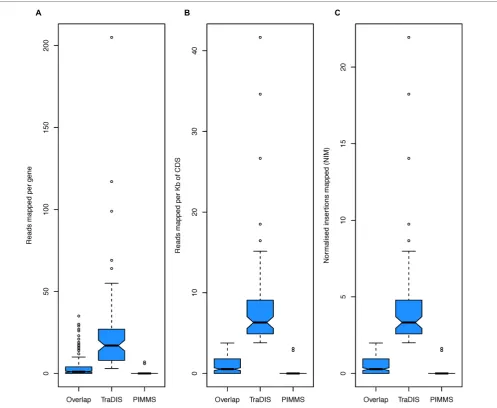
FIGURE 9 | Boxplots of (A) total reads mapped to gene, (B) total reads mapped normalized by read length of gene, and (C) NIM.In each plot the group “Overlap” corresponds to genes identified as essential by TraDIS and PIMMS (271 genes), “TraDIS” corresponds to genes identified by TraDIS only (83 genes) and “PIMMS” corresponds to genes identified by PIMMS only (20 genes).
et al., 2009). Using PIMMS with the default mapper (BWA – mem) and fragment retention sizes of –minimum 20 –maximum 50. Resulted in 8,580,710 reads matching the transposon motif TAAGAGACAG. Following filtering for alignment quality (0 mismatches and alignment score of>20 [PIMMS -m process.sam -c N -mis 0 -a 20]) 1,898,673 reads confidently mapped in a total of 321,514 unique insertion positions with mean inter-insertion distance of 14.9 bp comparable to the original TraDIS experi-ment. Using theLangridge et al.(2009) definition of essentiality (log2-LR<−2) or PIMMS NIM<2, showed largely consistent
results between PIMMS and TraDIS (Figure 8). The 83 genes identified as essential by TraDIS only may possibly represent mis-alignment during the PIMMS procedure, as the sequence length from Langridge et al. (2009)is short (50 bp single end) com-pared to the standard 2 × 250 bp paired end sequencing of the PIMMS approach. To overcome this the PIMMS alignment
Blanchard et al. Transposon insertion mapping with PIMMS
by both TraDIS and PIMMS. This suggests that genes iden-tified by PIMMS are worthy of inclusion as possible essential genes.
Conclusion
Currently the major software available for analysis of transpo-son mediated mutagenesis data and identification of essential genes is ESSENTIALS (Zomer et al., 2012). However, use of this web-based tool may be limited if data cannot be transferred and stored on-line. Whilst a standalone version of ESSENTIALS can be obtained from the developer, this version requires mod-ifications which may be beyond the abilities of a novice user. ESSENTIALS uses FASTX toolkit4to identify and trim
transpo-son sequence and PASS (Campagna et al., 2009) to align trimmed sequences. Essential genes are then identified by comparison of mapped counts using EdgeR (Robinson et al., 2010). The power of EdgeR when multiple replicates are available is well established, however, where reduced replicates are available or where greater user control of choice of aligner and parameters of aligner and
4http://hannonlab.cshl.edu/fastx_toolkit/
mapping stringency are required PIMMS provides a compelling alternative.
In comparison to TraDIS, PIMMS is a truly pragmatic choice. Whilst the results are largely comparable, TraDIS requires com-plex preparation of sequence data including PCR library prepa-ration with custom Illumina primers. PIMMS relies on gen-eration of libraries using standard protocols following inverse PCR or even restriction fragment digestion (Blanchard et al., unpublished). In addition the PIMMS processing pipeline is quick, taking less than 10 min on a desktop computer (i7-3820 CPU @ 3.60 GHz, running Ubuntu 14.04) to complete all step of transposon matching, mapping and results processing. Therefore, PIMMS analysis pipeline provides a convenient, robust, and importantly reproducible toolkit to explore and prioritize output from vast amounts of sequencing data required to map transpo-son generated insertions within a population, without the need for complex data manipulation by multiple tools.
Acknowledgment
This project was funded by the University of Nottingham in collaboration with Zoetis.
References
Campagna, D., Albiero, A., Bilardi, A., Caniato, E., Forcato, C., Manavski, S., et al. (2009). PASS: a program to align short sequences.Bioinformatics25, 967–968. doi: 10.1093/bioinformatics/btp087
Gawronski, J. D., Wong, S. M. S., Giannoukos, G., Ward, D. V., and Akerley, B. J. (2009). Tracking insertion mutants within libraries by deep sequencing and a genome-wide screen forHaemophilusgenes required in the lung.Proc. Natl. Acad. Sci. U.S.A.106, 16422–16427. doi: 10.1073/pnas.0906627106
Goodman, A. L., McNulty, N. P., Zhao, Y., Leip, D., Mitra, R. D., Lozupone, C. A., et al. (2009). Identifying genetic determinants needed to establish a human gut symbiont in its habitat. Cell Host Microbe 6, 279–289. doi: 10.1016/j.chom.2009.08.003
Langmead, B., and Salzberg, S. (2012). Fast gapped-read alignment with bowtie 2.
Nat. Methods9, 357–359. doi: 10.1038/nmeth.1923
Langridge, G. C., Phan, M. D., Turner, D. J., Perkins, T. T., Parts, L., Haase, J., et al. (2009). Simultaneous assay of everySalmonella typhigene using one million transposon mutants.Genome Res. 19, 2308–2316. doi: 10.1101/gr.097097.109 Li, H., and Durbin, R. (2009). Fast and accurate short read alignment with
Burrows-Wheeler transform.Bioinformatics25, 1754–1760. doi: 10.1093/bioin-formatics/btp324
Robinson, M. D., McCarthy, D. J., and Smyth, G. K. (2010). edgeR: a bioconduc-tor package for differential expression analysis of digital gene expression data.
Bioinformatics26, 139–140. doi: 10.1093/bioinformatics/btp616
Tormo, A., Almiron, M., and Kolter, R. (1990). surA, anEscherichia coligene essential for survival in stationary phase.J. Bacteriol.172, 4339–4347. van Opijnen, T., Bodi, K. L., and Camilliet, A. (2009). Tn-seq: high-throughput
par-allel sequencing for fitness and genetic interaction studies in microorganiams.
Nat. Methods6, 767–772. doi: 10.1038/nmeth.1377
Ward, P. N., Holden, M. T., Leigh, J. A., Lennard, N., Bignell, A., Barron, A., et al. (2009). Evidence for niche adaptation in the genome of the bovine pathogen
Streptococcus uberis.BMC Genomics10:54. doi: 10.1186/1471-2164-10-54 Zomer, A., Burghout, P., Bootsma, H. J., Hermans, P. W., and van Hijum,
S. A. (2012). ESSENTIALS: software for rapid analysis of high throughput transposon insertion sequencing data.PLoS ONE7:e43012. doi: 10.1371/jour-nal.pone.0043012
Conflict of Interest Statement:Richard D. Emes is Speciality Chief Editor of
Frontiers in Bioinformatics and Computational Biology. The other authors declare that the research was conducted in the absence of any commercial or financial relationships that could be construed as a potential conflict of interest.