R E S E A R C H A R T I C L E
Open Access
Lung function associated gene Integrator
Complex subunit 12 regulates protein
synthesis pathways
Alexander K. Kheirallah
1,2*, Cornelia H. de Moor
3, Alen Faiz
4, Ian Sayers
2and Ian P. Hall
2Abstract
Background:Genetic studies of human lung function and Chronic Obstructive Pulmonary Disease have identified a highly significant and reproducible signal on 4q24. It remains unclear which of the two candidate genes within this locus may regulate lung function:GSTCD, a gene with unknown function, and/orINTS12, a member of the Integrator Complex which is currently thought to mediate 3’end processing of small nuclear RNAs.
Results:We found that, in lung tissue, 4q24 polymorphisms associated with lung function correlate withINTS12but not neighbouringGSTCDexpression. In contrast to the previous reports in other species, we only observed a minor alteration of snRNA processing following INTS12 depletion. RNAseq analysis of knockdown cells instead revealed dysregulation of a core subset of genes relevant to airway biology and a robust downregulation of protein synthesis pathways. Consistent with this, protein translation was decreased in INTS12 knockdown cells. In addition, ChIPseq experiments demonstrated INTS12 binding throughout the genome, which was enriched in transcriptionally active regions. Finally, we defined the INTS12 regulome which includes genes belonging to the protein synthesis pathways. Conclusion:INTS12 has functions beyond the canonical snRNA processing. We show that it regulates translation by regulating the expression of genes belonging to protein synthesis pathways. This study provides a detailed analysis of INTS12 activities on a genome-wide scale and contributes to the biology behind the genetic association for lung function at 4q24.
Keywords:Integrator Complex, INTS12, snRNA processing, Protein synthesis, Regulation of gene expression, Pathway dysregulation, Histone modification, Accessible chromatin, Transcription
Background
According to the World Health Organization, respira-tory diseases such as Chronic Obstructive Pulmonary Disease (COPD) are one of the leading causes of popula-tion morbidity and mortality [1]. COPD is characterized by irreversible airway obstruction, and one or both of emphysema and chronic bronchitis. Clinically, COPD is defined by lung function parameters, the forced vital capacity and the forced expiratory volume in the first second [2]. Since the beginning of genome-wide association studies (GWAS), efforts were undertaken to
further our understanding of the pathobiology of this disease. Several studies have identified highly significant associations between single nucleotide polymorphisms (SNPs) on chromosome 4q24 and lung function as well as risk of COPD [3–6]. However, the mechanistic basis of this signal has not been elucidated. To understand the functional basis for this region, we have previously used expression quantitative trait locus (eQTL) analyses in multiple non-lung tissues and found the strongest evi-dence supported the hypothesis that the variable expres-sion of Integrator Complex subunit 12 gene (INTS12) underlies this association [7].
INTS12 protein is a member of Integrator Complex (INTScom) currently believed to be composed of approximately 14 subunits [8]. This complex was shown to stably accompany the C-terminal tail of RNA poly-merase II (POLII) and at a molecular level has been
* Correspondence:[email protected]
1
Wellcome Trust - Medical Research Council Cambridge Stem Cell Institute, University of Cambridge, Cambridge, UK
2Division of Respiratory Medicine, School of Medicine, University of
Nottingham, Nottingham NG7 2UH, UK
Full list of author information is available at the end of the article
implicated in small nuclear RNA (snRNA) biogenesis [9–12] dynein recruitment to the nuclear envelope at the mitotic onset [13] and with POLII pause and release [14]. At the physiological level, targeted knockdown and mutagenesis experiments demonstrated INTScom to be necessary for mouse adipogenesis [15], zebrafish haemo-poiesis [16] as well as human primary ciliogenesis [17]. The relative contributions of individual subunits in the above processes vary.
Direct insights into the function of INTS12 come from
Drosophila where it is necessary for the spliceosome’s
snRNA processing and this function is considered to be canonical [10–12]. Drosophila’s INTS12 was also impli-cated in the activation of a key heat shock response gene
HSP70Aa [14]. In HeLa cells, INTS12 was specifically
shown to be required for the maintenance of perinuclear dynein [13] and formation of primary cilia [17]. Although ciliogenesis is a dynein-dependent event [18, 19] it is thought that INTS12 is regulating these two processes separately from each other via the snRNA processing pathway [17]. INTS12 is also likely to play important roles in embryonic development. This has been supported by
studies which showed that homozygousINTS12knockout
in M. musculus results in pre-weaning lethality [7]. The
lethal effect ofINTS12knockout most probably occursin
utero as breeding heterozygous models only yields
wild-type homozygotes or mutant heterozygotes but never produces homozygous litters with no functional copy of the gene (data not shown). InDrosophila, the evolutionary
conserved INTS12’s plant homeodomain (PHD) is
dispensable for the canonical snRNA processing [12] suggesting the probable existence of other functions for this protein. Thus although numerous INTS12 dependent cellular functions have been reported, no studies have addressed by which molecular mechanisms these func-tions are implemented.
Here we investigate the regulatory properties of INTS12 in primary human bronchial epithelial cells (HBECs) to help understand the biological mechanism behind the association signal for lung function at 4q24 locus. As no genome-wide molecular assessment of INTS12 perturbation has been performed to date, we use a hypothesis-free approach [20] by combining gene knockdown with RNA sequencing in order to generate new functional hypotheses. We bioinformatically show that INTS12 has homology to epigenetic regulators of gene expression. As this molecule was shown to interact with genomic DNA in flies [14], we performed chromatin immunoprecipitation followed by sequencing (ChIPseq) and combined it with RNAseq data. Our data show that INTS12 acts as a regulator of pathways fundamental for protein synthesis, including the tRNA synthetases, PERK and unfolded protein response pathways. We provide in-sights into the characteristics of INTS12 binding as well
as its relationship to transcription and propose a model for INTScom activity that may explain the plethora of phenotypes observed upon depletion of various members of the complex. Finally, we suggest that variation in
INTS12 expression conferred by specific eQTL alleles,
dictates the levels of protein synthesis and thus may in part be contributing to the genetic association for lung function.
Results
Lung function SNPs are eQTLs forINTS12expression in
the lung tissue
The association signal for lung function within 4q24 contains a peak situated over two oppositely transcribed genes in close proximity to each other, the Glutathione S-transferase, C-terminal Domain Containing (GSTCD)
and INTS12. Based on eQTL analyses in non-lung
tis-sues, it has been suggested thatINTS12 is a more likely
contributor to the pulmonary function than GSTCD
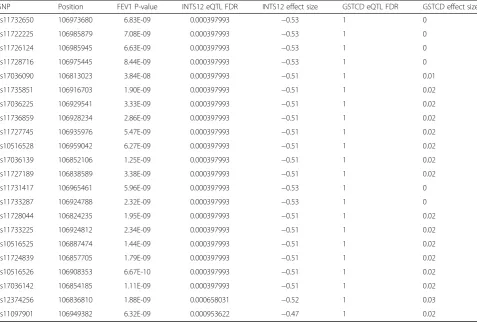
(Obeidat et al. 2013). To confirm this observation, we have taken advantage of a RNAseq-based human lung eQTL dataset from the Genotype-Tissue Expression pro-ject [21]. There were 248 SNPs at or near 4q24 that were significant cis-eQTLs for INTS12 expression (n= 278, false discovery rate (FDR) < 0.05). Among these, 30 SNPs showed significant association for lung function in the SpiroMeta consortium study [3]. In contrast, none of these variants showed significant association with
GSTCDexpression (Table 1). This finding indicates that
within 4q24 it is the altered expression of INTS12, and
notGSTCD, that is influencing lung function.
Human INTS12 knockdown has modest effects on snRNA processing in HBECs
Given previous observations in Drosophila implying a
role for INTS12 in processing of U1, U2, U4 and U5
snRNAs [10–12], we first set out to determine if these observations translate to a human model. Because
INTS12expression is higher in the human bronchial
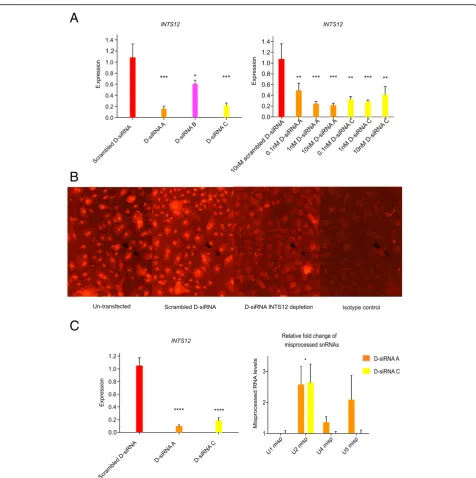
epi-thelium than other airway structural cells [7] we concen-trated our studies on primary HBECs grown to passage three. Quantitative PCR (qPCR) assays measuring mis-processed U1, U2, U4 and U5 snRNAs were developed. We then validated transfection conditions and demon-strated knockdown, both at the mRNA (Fig. 1a) and protein levels (Fig. 1b, Additional file 1: Figure S1), with two different Dicer substrate siRNAs (D-siRNAs) [22] targeting INTS12.
2.58 ± 0.58 and by 2.64 ± 0.59 for D-siRNAs A and C re-spectively (P< 0.05; Fig. 1c). However, in keeping with the lack of impact on U1 processing, we found no significant effects of INTS12 knockdown on processing of U4 and U5 snRNAs. These data suggest that whilst INTS12 may play a role in U2 processing, it does not significantly affect processing of U1, U4, and U5 snRNAs in HBECs. Due to ubiquitous expression of snRNA genes [9–11], we cannot exclude the possibility that effects on other snRNA species were not observed due to the requirement for a more ro-bust INTS12 protein knockdown than was achieved. However, a survey of published studies that investigated the importance of INTS12, indicates a potentially weaker role for this molecule in delivering snRNA processing relative to other INTScom members (Additional file 2: Table S6).
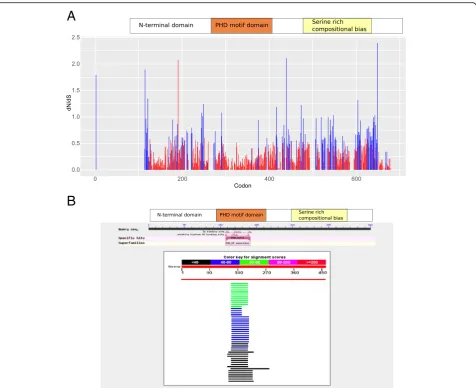
Sequence analysis of open reading frames (ORF) from 66 metazoan species revealed high levels of INTS12 con-servation, particularly its PHD (Fig. 2a). The observed effects on snRNA processing together with the detected conservation prompted us to hypothesize the existence
of additional functions for INTS12. Moreover, the evolutionary constrained PHD finger is dispensable for snRNA processing in Drosophila [12]. In order to gain insight into the potential INTS12 functions, a search of similar human proteins was performed using the
BLASTP algorithm [23] (Fig. 2b). INTS12’s PHD
ap-peared to be homologous to a large family of fingers whose functions lie in the control of chromatin and nu-cleosomes [24] where they act as epigenetic regulators of gene expression (Additional file 2: Table S1 and S2). Therefore, we next aimed to study the genome-wide regulatory properties of INTS12 by using a combination of gene knockdown with transcriptome profiling and patterns of binding to the genomic DNA.
[image:3.595.59.537.99.421.2]Differential transcriptome analysis reveals regulation of a core regulome subset of relevance to airway biology In order to identify a core subset of genes that are sig-nificantly regulated by INTS12 we compared the acute versus longer term transcriptomic responses due to de-pletion. RNAseq profiling was performed 48 h and 120 h Table 1INTS12cis-eQTLs at 4q24 locus
SNP Position FEV1 P-value INTS12 eQTL FDR INTS12 effect size GSTCD eQTL FDR GSTCD effect size
rs11732650 106973680 6.83E-09 0.000397993 −0.53 1 0
rs11722225 106985879 7.08E-09 0.000397993 −0.53 1 0
rs11726124 106985945 6.63E-09 0.000397993 −0.53 1 0
rs11728716 106975445 8.44E-09 0.000397993 −0.53 1 0
rs17036090 106813023 3.84E-08 0.000397993 −0.51 1 0.01
rs11735851 106916703 1.90E-09 0.000397993 −0.51 1 0.02
rs17036225 106929541 3.33E-09 0.000397993 −0.51 1 0.02
rs11736859 106928234 2.86E-09 0.000397993 −0.51 1 0.02
rs11727745 106935976 5.47E-09 0.000397993 −0.51 1 0.02
rs10516528 106959042 6.27E-09 0.000397993 −0.51 1 0.02
rs17036139 106852106 1.25E-09 0.000397993 −0.51 1 0.02
rs11727189 106838589 3.38E-09 0.000397993 −0.51 1 0.02
rs11731417 106965461 5.96E-09 0.000397993 −0.53 1 0
rs11733287 106924788 2.32E-09 0.000397993 −0.53 1 0
rs11728044 106824235 1.95E-09 0.000397993 −0.51 1 0.02
rs11733225 106924812 2.34E-09 0.000397993 −0.51 1 0.02
rs10516525 106887474 1.44E-09 0.000397993 −0.51 1 0.02
rs11724839 106857705 1.79E-09 0.000397993 −0.51 1 0.02
rs10516526 106908353 6.67E-10 0.000397993 −0.51 1 0.02
rs17036142 106854185 1.11E-09 0.000397993 −0.51 1 0.02
rs12374256 106836810 1.88E-09 0.000658031 −0.52 1 0.03
rs11097901 106949382 6.32E-09 0.000953622 −0.47 1 0.02
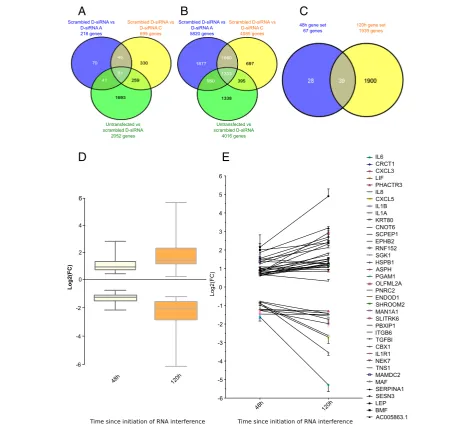
after RNA interference (RNAi). After 48 h the levels of knockdown were 74 ± 1% and 78 ± 2%, whilst after 120 h, 89 ± 1% and 80 ± 2% for D-siRNAs A and C re-spectively (FDR < 0.05). After accounting for off-target and transfection effects there were 67 and 1939 differen-tially expressed genes by INTS12 knockdown at 48 h
and 120 h time points respectively (FDR < 0.05; Fig. 3a and b). Thus, sustained knockdown resulted in a differ-ential expression of ~30 times more genes than what was observed in acute response to knockdown (Fig. 3c). For those genes showing altered levels at both time points, called core regulome subset, the magnitude of
A
B
C
Fig. 1Optimizing INTS12 knockdown and elucidating its effect on snRNA processing in HBECs.aOptimizing anti-INTS12 D-siRNA transfections.
INTS12mRNA expression in HBECs transfected with three distinct D-siRNAs at 10nM (left) and with the indicated concentrations of D-siRNA A and C (right). D-siRNAs A and C at a concentration of 1nM were chosen for subsequent experiments. Statistical tests were performed comparing to scrambled D-siRNA control: *P< 0.05, **P< 0.01, ***P< 0.001. IndividualΔΔCt gene expressions areGAPDHnormalized and relative to the mean of scrambled D-siRNA condition.bRepresentative images of INTS12 protein expression in anti-INTS12 D-siRNA transfected HBECs by immunofluorescence.
[image:4.595.60.537.84.563.2]change was greater at 120 h post initiation of RNAi (Fig. 3d) for all except one (Fig. 3e). Crucially the direc-tion of differential expression for this set of genes is the same in the independent D-siRNAs treatments and at both time points (Fig. 3e, Table 2).
Genes showing altered expression include a number of genes known to play important roles in lung disease such as α1-antitrypsin (SERPINA1) [25], transforming growth factorβ1 (TGFβI) [26], interleukin 1 receptor 1
(IL1R1) [27] and IL6, IL8, IL1B, IL1A [28–31]. We have
calculated the P-value of observing such an association of“lung biology genes”with the list of core regulome as-suming the null hypothesis of their independence given the background of protein coding genes. Surprisingly in
the light of global effects of INTS12 depletion (Fig. 3b), this analysis allowed us to reject the null hypothesis in favour of the alternative (P< 0.0001). IL6had the great-est reduction in expression. The gene with the greatgreat-est fold induction was Leptin (LEP) which was shown to be upregulated and secreted from HBECs infected with respiratory syncytial virus [32] (Table 2). Interestingly, several polymorphisms in linkage with LEP are associ-ated with lung function [33]. LEP blood concentration was also shown to negatively correlate with lung func-tion [34]. Crucially, we have biologically validated LEP upregulation in an additional donor HBECs depleted of INTS12 (Additional file 1: Figure S2). These findings suggest that altered expression of INTS12in population
A
B
Fig. 2Sequence analysis of INTS12’s PHD and its sequence similarity to epigenetic regulators of gene expression.aQuantitative assessment of
[image:5.595.61.538.86.474.2]studies may at least in part contribute to lung biology as well as, more broadly, potentially towards other phenotypes.
In relation to the above findings it is of interest whether INTS12 can work independently from the rest of the INTScom complex or if it mediates tissue-specific functions via this complex. To begin to address this
question we have performed a correlation analysis of known INTScom members using our entire 48 h and 120 h expression RNA-seq datasets. It appeared that average Pearson’s correlation coefficients are −0.13 and 0.22 at 48 h and 120 h respectively for INTS12 mRNA expression in relation to the other INTS proteins (Additional file 1: Figure S12). Therefore, in HBECs,
A
D
E
B
C
Fig. 3Differential transcriptome analysis reveals regulation of a core subset of genes relevant to airway biology. Statistical tests were performed
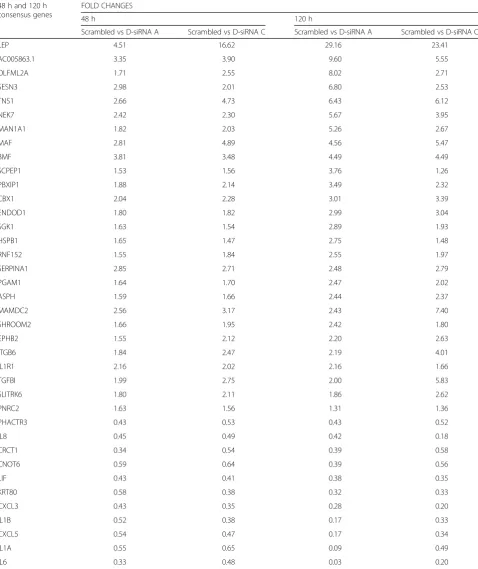
[image:6.595.60.536.90.516.2]Table 2Deregulation of a core regulome genes due to INTS12 knockdown
48 h and 120 h consensus genes
FOLD CHANGES
48 h 120 h
Scrambled vs D-siRNA A Scrambled vs D-siRNA C Scrambled vs D-siRNA A Scrambled vs D-siRNA C
LEP 4.51 16.62 29.16 23.41
AC005863.1 3.35 3.90 9.60 5.55
OLFML2A 1.71 2.55 8.02 2.71
SESN3 2.98 2.01 6.80 2.53
TNS1 2.66 4.73 6.43 6.12
NEK7 2.42 2.30 5.67 3.95
MAN1A1 1.82 2.03 5.26 2.67
MAF 2.81 4.89 4.56 5.47
BMF 3.81 3.48 4.49 4.49
SCPEP1 1.53 1.56 3.76 1.26
PBXIP1 1.88 2.14 3.49 2.32
CBX1 2.04 2.28 3.01 3.39
ENDOD1 1.80 1.82 2.99 3.04
SGK1 1.63 1.54 2.89 1.93
HSPB1 1.65 1.47 2.75 1.48
RNF152 1.55 1.84 2.55 1.97
SERPINA1 2.85 2.71 2.48 2.79
PGAM1 1.64 1.70 2.47 2.02
ASPH 1.59 1.66 2.44 2.37
MAMDC2 2.56 3.17 2.43 7.40
SHROOM2 1.66 1.95 2.42 1.80
EPHB2 1.55 2.12 2.20 2.63
ITGB6 1.84 2.47 2.19 4.01
IL1R1 2.16 2.02 2.16 1.66
TGFBI 1.99 2.75 2.00 5.83
SLITRK6 1.80 2.11 1.86 2.62
PNRC2 1.63 1.56 1.31 1.36
PHACTR3 0.43 0.53 0.43 0.52
IL8 0.45 0.49 0.42 0.18
CRCT1 0.34 0.54 0.39 0.58
CNOT6 0.59 0.64 0.39 0.56
LIF 0.43 0.41 0.38 0.35
KRT80 0.58 0.38 0.32 0.33
CXCL3 0.43 0.35 0.28 0.20
IL1B 0.52 0.38 0.17 0.33
CXCL5 0.54 0.47 0.17 0.34
IL1A 0.55 0.65 0.09 0.49
IL6 0.33 0.48 0.03 0.20
INTS12 seems to be expressed independently from the rest of INTScom members and potentially operating independently.
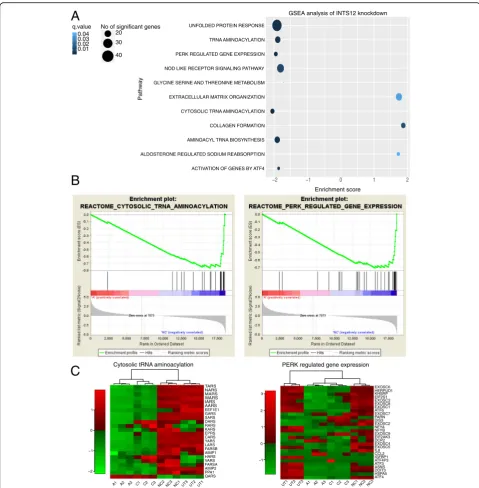
Differential pathway analysis identifies dysregulation of protein synthesis and collagen formation pathways following INTS12 knockdown
RNAseq transcriptomic profiling of cells depleted of INTS12 for 120 hours was used to generate novel func-tional hypotheses, because of improved silencing and greater number of expression changes observed at this time point (Fig. 3c). To identify pathways dysregulated as a result of knockdown, Gene Set Enrichment Analysis (GSEA) [35] was used leveraging 4722 curated gene sets from the Molecular Signatures Database which included 1320 canonical pathway definitions [36–38]. To provide internal replication and account for off-target effects [39], we performed GSEA analyses separately following treatment with either D-siRNA A or C, comparing scrambled D-siRNA treated cells to INTS12 depleted cells. Additionally, un-transfected cells were compared with scrambled D-siRNA treated cells to account for pathways that may be altered following treatment with non-specific D-siRNA as artefacts of the experimental exposure rather than being causally related to the gene knockdown. Pathways reproducibly perturbed by both D-siRNAs (FDR < 0.05) but not affected by scrambled D-siRNA treatment were shortlisted and finally top dys-regulated pathways were identified based on enrichment score ordering.
Using this method three pathways were upregulated and eight pathways were downregulated (Fig. 4a). Colla-gen formation and extracellular matrix organization pathways were the top two upregulated pathways (Fig. 4a, Additional file 1: Figure S3, Figure S4, Figure S5). The top two downregulated pathways were cytosolic tRNA aminoacylation and PERK regulated gene expression (Fig. 4b, Fig. 4c) which is a sub-pathway of the unfolded protein response (Additional file 1: Figure S3, Figure S6, Figure S7). We also observed significant downregulation of other protein metabolism related pathways, including acti-vation of genes by activating transcription factor 4 (ATF4) and glycine, serine and threonine metabolism pathways (Fig. 4a, Additional file 1: Figure S6, Figure S7). ATF4 ex-pression was reduced by 70 ± 5% and 45 ± 2% in D-siRNA A and C transfected cells when compared to scrambled D-siRNA transfected cells respectively (FDR < 0.05) suggesting an impact on integrated stress response [40]. Dysregulation of these pathways was not observed when comparing un-transfected cells to scrambled D-siRNA cells (Fig. 4c). Overall, we observed greater number of dysregulated gene sets meeting the statistical significance (Fig. 4a), larger effect sizes (Additional file 1: Figure S3), higher number of genes contributing to enrichment score (i.e. leading edge
group), greater enrichment scores (Fig. 4B, Additional file 1: Figure S4, Figure S6) and lower variance of gene expression (Fig. 4c, Additional file 1: Figure S5, Figure S7) among the downregulated pathways. This suggests that INTS12 knockdown predominantly results in gene and pathway downregulation. Although these experiments cannot specify whether mechanistically these effects are directly or indirectly caused by INTS12, it is possible to say that they were initiated by INTS12 knockdown and thus may be causally attributed to the levels of this gene.
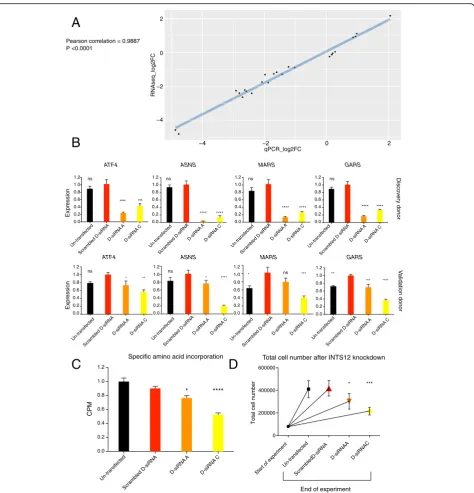
INTS12 is a regulator of protein synthesis and proliferative capacity
In order to validate the RNAseq data, the expression of
methionyl-tRNA synthetase (MARS) and glycyl-tRNA
synthetase (GARS) genes from the tRNA synthetases
pathway and ATF4 and Asparagine Synthetase (ASNS)
genes from the PERK pathway were assessed by qPCR. Analysis revealed the correlation of differences in gene expression derived from RNAseq and qPCR estimates to be 0.99 (Fig. 5a). The effect of knockdown on genes be-longing to these top two downregulated pathways was confirmed by independent experiments in cells from an additional donor. Importantly INTS12 was suppressed by 72 ± 4% and 86 ± 2% in the validation donor for D-siRNA A and C respectively versus 93 ± 1% and 85 ± 2% in the discovery donor for D-siRNA A and C respectively which was mirrored by magnitude of changes observed among the assayed target genes (Fig. 5b). These data fur-ther support the regulatory effect of INTS12 upon protein translation pathways.
Because of INTS12 knockdown induced downregulation of several key pathways involved in protein metabolism and translational control, the question was whether this manipulation would affect cellular translation phenotype. As predicted, INTS12 silencing repressed protein synthe-sis by 23 ± 3% and 47 ± 3% in D-siRNA A and C respect-ively (Fig. 5c). Since cell division requires doubling of protein content prior to separation, we also conjectured that INTS12 depletion would affect the cells’capacity to proliferate. Interestingly, counts revealed 25 ± 13% and 48 ± 4% decrease of total cell numbers in D-siRNAs A and C conditions respectively (Fig. 5d), mirroring the observed reduction in protein synthesis. Thus the observed molecu-lar signature impacted the relevant phenotypes, demon-strating INTS12 as a regulator of genes forming part of translational pathways.
Characterization of INTS12 binding sites and their association with fixed elements
which of these scenarios is the case. Therefore, we aimed to test the hypothesis that its binding might be enriched for promoters of genes differentially expressed following
knockdown by performing ChIPseq [41] using two inde-pendent donors’HBECs and an antibody that we tested to be specific for INTS12 (Additional file 1: Figure S1).
ACTIVATION OF GENES BY ATF4 ALDOSTERONE REGULATED SODIUM REABSORPTION AMINOACYL TRNA BIOSYNTHESIS COLLAGEN FORMATION CYTOSOLIC TRNA AMINOACYLATION EXTRACELLULAR MATRIX ORGANIZATION GLYCINE SERINE AND THREONINE METABOLISM NOD LIKE RECEPTOR SIGNALING PATHWAY PERK REGULATED GENE EXPRESSION TRNA AMINOACYLATION UNFOLDED PROTEIN RESPONSE
−2 −1 0 1 2
Enrichment score
Pathway
0.01 0.02 0.03 0.04
q.value No of significant genes 20
30
40
GSEA analysis of INTS12 knockdown
A
Cytosolic tRNA aminoacylation
QARS AIMP2 FARSA HARS AIMP1 FARSB CARS RARS DARS GARS EEF1E1
AARS WARS
MARS NARS TARS
PPA1 VARS LARS YARS EPRS KARS SARS
IARS
A1 A2 A3 C1 C2 C3 NC2 NC3 NC1 UT3 UT2 UT1
−2 −1 0 1
HERPUD1
−1
ATF4 HSPA5 DDIT3 ASNS ATF3 ATF4P3 IGFBP1 CCL2 IL8 EXOSC5 EXOSC4 DCP2 EIF2AK3 EXOSC9 NFYB NFYA EXOSC2 DIS3 PARN EXOSC7 ATF6 EXOSC1 EXOSC8 EXOSC3 EIF2S1 KHSRP EXOSC6
UT1 UT2 UT3A1 A2 A3 C1 C2 C3 NC1 NC2 NC3
0 1 2 3
PERK regulated gene expression
B
C
Fig. 4Systematic analysis of dysregulated pathways in INTS12 depleted cells.aCleveland’s plot showing the GSEA results of representative
[image:9.595.57.537.86.575.2]−4 −2 0 2
−4 −2 0 2
qPCR_log2FC
RNAseq_log2FC
A
Pearson correlation = 0.9887 P <0.0001
B
Un-transfected Scrambled D-siRNA D-siRNA A D-siRNA C 0.0 0.2 0.4 0.6 0.8 1.0 1.2Specific amino acid incorporation
CPM
* ****
C
D
Start o f experiment Un-transfected Scr ambledD -siRNA D-siRNAA D-siRNAC 0 200000 400000 600000
Total cell number after INTS12 knockdown
Total cell num
ber * ***
End of experiment
r o n o d yr e v o c si D GARS ATF4 Un-tr ansfected Scra mbled D -siRNA D-siRNA A D-siRN A C **** **** 0.0 0.2 0.4 0.6 0.8 1.0 1.2 Un-tr ansfected Scra mbled D -siRNA D-siRNA A D-siRNA C **** *** 0.0 0.2 0.4 0.6 0.8 1.0 1.2 ATF4 Un-tr ansfected Scra mbled D-siRNA D-siRNA A D-siRNA C * ** 0.0 0.2 0.4 0.6 0.8 1.0 1.2 MARS Un-tr ansfected Scra mbled D-siRNA D-siRNA A D-siRN A C **** **** 0.0 0.2 0.4 0.6 0.8 1.0 1.2 MARS Un-tr ansfected Scr ambled D-siRNA D-siRNA A D-siRNA C *** ns 0.0 0.2 0.4 0.6 0.8 1.0 1.2 Un-tr ansfected Scr ambled D -siRNA D-siRN A A D-siRNA C * **** ASNS Un-tr ansfected Scra mbled D-siRNA D-siRNA A D-siRN A C **** **** 0.0 0.2 0.4 0.6 0.8 1.0 1.2 0.0 0.2 0.4 0.6 0.8 1.0 1.2 ASNS Un-t ransfected Scra mbled D -siRNA D-siRNA A D-siRN A C *** **** r o n o d n oi t a dil a V 0.0 0.2 0.4 0.6 0.8 1.0 1.2 GARS Expr essi on Expr essi on ns ** * ns
ns ns ns ns
Fig. 5Technical, biological and phenotypic validation of the INTS12 knockdown impact on the protein synthesis pathways.aTechnical validation
[image:10.595.63.538.85.579.2]We also intended to investigate INTS12 interaction with both fixed features [42] and cell-type-specific regulatory elements of the human genome [43, 44]. Out of a total of 37142070, 47776470 and 42932683 reads, 78.3%, 78.4 and 77.4% were uniquely mappable, while 81.9%, 83.0 and 93.0% were non-redundant in the first, second donor and isotype control respectively.
We first tested inter-donor reproducibility of the ChIPseq signal. Peak calling revealed that there were 70772 and 51377 binding sites in the first and second donor respectively (FDR < 0.05). An inter-donor associ-ation test of ChIPseq signal in active regions demon-strated a significant correlation of 0.85 implying strong biological reproducibility (Additional file 1: Figure S8). In order to verify sequencing results, three positive sites and one negative site were selected for further validation by ChIP-PCR in each ChIP sample. The number of binding events per thousand cells derived from ChIP-PCR corresponded well with the observed ChIPseq sig-nal validating our sequencing results (Additiosig-nal file 1: Figure S9).
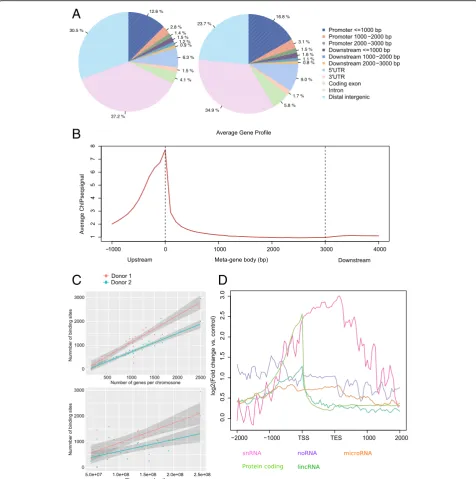
The top three fixed genomic features associated with INTS12 binding were intron, intergenic and promoter (transcriptional start site (TSS) ± 3000 bp) regions. In the first donor they occupied 37.2%, 30.5 and 16.8%, while in the second donor they intersected with 34.9%, 23.7 and 21.4% of the total binding sites respectively (Fig. 6a). We noted that 74.9 and 78.5% of all promoter binding occurred proximally to TSS in the first and sec-ond donor respectively. In agreement, a gene-centric analysis over a meta-gene body (collection of hg19 RefSeq genes), revealed INTS12 binding to be in close proximity to the TSS (Fig. 6b).
Next we performed a correlation analysis of INTS12 binding sites with the number of annotated genes and with the nucleotide length of each chromosome. INTS12 binding in both donors correlated very well with the number of genes (Fig. 6c). Correlations with chromo-some length were notably weaker (Fig. 6c), indicating that INTS12 is more likely to regulate gene expression rather than being ‘merely distributed’ across the chro-mosomes. Based on this analysis we conclude that INTS12 binding sites along the genome are closely cor-related with genes.
Since the canonical function of INTS12 is processing of snRNAs [9] our initial prediction was that it would be pri-marily enriched over the bodies of snRNA genes and less so for other gene classes. However, our observation of the widespread distribution of INTS12 binding (Additional file 1: Figure S10) prompted us to test for binding enrich-ment over the bodies of other gene classes. We tested pro-tein coding, snRNA, small nucleolar RNA (snoRNA), microRNA, and long intergenic RNA (lincRNA) genes, and found that protein coding and snRNA genes show the
highest enrichment for INTS12 binding (Fig. 6d). For protein-coding genes, peak binding is proximal to the TSS while for snRNA genes the binding is enriched down-stream of the transcriptional end site (TES). Of note, the peak binding for lincRNA genes is near the TSS as for the protein coding genes. The enrichment near TES for snRNA genes is in agreement with INTS12 role as part of snRNA processing machinery which occurs simultan-eously to the nascent transcription of 3’box elements [9]. In summary, the observed different patterns of binding over these protein coding and snRNA regions suggest dis-tinct functional activities for INTS12 depending on the class of the genes it binds to.
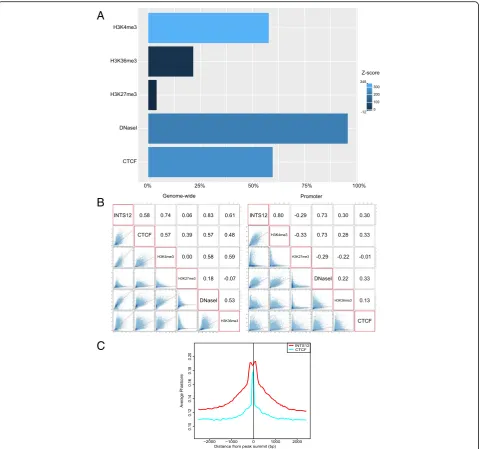
Association of INTS12 binding with specific regulatory elements
We next examined the localisation of INTS12’s binding in relation to specific regulatory elements identified in HBECs [45]. Because bioinformatic searches indicated INTS12’s PHD motif domain to be a candidate nucleosomal histone 3 tail binding protein, we tested the intersection of repre-sentative INTS12 binding with reference localizations of histone 3 lysine 4 trimethylation (H3K4me3), histone 3 lysine 36 trimethylation (H3K36me3), and histone 3 lysine 27 trimethylation (H3K27me3) modifications using per-chromosome randomization test [46] (Fig. 7a, Additional file 1: Figure S11). 58% of INTS12 binding co-localized with H3K4me3 (Z-score = 348), 21% with H3K36me3 (Z-score = 13), and 4% with H3K27me3 (Z-score =−12). Interestingly, 96% of INTS12 binding occurred in the vicinity of HBECs’DNaseI accessible chromatin signature (Z-score = 223). INTS12 also overlapped with CTCF insu-lator protein at 60% of its binding sites (Z-score = 264).
In addition to testing the relationship between cross-binding of INTS12 and cell type variable mobile element sites we also examined the overall correlation of their respective ChIPseq signals on a genome-wide scale (Fig. 7b). In agreement with our initial observations, INTS12 signal most strongly correlated with accessible chromatin (ρ= 0.83) followed by H3K4me3 (ρ= 0.74). H3K36me3, CTCF and H3K27me3 had weaker correla-tions of 0.61, 0.58, and 0.06 respectively. Since gene-centric analysis revealed INTS12 binding to be enriched near TSS we also examined the correlation of ChIPseq signals at the promoters. In this analysis, the strongest correlation was observed between INTS12 and H3K4me3 (ρ= 0.80) outweighing the correlation between INTS12
and DNaseI (ρ= 0.73). Correlations with H3K36me3,
CTCF and H3K27me3 were weak at the promoters being 0.3, 0.3, and−0.29 respectively.
associated with DNaseI signature, while at the promoter
regions INTS12 is more highly associated with
H3K4me3 modification. The identified binding sites are likely to be biologically active as INTS12 peak regions (±500 bp in both directions from the peak summit) show stronger evolutionary conservation when compared with
proximal neighbouring regions (Fig. 7c). INTS12 regions appeared more evolutionary conserved than CTCF sites, and interestingly, CTCF binding locations are much more narrowly conserved (±80 bp in both directions from the peak summit) than what is observed for INTS12. These representative observations from the first donor are
A
B
C
D
Fig. 6Summary of INTS12 binding to fixed features of the human genome.aPercentage of INTS12 binding sites falling on the fixed annotated
[image:12.595.59.536.88.568.2]recapitulated in the second donor and therefore our study provides supporting evidence of recruitment of INTS12 into transcriptionally active loci which may be modulated via its binding to histone 3 and recognition of H3K4me3 modification.
Combination of ChIPseq and RNAseq reveals INTS12 regulome
To provide insights into the dynamics of INTS12 regula-tion, we have overlaid ChIPseq and RNAseq datasets. As INTS12 showed the highest enrichment with DNaseI
A
B
C
Fig. 7Summary of INTS12 binding with HBEC epigenetic regulatory elements.aPercent of total INTS12 binding sites overlapping with HBEC-specific
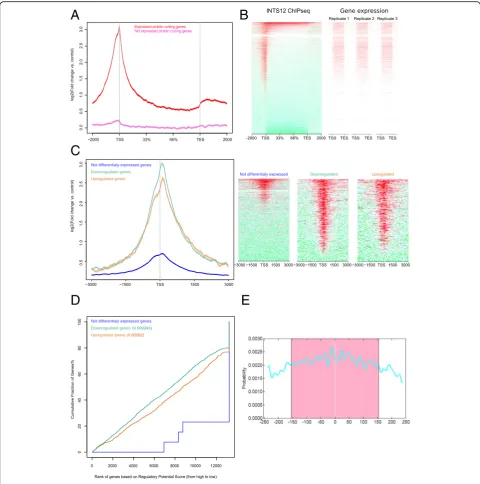
[image:13.595.59.541.87.536.2]and H3K4me3 sites, both marking active transcription [47, 48], and poor correlation with H3K27me3, which marks silenced loci [47], we examined whether these ob-servations agree with gene expression in basal HBECs. INTS12 had 8-fold higher enrichment of binding near the TSS of expressed genes (defined as having greater than zero fragments per kilobase per million reads (FPKM) in at least one biological replicate). On the other hand, INTS12 had only 1.2-fold enrichment of binding over silenced genes (defined as having zero FPKM in three biological replicates) (Fig. 8a). The mag-nitude of binding corresponded well with the degree of gene expression (Fig. 8b).
Next we aimed to identify the set of genes regulated by INTS12 (i.e. its regulome). Genes were divided into upregulated, downregulated and not differentially ex-pressed following INTS12 knockdown. On average there was 6-fold, 8-fold and 1.6-fold enrichment of INTS12 binding above genome background near the TSS of upregulated, downregulated and not differentially ex-pressed genes respectively (Fig. 8c). Thus of the total number of downregulated and upregulated genes 92 and 85% of genes show evidence of INTS12 binding near their promoters, while only 23% of genes that had no evidence of differential expression showed this local-ization. To provide validation for our findings we calcu-lated the regulatory potential of INTS12 for each gene based on evidence of near promoter (TSS ± 1000 bp) binding as well as significance of differential expression following D-siRNAs depletions, and plotted the ranked list of genes based on their regulation versus cumulative fraction of genes having a given or higher regulatory po-tential score (Fig. 8d) [49]. Deregulated genes had sig-nificantly greater regulatory potential scores than static genes, with downregulated having lower P-value than upregulated. This shows that the genes with evidence of near promoter binding were contributing to the altered expression following INTS12 knockdown, with bias for supressed genes. Moreover, >90% of downregulated genes had higher regulatory potential than upregulated ones explaining more robust effects observed among the downregulated pathways.
Motif enrichment and distribution uncovers INTS12 mode of action
We next sought to understand if INTS12 binds to DNA directly or in a cooperative fashion. Central motif en-richment analysis can identify whether the precipitated protein shows evidence of direct or cooperative DNA binding based on the probability distribution of enriched motif among its binding sites. Proteins with direct DNA binding, such as transcription factors, display binding sites clustering near the centres of the declared ChIPseq peaks [50] and we leveraged this method to test the
most likely type of INTS12 binding. Using a differential analysis approach [51], we identified an enrichment for a motif among 20 and 12% of the total sites which occurred only among 6 and 5% of background genome sequences in the first and second donor respectively. The same signature was recapitulated by a separate non-differential algorithm [52]. The identified sequence was compared to currently known motifs [53] and was found to be identical to a motif previously found enriched among binding sites of activator protein 1 [54], activat-ing transcription factor 3, nuclear basic leucine zipper, jun dimerization protein 2 [55, 56], nuclear factor eryth-roid 2 as well as Fos-related antigen 2 [45]. Although this motif appears to be centrally distributed, the site probability is relatively broad (Fig. 8e) suggesting that much of the binding via the identified motif occurs in cooperation with other molecules. We conclude that among the sites where the identified enriched motif oc-curs, INTS12 does not have the characteristics of a tran-scription factor and is more likely to act as a co-factor in concert with other molecules.
Discussion
Our study provides key insights into the molecular and cellular functions as well as the regulatory properties of
INTS12, a candidate lung function gene. Through lung
eQTL approach we present evidence that SNPs
associated with pulmonary parameters also correlate
with INTS12 expression, which is not the case for the
neighbouring GSTCD gene. eQTL analyses have
sug-gested that it is the altered expression of INTS12 as a more likely driver of the genetic association for lung function, but this has been based on the data obtained from non-lung tissue [7]. Due to the diversity of tissue gene expression, it is of pivotal importance to use phenotype-relevant datasets [20]. A previous investiga-tion of a lung microarray dataset [55, 56] failed to detect a significant eQTL effect on INTS12. This may have been due to the technical heterogeneity of hybridization-based array assays [57]. Using a more sensitive lung RNAseq dataset, in our eQTL analysis we were able to detect the effect of lung function SNPs on INTS12 expression. It has become largely accepted that INTScom exerts its effects via snRNA processing pathway, however we find that in HBECs, among U1, U2, U4 and U5 species, only U2 3’-end formation is affected following INTS12 knockdown.
A
C
D
E
B
[image:15.595.57.538.87.572.2]contributions of various complex members to snRNA processing [9–12], maintenance of perinuclear dynein [13] and ciliogenesis [17]. What remains to be elucidated is how INTScom perturbations yield specific yet diverse phenotypes.
It has been suggested that the primary mechanism behind that is the alteration of snRNA 3’-end formation affecting the splicing of mRNAs belonging to genes of particular functional groups explaining the specific phenotypic effects [13, 15, 16]. For instance, it has been argued that the induced downregulation of INTS5, INTS9, and INTS11 in zebrafish causes impaired haem-atopoiesis due to aberrant splicing of smad1 and smad5 via a dominant negative form of these transcripts [16]. However, given the facts that INTS11 depletion results in a loss of perinuclear dynein whilst there was no en-richment for misprocessed transcripts encoding dynein-dynactin subunits, adaptor molecules or dynein-binding cassettes in HeLa cells [13] and our own observation of minor effect of INTS12 knockdown on snRNA process-ing concurrent with misbalanced protein synthesis, this hypothesis seems unlikely in a human model. This is further supported by a literature review of studies that compared the contribution of various INTScom mem-bers to snRNA processing, showing INTS12 to have a fairly small role in comparison to other members of the complex (Additional file 2: Table S6). Moreover, in the overrepresentation analysis of genes with evidence of D-siRNAs-reproducible altered splicing we found a poor enrichment of only immune response pathways (e.g. class I MHC mediated antigen processing and presentation; FDR < 0.05) but none of genes with altered splicing were part of any of the identified protein synthesis pathways (data not shown). Therefore, partly based on our observa-tion of poor correlaobserva-tion of INTS12 levels with the rest of the complex in our datasets, alternatively we propose INTScom subunits to have different activities despite their physical association in the same complex and with POLII.
Consequently, the prediction from this model would be that individual INTScom members are pleiotropic [58] and have distinct functions which may explain the pleth-ora of phenotypes observed following various perturba-tions of INTScom.
Novel functional roles for INTS12
We have relied on a hypothesis-free approach [20] in order to generate new functional hypotheses about INTS12 function. Following its knockdown with two D-siRNAs, we observed marked downregulation of pathways critical in protein synthesis including tRNA synthetases, unfolded protein response and PERK pathways. To further
investigate the importance of this, we undertook
additional experiments which showed that suppression of INTS12 reduces protein synthesis and proliferative cap-acity. Thus the identified molecular signature affected a relevant phenotype, uncovering a new function for this gene by demonstrating its role in regulating cellular trans-lation. We have also detected upregulation of collagen formation and extracellular matrix deposition, but the effects upon the upregulated pathways were less robust.
We then performed INTS12 ChIPseq to delve deeper into the mechanism behind the identified gene expression changes. The top three fixed genomic features associated with INTS12 binding were introns, intergenic regions and promoters. A gene-centric analysis shows a distinct local-ization near the TSS and TES for protein coding and snRNA genes respectively. Moreover, INTS12 interaction was enriched for canonical epigenetic marks of transcrip-tion. The combined RNAseq and ChIPseq analyses re-vealed preferential INTS12 binding to the expressed rather than silenced genes and defined its regulome which includes genes belonging to the aforementioned pathways.
INTS12 in evolution and development
It has been hypothesised that the mechanisms involved in the early human lung development may alter lung function
(See figure on previous page.)
Fig. 8Combination of ChIPseq and RNAseq following INTS12 depletion defines INTS12 regulome and mode of action.aLog2fold change of INTS12
ChIPseq binding signal versus input control across gene bodies of expressed and silenced genes in basal HBECs.bComparison of INTS12 binding vs. corresponding gene expression in basal HBECs. Genes were ordered based on the level of INTS12 ChIPseq signal. The same sorted gene list was used to evaluate their transcription in basal un-transfected HBECs where red colour indicates higher expression derived from read counts on the corresponding gene bodies.cAverage INTS12 binding profile for differentially expressed genes and genes with no evidence of differential expression following INTS12 depletion (left) as well as heatmap representation of this binding (right), with red indicating enrichment while green denoting lack of enrichment in ChIPseq sample versus input control.dPrediction of the activating and repressive function of INTS12. The cumulative fraction of genes is plotted against the regulatory potential, based on significance of representative D-siRNA A differential expression and ChIPseq evidence of binding near genes’
TSS. Regulatory potential is a product of the ranked potentials (RP¼rank Sðg bindingÞ
n
rank Sðg differential expressionÞ
n Þas judged by distance and number of INTS12
and predispose to COPD later in life [59]. Although a sub-set of lung function associated genes show evidence of dif-ferential expression between various stages of embryonic pulmonary tissue formation [20], there is still an incomplete understanding of the molecular mechanisms behind normal respiratory system development and how the alterations therein contribute to disease pathophysiology. Given that there is no homologousINTS12in unsegmentedC. elegans or unicellular S. cerevisiae, its strong conservation and le-thal effect of knockout inM. musculus, this gene may have been important for the evolution of complex metazoan tis-sue differentiation and specialization. This is also supported by our observation of INTS12 binding association with ca-nonical epigenetic marks of transcription which are known to be reset during mammalian organogenesis [60]. It there-fore seems plausible that INTS12 regulates lung develop-ment or repair via a developdevelop-mental pathway.
INTS12 knockdown induced gene dysregulation of relevance to pulmonary physiology
INTS12 knockdown for 48 h and 120 h resulted in repro-ducible dysregulation of core subset of genes important in airway biology, such as SERPINA1,TGFβI, IL6, and IL8. Of particular interest is LEP which had 4.51 and 29.16-fold upregulation relative to control in D-siRNA A
condi-tion at 48 h and 120 h time points respectively. LEP
associates with the same lung function parameter as
INTS12(6, 33) albeit weaker than what was reported for
4q24 locus. Crucially LEP levels negatively correlate with lung function [34]. It is possible that reduced levels of INTS12 in specific allele carriers are responsible for ele-vated expression ofLEPwhich may in turn account for re-duced lung function. These causal hypotheses provide biological understanding of the genetic association signal for pulmonary function but require further exploration.
Conclusion
We conclude that INTS12 is a pleiotropic gene with at least two different functions depending on the class of genes where its binding occurs. In agreement with the ca-nonical function, over snRNA genes INTS12 is likely to contribute to their 3’-end formation. However, in contrast to what was reported in Drosophila, INTS12 requirement for snRNA processing is moderate in human cells highlighting differences between these two species. Our data identify a significant and previously unrecognized role for INTS12 in protein synthesis control. A novel INTS12 regulome was uncovered and implies a regulation of pro-tein coding genes belonging to the translational pathways.
Methods
Expression quantitative trait locus analysis
To functionally elucidate the GWAS signal for lung function at 4q24 locus, a lung specific and RNAseq
based cis-eQTL dataset [21] was used. The nominal
P-values from testing the association between SNP vari-ation and gene expression were obtained and corrected in R using Benjamin-Hochberg FDR correction [61]. The FDR values from eQTL analyses of 4q24 SNPs were com-pared to the significance of association with lung function parameter forced expiratory volume in a first second from the Repapi et al. study [3].
RNA interference
The purpose of RNAi experiments was to deplete cells of INTS12 in order to (a) study it in the context of existing body of knowledge to translate canonical activity into a hu-man model, (b) predict novel functions based on transcrip-tomic profiling, (c) and to test them experientially. To help distinguish between true and off-target effects, gene knock-down was performed using two independent D-siRNAs. Experiments included un-transfected and scrambled D-siRNA transfected controls. RNAseq profiling was per-formed 48 h and 120 h after the initiation of RNAi, to compare the transcriptomic responses at these two time points. RNAseq pathway analyses, functional and valid-ation experiments were assessed using 120 h long interfer-ence. INTS12 depletion was performed in discovery and independent validation donor HBECs using a minimum of three biological replicates.
RNAseq
RNA extraction from knockdown and control conditions, cDNA library preparation and next generation sequencing are described in Additional file 3: Supplemental Methods.
Quantitative PCR
U1, U2, U4 and U5 snRNA processing was assessed by measuring qPCR-estimated relative levels of their respect-ive misprocessed transcripts. MARS, GARS, ASNS, and ATF4expression was also measured by qPCR for technical validation on the cDNA samples derived from RNA se-quenced total RNA samples, and for biological validation in different donor cells using the same experimental design. Details of cDNA synthesis and qPCR assays are described in Additional file 3: Supplemental Methods.
RNAseq and pathway data analyses
Detailed description of RNAseq and pathway analyses is in the Additional file 3: Supplemental Methods.
ChIPseq and ChIP-PCR data analyses
Functional assays
Details about protein synthesis measurement and ana-lyses are in the Supplemental Methods. Proliferative cap-acity was assessed by cell counts and details are described in Additional file 3: Supplemental Methods.
Immunofluorescence
Antibodies, immunofluorescence methods, and detection are described in Additional file 3: Supplemental Methods.
Statistics
Data were grouped from multiple experiments and are expressed as average ± standard error of mean. Statistical significance was assessed by ordinary one-way ANOVA followed by Fisher’s Least Significant Difference test. Results were considered significant whenP< 0.05. For high throughput analyses the nominal P-values were corrected for multiple comparisons using FDR correction. The signifi-cance of dN/dS ratios in the selection test, was obtained via the Single-Likelihood Ancestor Counting algorithm [62].
Additional files
[image:18.595.304.537.456.738.2]Additional file 1: Figure S1–Figure S12.Contains all supplemental
figure data. Each figure has its legend. (PDF 3851 kb)
Additional file 2: Table S1–Table S6.Contains all supplemental table
data. Each table has its legend. (PDF 166 kb)
Additional file 3:Contains a more detailed supplemental information in
relation to the methods: Cell Culture, RNAi, RNAseq, qPCR, RNAseq and Pathway Data Analysis [63], Protein synthesis by 35S-Methionine incorporation assay [64], Assessment of proliferative capacity by cell counts, ChIPseq, ChIP-PCR, ChIPseq Data Analysis [65–68], ENCODE data retrieval and analysis [69], Immunofluorescence [70]. (PDF 89 kb)
Abbreviations
ASNS:Asparagine Synthetase;ATF4: Activating transcription factor 4; ChIPseq: Chromatin immunoprecipitation and sequencing;cis-eQTL: Nearby expression quantitative trait locus; COPD: Chronic Obstructive Pulmonary Disease; CPM: Counts per methionine; CTCF: CCCTC-binding factor; D-siRNA: Dicer substrate small interfering RNA; eQTL: Expression quantitative trait locus;
GARS: Glycyl-tRNA synthetase; GSEA: Gene set enrichment analysis;
GSTCD: Glutathione S-transferase, C-terminal Domain Containing; GWAS: Genome-wide association studies; H3K27me3: Histone 3 lysine 27 trimethylation; H3K36me3: Histone 3 lysine 36 trimethylation; H3K4me3: Histone 3 lysine 4 trimethylation; HBEC: Human bronchial epithelial cell;
IL1R1: Interleukin 1 receptor 1;INTS12: Integrator Complex subunit 12; INTScom: Integrator Complex;LEP: Leptin; lincRNA: Long intergenic RNA;
MARS: Methionyl-tRNA synthetase; PHD: Plant homeodomain; POLII: RNA polymerase II; qPCR: Quantitative polymerase chain reaction; RNAi: RNA interference; RNAseq: RNA sequencing;SERPINA1:α1-antitrypsin; snoRNA: Small nucleolar RNA; SNP: Single nucleotide polymorphism; snRNA: Small nuclear RNA; TES: Transactional end site;TGFβI: Transforming growth factorβ1; trans-eQTL: Distant eQTL; TSS: Transcriptional start site
Acknowledgments
Authors would like to thank Dr Elisa Laurenti for reviewing the manuscript.
Funding
This work was primarily funded by a Medical Research Council (MRC) programme grant (G1000861). Research in the corresponding author’s laboratory is supported by European Hematology Association and a core support grant of the Wellcome Trust–MRC Cambridge Stem Cell Institute.
Availability of data and materials
The raw and processed RNAseq and ChIPseq datasets generated and analysed during the current study are available in the Gene Expression Omnibus and were assigned GSE80386 series identifier (public release date 31st of December 2017).
Author’s contributions
AKK performed the majority of laboratory studies and data analyses. CM contributed to study design, data interpretation and performed protein synthesis assays. AKK, IPH and IS wrote the manuscript. IPH and IS supervised the laboratory work. AF performed eQTL analyses. All authors commented on the content of the paper. All authors read and approved the final manuscript.
Competing interests
Authors declare that there are no financial or other competing interests in relation to this manuscript.
Consent for publication
Not applicable.
Ethics approval and consent to participate
HBECs used in this study were commercially obtained from Lonza (Berkshire, UK; Product code CC-2540).
Publisher’s Note
Springer Nature remains neutral with regard to jurisdictional claims in published maps and institutional affiliations.
Author details
1Wellcome Trust - Medical Research Council Cambridge Stem Cell Institute,
University of Cambridge, Cambridge, UK.2Division of Respiratory Medicine,
School of Medicine, University of Nottingham, Nottingham NG7 2UH, UK.
3Division of Molecular and Cellular Sciences, School of Pharmacy, University
of Nottingham, Nottingham NG7 2RD, UK.4Department of Pulmonology,
University of Groningen, Groningen 9713 GZ, Netherlands.
Received: 6 October 2016 Accepted: 14 March 2017
References
1. Mathers C, Boerma T, Fat MAD. The global burden of disease: 2004 update: World Health Organisation. 2008.
2. Rabe KF, et al. Global Initiative for Chronic Obstructive Lung, D. 2007. Global strategy for the diagnosis, management, and prevention of chronic obstructive pulmonary disease: GOLD executive summary. Am J Respir Crit Care Med. 2007;176(6):532–55.
3. Repapi E, et al. Genome-wide association study identifies five loci associated with lung function. Nat Genet. 2010;42:36–44.
4. Hancock DB, et al. Meta-analyses of genome-wide association studies identify multiple loci associated with pulmonary function. Nat Genet. 2010;42:45–52.
5. Castaldi PJ, et al. The association of genome-wide significant spirometric loci with chronic obstructive pulmonary disease susceptibility. Am J Respir Cell Mol Biol. 2011;45:1147–53.
6. Wain LV, et al. Novel insights into the genetics of smoking behaviour, lung function, and chronic obstructive pulmonary disease (UK BiLEVE): a genetic association study in UK Biobank. Lancet Respir Med. 2015;3:769–81. 7. Obeidat M, et al. GSTCD and INTS12 regulation and expression in the
human lung. PLoS One. 2013;8:e74630.
8. Stadelmayer B, et al. Integrator complex regulates NELF-mediated RNA polymerase II pause/release and processivity at coding genes. Nat Commun. 2014;5:5531.
9. Baillat D, Hakimi MA, Naar AM, Shilatifard A, Cooch N, Shiekhattar R. Integrator, a multiprotein mediator of small nuclear RNA processing, associates with the C-terminal repeat of RNA polymerase II. Cell. 2005;123:265–76.
10. Ezzeddine N, Chen J, Waltenspiel B, Burch B, Albrecht T, Zhuo M, Warren WD, Marzluff WF, Wagner EJ. A subset of Drosophila integrator proteins is essential for efficient U7 snRNA and spliceosomal snRNA 3’-end formation. Mol Cell Biol. 2011;31:328–41.
Integrator complex and a requirement for cyclin C/Cdk8 in snRNA 3 '-end formation. RNA. 2012;18:2148–56.
12. Chen J, Waltenspiel B, Warren WD, Wagner EJ. Functional analysis of the integrator subunit 12 identifies a microdomain that mediates activation of the Drosophila Integrator complex. J Biol Chem. 2013;288:4867–77. 13. Jodoin JN, Sitaram P, Albrecht TR, May SB, Shboul M, Lee E, Reversade B,
Wagner EJ, Lee LA. Nuclear-localized Asunder regulates cytoplasmic dynein localization via its role in the Integrator complex. Mol Biol Cell. 2013;24:2954–65. 14. Gardini A, Baillat D, Cesaroni M, Hu D, Marinis JM, Wagner EJ, Lazar MA,
Shilatifard A, Shiekhattar R. Integrator regulates transcriptional initiation and pause release following activation. Mol Cell. 2014;56:128–39.
15. Otani Y, et al. Integrator complex plays an essential role in adipose differentiation. Biochem Biophys Res Commun. 2013;434:197–202. 16. Tao S, Cai Y, Sampath K. The Integrator subunits function in hematopoiesis
by modulating Smad/BMP signaling. Development. 2009;136:2757–65. 17. Jodoin JN, Shboul M, Albrecht TR, Lee E, Wagner EJ, Reversade B, Lee LA.
The snRNA-processing complex, Integrator, is required for ciliogenesis and dynein recruitment to the nuclear envelope via distinct mechanisms. Biology Open. 2013;2:1390–6.
18. Kim S, Dynlacht BD. Assembling a primary cilium. Curr Opin Cell Biol. 2013;25:506–11.
19. Kim S, Zaghloul NA, Bubenshchikova E, Oh EC, Rankin S, Katsanis N, Obara T, Tsiokas L. Nde1-mediated inhibition of ciliogenesis affects cell cycle re-entry. Nat Cell Biol. 2011;13:351–60.
20. Kheirallah AK, Miller S, Hall IP, Sayers I. Translating Lung Function Genome-Wide Association Study (GWAS) Findings: New Insights for Lung Biology. Adv Genet. 2016;93:57–145.
21. Consortium, G. T. The Genotype-Tissue Expression (GTEx) project. Nat Genet. 2013;45:580–5.
22. Amarzguioui M, Lundberg P, Cantin E, Hagstrom J, Behlke MA, Rossi JJ. Rational design and in-vitro and in vivo delivery of Dicer substrate siRNA. Nat Protoc. 2006;1:508–17.
23. Gish W, States DJ. Identification of protein coding regions by database similarity search. Nat Genet. 1993;3:266–72.
24. Bienz M. The PHD finger, a nuclear protein-interaction domain. Trends Biochem Sci. 2006;31:35–40.
25. LAURELL, C. B. & ERIKSSON, S. 2013. The electrophoretic alpha1-globulin pattern of serum in alpha1-antitrypsin deficiency. 1963. COPD, 10 Suppl 1, 3–8. 26. Makinde T, Murphy RF, Agrawal DK. The regulatory role of TGF-beta in
airway remodeling in asthma. Immunol Cell Biol. 2007;85:348–56. 27. Frank JA, Pittet JF, Wray C, Matthay MA. Protection from experimental
ventilator-induced acute lung injury by IL-1 receptor blockade. Thorax. 2008;63:147–53. 28. Grutters JC, Sato H, Pantelidis P, Ruven HJ, Mcgrath DS, Wells AU,
Van den Bosch JM, Welsh KI, Du Bois RM. Analysis of IL6 and IL1A gene polymorphisms in UK and Dutch patients with sarcoidosis. Sarcoidosis Vasc Diffuse Lung Dis. 2003;20:20–7.
29. Heinzmann A, Ahlert I, Kurz T, Berner R, Deichmann KA. Association study suggests opposite effects of polymorphisms within IL8 on bronchial asthma and respiratory syncytial virus bronchiolitis. J Allergy Clin Immunol. 2004;114:671–6.
30. Xie XH, Law HK, Wang LJ, Li X, Yang XQ, Liu EM. Lipopolysaccharide induces IL-6 production in respiratory syncytial virus-infected airway epithelial cells through the toll-like receptor 4 signalling pathway. Pediatr Res. 2009;65:156–62.
31. Falfán-Valencia R, Pavón-Romero GF, Camarena A, et al. The IL1B-511 Polymorphism (rs16944 AA Genotype) is increased in Aspirin-Exacerbated respiratory disease in Mexican population. J Allergy. 2012;2012:5. Article ID 741313. doi:10.1155/2012/741313
32. Qin L, Tan YR, Hu CP, Liu XA, He RX. Leptin is oversecreted by respiratory syncytial virus-infected bronchial epithelial cells and regulates Th2 and Th17 cell differentiation. Int Arch Allergy Immunol. 2015;167:65-71.
33. van den Borst B, et al. Genetics of maximally attained lung function: A role for leptin? Respir Med. 2012;106:235–42.
34. Eising JB, et al. Relationship between leptin and lung function in young healthy children. Eur Respir J. 2014;43:1189-92; doi:10.1183/09031936. 00149613.
35. Subramanian A, et al. Gene set enrichment analysis: a knowledge-based approach for interpreting genome-wide expression profiles. Proc Natl Acad Sci U S A. 2005;102:15545–50.
36. Kanehisa M, Goto S. KEGG: kyoto encyclopedia of genes and genomes. Nucleic Acids Res. 2000;28:27–30.
37. Croft D, et al. The Reactome pathway knowledgebase. Nucleic Acids Res. 2014;42:D472–7.
38. Glaab E, Baudot A, Krasnogor N, Valencia A. Extending pathways and processes using molecular interaction networks to analyse cancer genome data. BMC Bioinformatics. 2010;11:597.
39. Jackson AL, Linsley PS. Recognizing and avoiding siRNA off-target effects for target identification and therapeutic application. Nat Rev Drug Discov. 2010;9:57–67.
40. Marciniak SJ, Garcia-Bonilla L, Hu J, Harding HP, Ron D. Activation-dependent substrate recruitment by the eukaryotic translation initiation factor 2 kinase PERK. J Cell Biol. 2006;172:201–9.
41. Johnson DS, Mortazavi A, Myers RM, Wold B. Genome-wide mapping of in vivo protein-DNA interactions. Science. 2007;316:1497–502.
42. Marnetto D, Molineris I, Grassi E, Provero P. Genome-wide identification and characterization of fixed human-specific regulatory regions. Am J Hum Genet. 2014;95:39–48.
43. Jiang C, Pugh BF. Nucleosome positioning and gene regulation: advances through genomics. Nat Rev Genet. 2009;10:161–72.
44. Madrigal P, Krajewski P. Current bioinformatic approaches to identify DNase I hypersensitive sites and genomic footprints from DNase-seq data. Front Genet. 2012;3:230.
45. The Encode Project Consortium. An integrated encyclopedia of DNA elements in the human genome. Nature. 2012;6:57–74.
46. Gel B, Diez-Villanueva A, Serra E, Buschbeck M, Peinado MA, Malinverni R. regioneR: an R/Bioconductor package for the association analysis of genomic regions based on permutation tests. Bioinformatics. 2016;32:289–91.
47. Gibney ER, Nolan CM. Epigenetics and gene expression. Heredity (Edinb). 2010;105:4–13.
48. Thurman RE, et al. The accessible chromatin landscape of the human genome. Nature. 2012;489:75–82.
49. Wang S, Sun H, Ma J, Zang C, Wang C, Wang J, Tang Q, Meyer CA, Zhang Y, Liu XS. Target analysis by integration of transcriptome and ChIP-seq data with BETA. Nat Protoc. 2013;8:2502–15.
50. Bailey TL, Machanick P. Inferring direct DNA binding from ChIP-seq. Nucleic Acids Res. 2012;40:e128.
51. Heinz S, Benner C, Spann N, Bertolino E, Lin YC, Laslo P, Cheng JX, Murre C, Singh H, Glass CK. Simple combinations of lineage-determining
transcription factors prime cis-regulatory elements required for macrophage and B cell identities. Mol Cell. 2010;38:576–89.
52. Machanick P, Bailey TL. MEME-ChIP: motif analysis of large DNA datasets. Bioinformatics. 2011;27:1696–7.
53. Gupta S, Stamatoyannopoulos JA, Bailey TL, Noble WS. Quantifying similarity between motifs. Genome Biol. 2007;8:R24.
54. Hull RP, et al. Combined ChIP-Seq and transcriptome analysis identifies AP-1/JunD as a primary regulator of oxidative stress and IL-1beta synthesis in macrophages. BMC Genomics. 2013;14:92.
55. Hao K, et al. Lung eQTLs to help reveal the molecular underpinnings of asthma. PLoS Genet. 2012;8(11):e1003029.
56. Wang J, et al. Sequence features and chromatin structure around the genomic regions bound by 119 human transcription factors. Genome Res. 2012;22:1798–812.
57. Zhao S, et al. Comparison of RNA-Seq and Microarray in Transcriptome Profiling of Activated T Cells. PLoS ONE. 2014;9(1):e78644.
58. Rutkowski RJ, Warren WD. Phenotypic analysis of deflated/Ints7 function in Drosophila development. Dev Dyn. 2009;238:1131–9.
59. Probert K, Miller S, Kheirallah AK, Hall IP. Developmental genetics of the COPD lung. COPD Res Prectice. 2015;1:10.
60. Reik W. Stability and flexibility of epigenetic gene regulation in mammalian development. Nature. 2007;447:425–32.
61. Benjamini Y, Hochberg Y. Controlling the false discovery rate - a practical and powerful approach to multiple testing. J R Stat Soc Ser B Methodol. 1995;57:289–300.
62. Pond K, Frost S. Not So different after All: a comparison of methods for detecting amino acid sites under selection. Mol Biol Evol. 2005;22:1208–22. 63. Livak KJ, Schmittgen TD. Analysis of relative gene expression data using
real-time quantitative PCR and the 2-ΔΔCt method. Methods. 2001;25:402–8. 64. Trapnell C, Roberts A, Goff L, Pertea G, Kim D, Kelley DR, Pimentel H,
65. Wong YY, Moon A, Duffin R, Barthet-Barateig A, Meijer HA, Clemens MJ, De Moor CH. Cordycepin inhibits protein synthesis and cell adhesion through effects on signal transduction. J Biol Chem. 2010;285:2610–21. 66. Li H, Durbin R. Fast and accurate long-read alignment with Burrows-Wheeler
transform. Bioinformatics. 2010;26:589–95.
67. Zhang Y, et al. Model-based analysis of ChIP-Seq (MACS). Genome Biol. 2008;9:R137.
68. Shin H, Liu T, Manrai AK, Liu XS. CEAS: cis-regulatory element annotation system. Bioinformatics. 2009;25:2605–6.
69. Shen L, Shao N, Liu X, Nestler E. ngs.plot: Quick mining and visualization of next-generation sequencing data by integrating genomic databases. BMC Genomics. 2014;15:284.
70. Liu T, et al. Cistrome: an integrative platform for transcriptional regulation studies. Genome Biol. 2011;12:R83.
• We accept pre-submission inquiries
• Our selector tool helps you to find the most relevant journal • We provide round the clock customer support
• Convenient online submission • Thorough peer review
• Inclusion in PubMed and all major indexing services • Maximum visibility for your research
Submit your manuscript at www.biomedcentral.com/submit