Proceedings of NAACL-HLT 2016, pages 26–31,
Estimating the Amenability of New Domains
for Deception Detection
Eileen Fitzpatrick
Joan Bachenko
Montclair State University
Linguistech LLC
Montclair NJ 07043
Oxford NJ 07863
[email protected]
[email protected]
Abstract
In this paper we present an initial experiment in the estimation of the amenability of new domains to true/false classification. We choose four domains, two of which have been classified for deception, and use the out-of-rank distance measure on n-grams to aid in deciding whether the third and fourth domains are amenable to T/F classification. We then use a classifier covered in the literature to train on the verified domains and test on the new domains to determine whether the rela-tive distance measure can be a predictor of classification accuracy.
1
Introduction
Recent research in natural language processing has supported the notion that verbal behavior can differentiate truthful from deceptive narratives in several domains, including
spoken personal narratives [Newman et al. 2003; Mihalcea and Strapparava 2009]
online hotel reviews [Ott et al., 2011, 2013; Hernandez-Fusilier, 2014; Feng et al., 2012; Feng and Hirst, 2013]
online book reviews [Fornaciari and Poesio, 2014]
spoken and written criminal narratives [Bachenko et al., 2008; Fornaciari and Poesio, 2011]
CEO quarterly conference calls [Larcker and Zakolyukina, 2012]
emailed cooperative task completion [Zhou, 2004]
These studies result in accuracy rates at predicting True versus False of 70% to 90%. The question we address here is whether an approach similar to this recent work can perform equally successfully across different language domains.
Each study, with the exception of subsequent studies of the online hotel reviews, has built a new data set to analyze its particular domain. Each of these data sets comes at more than typical cost for NLP applications because of the necessity of estab-lishing the truth or falsity of the claim(s) in the da-ta – the “ground truth,” either through fact-checking or laboratory experiment – in addition to assembling the narrative data itself.
However, might there be similarities in the lan-guage of lies across these various domains? There is a substantial literature in psychology and crimi-nal justice that views false narratives as sharing characteristics in common because they describe imagined rather than real events and attitudes. Cri-teria-based content analysis [Steller and Kohnken 1989] and Reality Monitoring [Johnson and Raye 1981; Sporer 2004], used in some European courts, rely on such differences, and [Rayson et al. 2001] find differences in parts-of-speech in imaginative as opposed to informative language, for which [Ott et al. 2011] finds corroboration in the false vs. true hotel reviews. So, while we would certainly expect content word choice to depend on the domain,
there may be broader characteristics of the narra-tive that we could capitalize on that might capture deception in a variety of domains. If so, could we create tools to estimate the difficulty of differenti-ating deceptive from truthful statements in a new domain based on what we know about this differ-entiation in previously analyzed domains?
This paper examines the ability of data from known domains to predict the difficulty of adapt-ing a T/F classifier to a new domain. To do this, we apply the out-of-rank distance metric on the most frequently occurring words in four domains, two related to each other and two unrelated, as a measure of domain distance in order to estimate how difficult it would be to adapt a classifier to the new domain. We then test a classifier on the four domains in order to learn whether the distance measure has predicted whether the domains are close enough to be successfully classified for ve-racity and included in a growing corpus of T/F da-ta.
2
Related Work
Two studies have examined the ability of a classi-fier trained on one set of data to classify data from a different set.
Newman et al. (2003), using five data sets -- in-cluding a spoken narrative about a friend, a spoken defense in a mock crime, and personal opinion nar-ratives on abortion that were either spoken, writ-ten, or typed – built six classifiers, training with four data sets and testing on the fifth as well as training and testing interalia among the five. The classification of the mock crime achieved the low-est accuracy (48%) and the written abortion achieved the highest (67%). Subjectively, this is not surprising since the mock crime shared only its spoken mode with one other dataset while the writ-ten abortion narrative shared the topic with two others.
Mihalcea and Strapparava’s basic 2009 study examined the extent to which 300 false narratives could be distinguished from 300 true narratives on three topics: abortion, the death penalty, and a best friend, with an SVM classifier predicting the t/f distribution of the best friend narratives achieving the best accuracy (77%). In addition, they tested across topics, training on two and testing on the
third, with a Naïve Bayes classifier achieving the best accuracy (62%) on the topic of abortion.
Given that the baseline for these early studies was the random performance of human judgments, these accuracy rates support the technique of topic and mode classification, if not cross-domain.
This work represents the extent to which known datasets sharing many common characteristics are similar. But what if we are asked to include a new domain, as yet unmarked for ground truth, in a corpus? Can we estimate the success of porting a classifier built for data with known characteristics to unknown data, prior to committing to the expen-sive task of establishing ground truth for the new domain? At present, most estimates are based on subjective judgment of the closeness between two data sets. To our knowledge, there has been no formal distance measure that might give empirical support to the feeling that two domains are just too dissimilar to be analyzed by the same classifier.
3
Data Sets
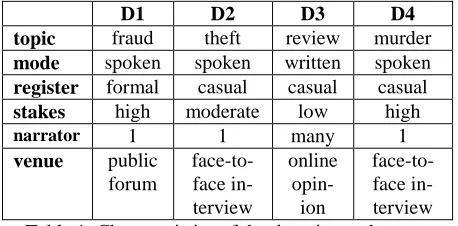
Given two domains, we may have a priori judg-ments about the closeness of their linguistic rela-tionship. Yet, in the areas to which NLP research has been applied to deception, there are many vari-ables that may affect this judgment: the formal language of a legal deposition is different from that of a police interview, and a Facebook post is dif-ferent from a face-to-face conversation. For this preliminary test of the distance among domains, we chose four domains. Table 1 shows the do-mains and their characteristics.
D1 D2 D3 D4
topic fraud theft review murder
mode spoken spoken written spoken
register formal casual casual casual
stakes high moderate low high
narrator 1 1 many 1
venue public
forum
face-to-face in-terview
online
opin-ion
[image:2.612.312.541.538.651.2]face-to- face in-terview Table 1: Characteristics of the domains under comparison.
charac-teristics in the table. All four have been annotated for ground truth, but with D4 showing minimal de-ceptive behavior, with only four claims identified as lies in 13,581 words, and two of the four claims being single word utterances. We hope to find a metric that would distinguish narratives like that of D4 as not amenable to automatic classification in order to avoid expensive ground truth tagging on a document that will not yield useful results with re-spect to deception detection.
4
Experimental Setup and Results
4.1
Measuring Domain DistanceAs a distance metric, we use the n-gram-based out-of-rank model of Cavnar and Trenkle (1994). We are trying to take advantage of the assumed differences not only in word choice but also in style between the truth teller and the liar, which rules out the more standard distance metric for documents, the vector space model. The term matching used by this model is effective when measuring topic distance, but in most cases, the terms that occur with a given topic will not aid in distinguishing true from false claims, particularly if the terms are limited to content words, which are effective in topic classification but not in identify-ing differences in style.
For Cavnar and Trenkle, working in text classi-fication, the out-of-rank measure calculates the dis-tance in frequency of occurrence between a “cate-gory profile” and a document. We use the measure to calculate the distance between the data from one domain, represented by a single document, and an-other domain, also represented by a single docu-ment.
We limited the four documents to just the first 1000 words each to make for direct comparison, since D2, at 1,315 words, is quite small. Given the unique words in such a small sample, we use a simple unigram model, splitting each document in half to test intra-document rank variation as well as rank variation between documents. We compare the rank of the 20 most frequently occurring words in each document against each of the other docu-ments. This enables us to capture difference in rank only, since the top 20 unigrams are shared by all four documents.
Table 2 shows the rank comparison scores for each document. Lower scores indicate a higher re-lationship between two documents with respect to the rank order of their most frequently occurring words.
D1 D2 D3 D4
D1 328.4 614.9 428.8 536.1
D2 753.4 587.8 1013.2 819.3
D3 568.8 837.3 432.1 568.5
D4 607.9 856.5 587.5 277.7 Table 2: Cross-domain frequency rank order
[image:3.612.335.513.154.226.2]D4 is remarkable in two respects. First, it has a significantly lower intra-document variation, as shown on the diagonal in Table 2. Second, the 1 S.D. confidence interval for the inter-document rank order score does not overlap the intervals for the cross-document rank order scores, as shown in Table 3, where the top of the interval for the D4 in-tra-domain ranking is lower than the lowest score for each of the other domains when compared against D4.
Domain Domain score SD
lowest score
highest score
D4 D4 277.7 80.9 196.8 358.6
D4 D1 536.1 132.5 403.5 668.6
D4 D2 819.3 133.4 685.9 952.7
D4 D3 568.5 155.1 413.4 723.6
Table 3: D4 intra-document score interval compared to D1, D2, and D3.
This lack of variation within D4 indicates that it is an outlier. We believe that these differences be-tween D4 and the other domains suggested by this out-of-rank metric warrant caution in investing the time and cost involved in verifying the claims made by the narrator of D4.
[image:3.612.308.541.382.478.2]4.2
New Domain ClassificationTo determine whether the distance metric would give us a means of successfully separating data that would be amenable to T/F classification from data that would not, we submitted a portion of all four domains to classifier testing. We used our own sys-tem for this test, although we believe the outlier status of D4 would be problematic for any system identifying deception because of the absence of ly-ing in the narrative.
Each domain was annotated for the features in (1) and (2):
(1) Lack of commitment to a statement or decla-ration, where the speaker uses linguistic devices to avoid making a direct statement of fact. Five of the indicators fit into this class: (i) linguistic hedges including non-factive verbs and nominals, e.g. maybe, I think, to the best of my knowledge; (ii) qualified assertions, which leave open whether an act was performed, e.g. I needed to get my in-haler; (iii) unexplained lapses of time, e.g. later that day; (iv) overzealous expressions, e.g. I swear to God, and (v) rationalization of an action, e.g. I was unfamiliar with the road.
(2) Preference for negative expressions in word choice, syntactic structure and semantics. This class comprises three indicators: (i) negative forms, either complete words such as never or negative morphemes as in inconceivable;i (ii) nega-tive emotions, e.g. I was a nervous wreck; (iii) memory loss, e.g. I forget.
Once we completed the feature annotation, we ran the annotated data through our system, which automatically discriminates between deceptive and truthful statements based on the density of features contained in each proposition in the data.
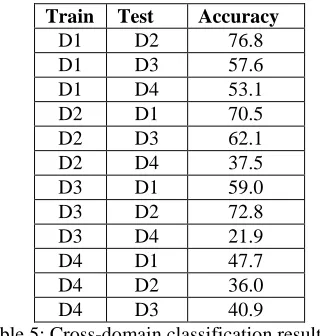
With the scores obtained from the system, we trained a Naïve Bayes classifier on within each domain, using 10-fold cross validation, as well as training using each domain and testing on each of the others. Table 4 shows within-domain accuracy rates, Table 5 cross-domain accuracy.
[image:4.612.341.501.152.320.2]D1 68.2 D2 75.2 D3 59.0 D4 81.3
Table 4. Within domain accuracy (%) testing on features
The within-domain accuracy for D4 is startling until we consider that there were 32 verifiable claims, only one of which was false. Of more cern is the fact that the narrative effectively con-ceals a crime.
Train Test Accuracy
D1 D2 76.8
D1 D3 57.6
D1 D4 53.1
D2 D1 70.5
D2 D3 62.1
D2 D4 37.5
D3 D1 59.0
D3 D2 72.8
D3 D4 21.9
D4 D1 47.7
D4 D2 36.0
D4 D3 40.9
Table 5: Cross-domain classification results on features using a Naïve Bayes classifier (%)
While the review data (D3) is an outlier in the classification results, we attribute this, at least par-tially, to the system’s dictionary, which was creat-ed for criminal data. The results for D4, on the oth-er hand, are markedly below those of D3.
A NB classifier training and testing on uni-grams (shown in Table 6), also shows the reviews as an outlier, as well as D4 as an extreme outlier.
However, the better results among the domains when features are used suggest that an attempt to incorporate the three domains into a corpus for verbal deception detection testing would be rea-sonable.
Train Test Accuracy
D1 D2 67.2
D1 D3 47.5
D1 D4 23.0
D2 D1 68,2
D2 D3 45.0
D2 D4 22.9
D3 D1 52.3
D3 D2 58.4
D3 D4 23.9
D4 D1 50.0
D4 D2 31.2
D4 D3 50.0
5
Conclusion
In this paper we tested a simple distance metric, out-of-rank classification, to see if we could esti-mate the feasibility of building a T/F classification system for new a domain before the claims in the domain were verified. Through n-gram analysis on four domains with varying characteristics, we showed one of the domains, D4, to be an outlier with surprisingly little variation within the narra-tive. This result would have helped us avoid the expensive task of annotating D4 for ground truth only to discover that it had no verbally identifiable lies. While we currently do not have an explana-tion for the correlaexplana-tion between the absence of ver-bal deception in D4 and its outlier status, we plan to further analyze the differences between the lan-guage of D1-D3 and D4 for clues to the case of de-ception by omission, which D4 serves as a good model.
In addition, after training and testing interalia for D1-D3, we suggested that it would be reasona-ble to incorporate them as part of a single corpus. We hope the direction we have taken here to esti-mate the feasibility of including a new domain into a corpus with established ground truth will aid in the development of a common data set that would enable the development of a shared task in the computational detection of verbal deception.
Acknowledgements
We would like to thank Michael Schonwetter of Deception Discovery Technologies (DDTech) for development of the automatic tagging and scoring system used in this study, and the workshop re-viewers for valuable suggestions and advice.
References
Joan Bachenko, Eileen Fitzpatrick and Michael Schonwetter. 2008. Verification and implementation of language-based deception indicators in civil and criminal narratives. In Proceedings of the 22nd Inter-national Conference on Computational Linguistics-Volume 1 (pp. 41-48). CoLing.
William B. Cavnar and John M. Trenkle. 1994. N-gram-based text categorization. In Proceedings of the Third Annual Symposium on Document Analysis and In-formation Retrieval. pp.161-175.
David F. Larcker and Anastasia A. Zakolyukina. 2012. Detecting deceptive discussions in conference calls.
Journal of Accounting Research, 50(2), pp.495-540. Song Feng, Ritwik Banerjee, and Yejin Choi. 2012.
Syntactic stylometry for deception detection. In Pro-ceedings of the 50th Annual Meeting of the Associa-tion for ComputaAssocia-tional Linguistics: Short Papers-Volume 2 (pp. 171-175).
Vanessa W. Feng and Graeme Hirst. 2013. Detecting Deceptive Opinions with Profile Compatibility. Pro-ceedings of the Sixth International Joint Conference on Natural Langauge Processing.
Tommaso Fornaciari and Massimo Poesio. 2011. Lexi-cal vs. surface features in deceptive language analy-sis. In Proceedings of the 13th International Confer-ence on Artificial IntelligConfer-ence and Law, (pp. 2-8). Tommaso Fornaciari and Massimo Poesio. 2014.
Identi-fying fake Amazon reviews as learning from crowds. In Proceedings of the 14th Conference of the Euro-pean Chapter of the Association for Computational Linguistics, (pp. 279-287).
Donato Hernandez Fusilier, Manuel Montes-y-Gómez, Paolo Rosso and Rafael Guzman Cabrera. 2015. De-tecting positive and negative deceptive opinions us-ing PU-learnus-ing. Information Processing & Man-agement, 51(4), pp.433-443.
Rada Mihalcea and Carlo Strapparava. 2009. The lie de-tector: Explorations in the automatic recognition of deceptive language. In Proceedings of the Associa-tion for ComputaAssocia-tional Linguistics – InternaAssocia-tional Joint Conference on Natural Language Processing Conference Short Papers (pp. 309-312).
Matthew L. Newman, James W. Pennebaker, Diane S. Berry, and Jane M. Richards. 2003. Lying words: Predicting deception from linguistic styles. Personal-ity and Social Psychology Bulletin, 29(5), pp.665-675.
Myle Ott, Yejin Choi, Claire Cardie, and Jeffrey T. Han-cock. 2011. Finding deceptive opinion spam by any stretch of the imagination. In Proceedings of the 49th Annual Meeting of the Association for Computational Linguistics: Human Language Technologies-Volume 1 (pp. 309-319).
of the 2013 Conference of the North American Chap-ter of the Association for Computational Linguistics: Human Language Technologies (pp. 497-501). Lina Zhou, Judee K. Burgoon, Jay F. Nunamaker, Jr.
and Doug Twitchell. 2004. Automating linguistics-based cues for detecting deception in text-linguistics-based asynchronous computer-mediated communications. Group Decision and Negotiation, 13(1), 81-106.