DEVELOPMENT OF MOLECULAR DIAGNOSIS METHOD FOR
IDENTIFICATION OF HCV USING LAMP AND RT-PCR
TECHNIQUES
Nawras Helal Jasim*
Department of Microbiology, Osmania University, Hyderabad-500007.
ABSTRACT
Hepatitis C is blood-borne viral disease worldwide. Chronic hepatitis
C infection leads to cirrhosis of the liver, liver failure and liver cancer.
Antiviral therapy exists and approximately 50% of infected individuals
can be cured.The importance of low cost molecular diagnostic assays
are especially important for the developing nations as they are already
burdened with increasing number of hepatitis C patients who are
generally economically backward. The aim of this thesis was to
analyze blood samples using molecular technique like q-PCR and
LAMP. Out of twenty samples analyzed q-RTPCR, twenty samples
were positive and other twenty samples showed negative. In summary
we have shown that LAMP is a rapid sensitive and specific method for
detecting HCV in settings where real time PCR machine may not be available. The only
limitation of the study is that we have used only ten clinically infected samples to compare
with ten negative controls.
KEY WORDS: HCV, LAMP, RT-PCR and Molecular Diagnosis.
1. INTRODUCTION
Hepatitis C virus (HCV) infection is a global health problem which has affected around 170
million people worldwide and is one of the major causes of deaths related to liver cirrhosis
and hepatocellular carcinoma.[1] HCV can be classified to seven major genotypes and 80 subtypes.[2-4] HCV genotypes vary in patterns of geographical distribution and therapeutic response. However, the geographical and genetic diversity of this RNA virus is constantly
evolving because of rapid globalization. In India, HCV infection has been reported in
0%-Volume 4, Issue 12, 919-930. Research Article ISSN 2277– 7105
*Correspondence for
Author
Nawras Helal Jasim
Department of
Microbiology, Osmania
University, Hyderabad-
500007.
Article Received on 06 Oct. 2015,
is mostly transmitted through transfusion of blood or blood products. A high prevalence of
HCV is found in many high-risk groups (HRG) exposed to blood or blood products like intra
venous drug users (IDUs), patients with pediatric hematologic malignancies and those with
thalassemia and hemophilia. India reported a higher percentage of blood donors (1%-1.5%)
than in any developed country.[5] The importance of low cost molecular diagnostic assays are especially important for the developing nations as they are already burdened with increasing
number of hepatitis C patients who are generally economically backward. The advent of
molecular diagnostic approaches has allowed for the development of nucleic acid assays that
are more sensitive and specific than antibody based technologies. The linking of these assays
with appropriate detection systems, therefore, makes them highly desirable for detecting
HCV RNA in patient samples. Molecular techniques not only help to detect HCV RNA but
confirm active state of infection, i.e., the virus is in replicating state in the patient’s body. In
individuals falling in high risk diagnosis of HCV can give false negative results as these
patients are already immuno-suppressed, in this scenario, molecular testing remains the best
choice for detection. Molecular diagnostic assays are an integral part in the management of
HCV patients. Both qualitative and quantitative HCV molecular assays are used in the
diagnosis of acute and chronic infection. The principle of qualitative HCV assays includes
viral RNA isolation, complementary DNA (cDNA) synthesis, PCR amplification and
detection of PCR amplicons. Qualitative HCV RNA test detects the presence of HCV
circulating in the blood and is among the most sensitive tests available. Since HCV is a RNA
virus, reverse transcription PCR is used to detect viral RNA. The viral genome is 9.6kb long,
contains a single open reading frame that is translated to produce a single protein product,
which is then further processed to produce functional proteins for viral replication and
propagation. At the 5’ and 3’ ends of the viral RNA are the untranslated region (UTR) that
are not translated into proteins but are important to translation and replication of the viral
RNA. Most of the commercial and in-house PCR amplification strategies are targeted against
the 5’ UTR region as there is more than 90% sequence identity among different HCV
genotypes, with some segments nearly identical among different strains.[6] The secondary and tertiary structures of this region are also largely conserved and this is one of the first regions
which is transcribed of the first regions which is transcribed. Other than the 5’ UTR region, the core and the 3’ UTR region are also targeted for PCR based detection of HCV. A recent
study showed that detection based on the sequence of the core region could reliably identify
subtypes as well as major genotypes since the sequence divergence was greater than the
which can be used as detection targets for PCR amplification but they are not in much use as
there is a lack of conservation in the primer binding sites.[7-9]
2. MATERIALS AND METHODS
2.1. Sample and methodology used for the study
Blood samples from 10 HCV positive patients and blood samples from 10 HCV negative
subjects.
2.2. Extraction of plasma from blood
Whole blood was collected into commercially available anticoagulant-treated EDTA-treated
(lavender tops). Cells are removed from plasma by centrifugation for 10 minutes at
1,000-2,000 x g using a refrigerated centrifuge. Centrifugation for 15 minutes at 1,000-2,000 x g depletes
platelets in the plasma sample.
The resulting supernatant is designated plasma. Following centrifugation, it is important to
immediately transfer the liquid component (plasma) into a clean polypropylene tube using a
Pasteur pipette. The samples were maintained at 2-8°C while handling. The plasma was
apportioned into 0.5 ml aliquots, and stored, at –20°C until ten samples were collected. It is
important to avoid freeze-thaw cycles. Samples which are hemolyzed, icteric, or lipemic can
invalidate certain tests.
2.3. Extraction of RNA from plasma
To nuclease-free 1.5 ml microcentrifuge tubes: 200µl plasma from each of the twenty
collected samples was added. 200 µl working solution, freshly prepared (carrier
RNA-supplemented Binding Buffer) was added to it followed by 50 µl Proteinase K solution; and
mixed immediately. It was incubated for 10 min at +72°C. 100 µl of Binding Buffer and
mixed well. One High Pure Filter Tube was inserted into a Collection Tube and the entire
sample was pipetted into the upper reservoir of the Filter Tube. The entire High Pure Filter
Tube assembly was inserted into a standard table-top centrifuge and centrifuged for 1 min at
8,000 × g. After centrifugation the Filter Tube was removed from the Collection Tube; the
flow through was discarded along with the Collection Tube. A new Collection Tube was kept
underneath and 500 µ l Inhibitor Removal Buffer was added to the upper reservoir of the
Filter Tube and centrifuged for 1 min at 8,000 × g. After centrifugation the Filter Tube was
Tube discarded. A new Collection Tube was kept. 450 µl Wash Buffer was added to the
upper reservoir of the Filter Tube and centrifuged for 1 min at 8,000 × g and the flowthrough
was discarded. After the first wash and centrifugation: the flowthrough and the Collection
Tube was discarded A new Collection Tube was kept and 450 µl Wash Buffer was added to
the upper reservoir of the Filter Tube and centrifuged for 1 min at 8,000 × g and the flow
through was discarded .The Filter Tube-Collection Tube assembly was spun it for 10 s at
maximum speed (approx. 13,000 × g) to remove any residual Wash Buffer. The extra
centrifugation time ensures removal of residual Wash Buffer. The Collection Tube was
discarded and the Filter Tube was inserted into a nuclease free, sterile 1.5 ml microcentrifuge
tube. To elute the viral nucleic acids: 50 µl Elution Buffer was added to the upper reservoir
of the Filter Tube and centrifuged for 1 min at 8,000 × g. The microcentrifuge tube contains
the eluted, purified viral nucleic acids. The eluted nucleic acids was directly used in PCR (10
– 20 µl DNA eluate) or RT-PCR (3.5 µl viral RNA).
2.4. Real time PCR method
Make sure that the tubes for standards & at least one negative control (Water, PCR grade) are
included per PCR run. To generate a standard curve, all supplied Standards (HCV S 1-5)
were used for each PCR run. Before each use, all reagents need to be thawed completely and
mixed (by pipetting or by brief vortexing). Depending upon the number of samples a mix can
be prepared as follows.
Pipette 10 µl of the Master Mix into each labeled PCR tube. Then add 15 µl of the earlier
extracted RNA to each sample tube and mix well by pipetting up and down.
Correspondingly, 15 µl of the Standards (HCV S1-5) must be used as a positive control and
15 µl of water (Water, PCR grade) as a negative control. Close the PCR tubes and transfer
the same into real time PCR instrument.
2.5 Thermal profile
1.50 º c-15s
2.95 º c-10 min
3.95 º c-10 s
4.55 ºc -20 s
5.72 º c-10 s
steps 3-5 were repeated for 45 cycles.\
2.6. LAMP PCR
The HCV detection is based on the amplification of a single-copy 5' UTR sequence by
means of the Reverse Transcription Polymerase Chain Reaction (RT-PCR) and for
measuring of the amplification product concentration growth in the course of the PCR by
means of the fluorescence marked probe (real-time PCR).
2.7. Primer Design for LAMP Reaction: The oligonucleotide primers used for LAMP amplification of HCV were designed from 5` UTR region sequences. A set of six primers
(two outer, two inner, and two loops) were designed using primer explorer software.
However, we did not use loop primers in our experiment.
F3 5` -TCTTGGGAGAGCCATAGTG-3`
B3 5` -CATAAGCAAGCACCCTATCAG-3`
FIP-5` -GATCCAAGAAAGGACCCGGTTCGTTCCGGAACCGGTGAGTAC-3`
BIP 5` -CCTGGAGATTTGGGCGTGCTTTTAGTAGGGTTAGGGCCTTTCGC-3`
The LAMP reaction was carried out in a 25 ul reaction mixture composed of
1.6 M each of FIP and BIP,
0.2 M each of F3 and B3,
2.5 ulLThermopol buffer (20 mMTris-HCl (pH 8.8), 10 mMKCl, 10 mM (NH4)2SO4, 9 mM
MgSO4 and 0.1 % Triton X-100),
1.4 mMdeoxynucleoside triphosphate mix,
1 M Betaine (Sigma-Aldrich, St. Louis, MO, USA),
3 µl of target cDNA, and distilled water.
The mixtures were heated to 95º C for 5 min, and then chilled on ice prior to addition of 8 U
of Bst DNA polymerase large fragment (New England Biolabs). Immediately after addition
of the polymerase, the mixture was incubated at 62 º C for 70 min in a heating block (SBH
130D; Stuart Scientific, Staffordshire, UK) and then heated at 80 º C for 10 min to terminate
the reaction. Samples which the copy numbers of virus RNA had previously been quantified
by real-time PCR were used as positive controls. LAMP products were subjected to 2 %
Figure 1: LAMP amplicons run on a 2% agarose gel
In addition, 1 ul of SYBR Green I (Invitrogen lot: 49743A) diluted 1:10 was added directly
to the LAMP products. The solution turned green if LAMP reaction products were present,
otherwise it remained orange; coloration was evaluated under natural light and UV light (302
[image:6.595.145.450.379.526.2]nm; via handheld UV torch lamp)
Figure 2: LAMP results when viewed under naked eye
[image:6.595.142.452.568.728.2]3. RESULTS AND DISCUSSION
3.1. Sample collection, RT-PCR and LAMP
Blood was collected from ten HCV infected subjects in EDTA vacutainers along with ten
blood samples from healthy volunteers who were free of HCV infection.These ten
individuals were outpatients to GYD clinic, Hyderabad.
The RNA was extracted from each sample as described in Methods.The RNA was subjected
to RT-PCR using Genosens HCV quantification kit.The same samples were subjected to
LAMP using primers designed for HCV.The samples were incubated at 62 º c for one hour in
a waterbath set to 62º c.Thereafter the picogreen was added to each tube to visually observe
the colour change as well observed under the uv light.All ten samples except one showed
fluorescence.
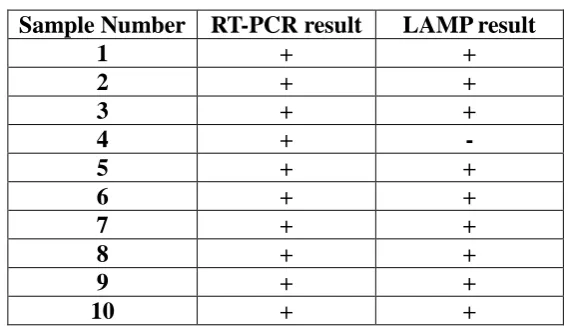
Table 1: Patient blood samples showing positive to q--PCR amplificationresult. Sample Number RT-PCR result LAMP result
1 + +
2 + +
3 + +
4 + -
5 + +
6 + +
7 + +
8 + +
9 + +
[image:7.595.154.440.334.497.2]10 + +
Table 2: Patient blood samples showing Negative to q-PCR amplificationresults. Sample Number RT-PCR result LAMP result
1 - -
2 - -
3 - -
4 - -
5 - -
6 - -
7 - -
8 - -
9 - -
10 - -
HCV quantitative assay is used to determine the number of international units of HCV RNA
per millimeter of serum or plasma (IU/mL) in known HCV positive patients. Recently, real
detection method of choice by many clinicians. The advantages of this technique are that
they have a very low limit of detection, have a broad dynamic range. Several companies now
market the real time PCR assays: the COBASs Ampliprep/CobasTaqMan assay (CAP/CTM,
Roche Molecular Diagnostics) and the real-time HCV assay (also named AccuGenes HCV,
Abbott Molecular Inc., Des Plaines, IL, United States). These assays have the advantage of
having a broad dynamic range of amplification, thus improving the limits of detection (LOD)
to 10 IU/mL, and linear quantification up to 107 -108 IU/mL.[10] The quantitation of HCV viral RNA in CobasAmplicor is performed using the HCV Quantitation .Standard. The HCV
quantitation standard is a noninfectious armoured RNA construct of HCV sequences with
identical primer binding sites as the HCV RNA target and a unique probe binding region that
allows HCV Quantitation Standard amplicon to be distinguished from HCV target amplicon.
The HCV Quantitation Standard is pipetted into each individual sample and control at a
known copy number and is and is then amplified by PCR. The COBAS TaqMan HCV Test,
v2.0 uses reverse transcription and PCR amplification primers against the highly conserved
5’ untranslated region of the HCV genome.[11]
. The Versant HCV quantitative test (Siemens
Healthcare Diagnostics) which is HCV RNA assay based on signal amplification by
branched DNA (bDNA). In this assay, single stranded DNA molecules are present; which
acts as probe DNA molecules. Next an extender DNA molecule is added. Once the capture
and extender molecules are in their proper place they are hybridized and the sample is added.
The bDNA assay version 3.0 has been reported to have a lower detection limit of 615 IU/mL
to 8 million IU/mL whatever the HCV genotype.[12]. The advantage of RT-PCR is that it allows continuous monitoring of amplicon kinetics during the exponential phase before the
amplification reaches its plateau. This allows for a good correlation between the initial
numbers of template copies whereas in qualitative assays based on PCR, amplicon detection
was at the end.[13] Thus the use of quantitation techniques have greatly enhanced the sensitivity and reliability in detection techniques.
Real-time PCR allows continuous monitoring of amplicon synthesis early during the reaction
when amplification kinetics is exponential and before amplified product concentration
reaches a plateau. This allows a good correlation between the initial number of template
copies and the number of PCR cycles needed to detect amplified products, therefore leading
to an accurate quantitation.
This constitutes a major difference with current RT-PCR for which amplicon detection and
quantitation are performed at the end of the PCR, where determination of high RNA levels
requires sample dilutions.[14] Another advantage is that the presence of polymerase inhibitors which induce underestimation of RNA concentrations, could be detected byreal-time PCR.
Indeed, measurement of fluorescence after each elongation step during the exponential phase,
allows calculation of the slope of the amplification curve. This slope is a direct function of
the amplification efficiency and can therefore be used as an indicator of the presence of
inhibitors.
The diagnosis of HCV infection depends mainly on detecting circulating antibodies to this
virus, EIA 2.0 detects anti-HCV in approximately 90% of cases.[15] The
third-generation EIA 3.0 is more sensitive than EIA2.0 and the predictive positive values are 0.52
versus 0.23.[16]EIA 3.0 detects antibody earlier in the course of infection[17], five to six weeks
after the onset of hepatitis in 80% of patients.
Some limitations have been observed with EIA tests in that they could not differentiate among
acute, chronic and past infection. In some acute cases there could be a long interval before
seroconversion. In low risk groups such as blood donors, even the
[image:9.595.143.459.574.729.2]third-generation EIAS produce false positive results.
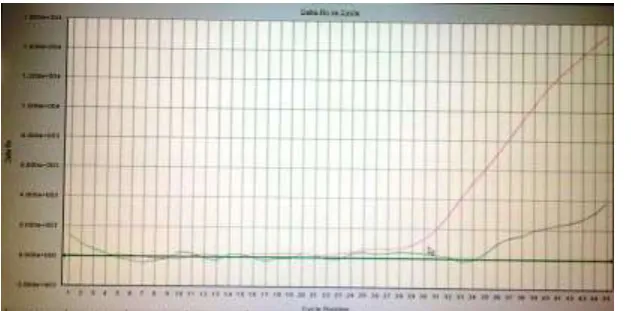
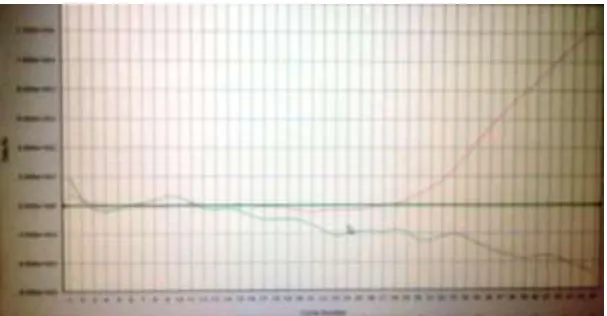
Figure 6: Amplification plot of a control sample from a healthy volunteer showing no amplification of the HCV virus. The red line shows amplification has taken place for the internal control.
Figure 7: Ten tubes showing positive amplification in all except one
HCVRNA could be detected many weeks before the appearance of anti-HCV and in some
cases this may be the only evidence of HCV infection. Nested PCR is the most sensitive
technique for the detection of HCVRNA. Primers specific for 5′ untranslated region (UTR) are
the most sensitive because this region is highly conserved.[18] Detection of hepatitis C virus RNA by a two-stage polymerase chain reaction with two pairs of primers deduced from
5′-noncoding region.[19]
Antigen and nucleic acid amplification tests (NATs) allow for direct viral detection and have
been shown to reduce the WP for detection of HCV infection by up to 60 days. Due to high
cost of NAT methods pooled samples (10–96 per pool)[20] are used for donor screening in many of the developed countries. Due to the pooling, the samples are diluted, leading to
cases where pre-seroconversion donations were negative by both Ab testing and pooled PCR
D. However, the failure to find HCV RNA in all clinical sera by these assays in this study
may be due to the low level of RNA resulting from spontaneous viral clearance. Owing to its
[image:10.595.110.488.311.406.2]diagnosing acute infection and screening blood donations for HCV infection, especially
under conditions where sophisticated and expensive equipment are rarely available.
4. CONCLUSION
In conclusion we have shown that LAMP is a rapid sensitive and specific method for
detecting HCV in settings where real time PCR machine may not be available. The only
limitation of the study is that we have used only ten clinically infected samples to compare
with ten negative controls.
5. REFERENCES
1. Remis, R., R. Hogg, and M.D. Krahn, Estimating the number of blood
transfusionrecipients infected by hepatitis C virus in Canada, 1960-85 and 1990 - 92.
Report to Health Canada. 1998.
2. Remis, R., A study to characterize the epidemiology of Hepatitis C infection in Canada,
2002. Final Report for Hepatitis C Division, Centre for Infectious Disease Prevention and
Control, Population and Public Health Branch, Health Canada. 2002.
3. Wang, P., et al., Indications for interferon/ribavirin therapy in hepatitis C
patients:findings from a survey of Canadian hepatologists. Can J Gastroenterol, 2003;
17(3): 183-6.
4. Backmund, M., et al., Treatment of hepatitis C infection in injection drug
users.Hepatology, 2001; 34(1): 188-93.
5. Sylvestre, D.L., Treating hepatitis C virus infection in active substance users. Clinical
Infectious Diseases, 2005; 40(5): S321-4.
6. Alter, H.J., et al., Transmissible agent in non-A, non-B hepatitis. Lancet, 1978; 1(8062):
459-63.
7. Farci, P. and R.H. Purcell, Clinical significance of hepatitis C virus genotypes
andquasispecies. Seminars in liver disease, 2000; 20(1): 103-26.
8. Simmonds, P., et al., Consensus proposals for a unified system of nomenclature
ofhepatitis C virus genotypes. Hepatology (Baltimore, Md, 2005; 42(4): 962-73.
9. Fried, M.W., et al., Peginterferon alfa-2a plus ribavirin for chronic hepatitis C
virusinfection. N Engl J Med, 2002; 347(13): 975-82.
10. Manns, M.P., et al., Peginterferon alfa-2b plus ribavirin compared with interferon alfa-2b
11. Moradpour, D., F. Penin, and C.M. Rice, Replication of hepatitis C virus. Nature reviews,
2007; 5(6): 453-63.
12. Dubuisson, J., F. Helle, and L. Cocquerel, Early steps of the hepatitis C virus life
cycle.Cellular microbiology, 2008; 10(4): 821-7.
13. Dustin, L.B. and C.M. Rice, Flying under the radar: the immunobiology of hepatitis
C.Annual review of immunology, 2007; 25: 71-99.
14. Yea, C., et al., Monitoring of hepatitis C virus quasispecies in chronic infection
bymatrix-assisted laser desorption ionization-time of flight mass spectrometry mutation detection.
Journal of clinical microbiology, 2007; 45(3): 1053-7.
15. Hepatitis C: global prevalence. Releveepidemiologiquehebdomadaire / Sectiond'hygiene
du Secretariat de la Societe des Nations = Weekly epidemiological record / Health
Section of the Secretariat of the League of Nations, 1997; 72(46): 341-4.
16. Armstrong, G.L., et al., The prevalence of hepatitis C virus infection in the United States,
1999 through 2002.[see comment][summary for patients in Ann Intern Med. 2006 May
16;144(10):I20; PMID: 16702583]. Annals of Internal Medicine, 2006; 144(10): 705-14.
17. Hepatitis C. Releveepidemiologiquehebdomadaire / Section d'hygiene du Secretariat
delaSociete des Nations = Weekly epidemiological record / Health Section of the
Secretariat of the League of Nations, 1997; 72(10): 65-9.
18. Hepatitis C--global prevalence (update). Releveepidemiologiquehebdomadaire /Section
d'hygiene du Secretariat de la Societe des Nations = Weekly epidemiological record /
Health Section of the Secretariat of the League of Nations, 1999; 74(49): 425-7.
19. Hepatitis C--global prevalence (update). Releveepidemiologiquehebdomadaire /Section
d'hygiene du Secretariat de la Societe des Nations = Weekly epidemiological record /
Health Section of the Secretariat of the League of Nations, 2000; 75(3): 18-9.
20. Zou, S., L. Forrester, and A. Giulivi, Hepatitis C update. Can J Public Health, 2003;