1
ELAN - Instituut voor Lerarenopleiding en
Professionele Docentontwikkeling
Identifying and Adressing
Common Programming
Misconceptions with
Variables
—Part IIir. Rifca M. Peters Master Thesis December 11, 2018
Abstract
Imperative programming is considered an important, fun, but also difficult topic of computer science education. It requires learners to develop new ways of thinking and learn new concepts. Problems arise when a concept is not understood well, while progress relays on it. For example, consider variables—one of the basic build-ing blocks of programmbuild-ing—, when this concept is not understood it becomes almost impossible to grasp data manipulation. In preceding work (Plass, 2015) we identi-fied common misconceptions about variables and reported their origin as well as a test to assess existing misconceptions for individual students.
In this report we present and evaluate a interactive video instruction designed to address identified misconceptions. We developed an active, goal-oriented inter-vention based on a constructivist approach; gradually constructing correct under-standing of variables in imperative programming. In a paper-cut stop-motion anima-tion a few lines of code are traces, a voice-over explained what happens while the changes in values are visualized. We evaluated the video with students enrolled in an introductory programming course in secondary education. Misconceptions about variables held by students were assessed before and after watching the video. After-wards students made less errors, indicating that correct understanding of variables was improved. A major decline was visible for the misconception, originating from mathematics, that statements such asy = x + 20denote an equation to be solved. Instead, students showed improved understanding of the meaning of the=symbol
and the structure of an assignment statement.
Although further research with a different population and a control group is needed, the current results provide strong indications that the interactive video successfully addressed specific misconceptions about variables held by students.
Contents
Abstract iii
1 Introduction 1
2 Background & Related Work 3
2.1 Computer Science Education . . . 3
2.1.1 Computer Science Teaching Methods . . . 3
2.1.2 Constructivism in Computer Science Education . . . 4
2.2 Misconceptions about Variables . . . 5
2.2.1 Identified Misconceptions . . . 5
2.2.2 Assessing Misconceptions . . . 7
2.3 Video Instruction . . . 10
3 Intervention 13 3.1 Learning Objectives . . . 14
3.2 Instruction Material Design . . . 16
3.2.1 Adherence to Guidelines . . . 17
4 Method 19 4.1 Participants . . . 19
4.2 Materials . . . 20
4.3 Procedure . . . 21
4.4 Measures . . . 22
4.4.1 Recoding . . . 22
4.4.2 Transformation . . . 25
4.5 Data analysis . . . 27
5 Results 29 5.1 Frequencies . . . 29
5.2 Data Analysis . . . 30
5.2.1 Overall Learning Effect . . . 30
5.2.2 Effectiveness in Addressing Misconceptions . . . 33
5.2.3 Effectiveness in Instructing Learning Goals . . . 34
5.2.4 Interaction Effects . . . 35
6 Discussion 37 6.1 Learning Effect of Interactive Video . . . 38
6.1.1 Instructing Correct Understanding . . . 39
6.1.2 Addressing Misconceptions . . . 42
6.1.3 Interaction Effects . . . 46
6.2 Limitations . . . 48
7 Conclusion and Recommendations 51 7.1 Conclusions . . . 51
7.2 Recommendations . . . 52
References . . . 55
Appendices A BMI Assignment (Dutch) 59 A.1 Opdracht: BMI-Calculator . . . 59
A.2 BMI Correction Model (Visual Basic) . . . 61
A.3 Student’s Code . . . 62
B Visual Basic Tests (Dutch) 63 B.1 Pre-test . . . 63
B.2 Post-test . . . 69
C Interactive Video 75 C.1 Script (Dutch) . . . 75
C.2 Program Code (Visual Basic) . . . 78
C.3 Instruction (Dutch) . . . 79
D Data 81 D.1 Raw Data . . . 81
Chapter 1
Introduction
Imperative programming is a mandatory subject in the computer science curricu-lum at secondary education in the Netherlands (Schmidt, 2007; Tolboom, Kruger, & Grgurina, 2014). Moreover, programming can be a tool to develop 21st-century
skills (McComas, 2014) such as problem solving, collaborating, and media literacy
(Thijs, Fisser, & van der Hoeven, 2014). However, programming is also a difficult skill to learn because it requires a new way of thinking, being able to generalize and abstract (van Diepen, 2014).
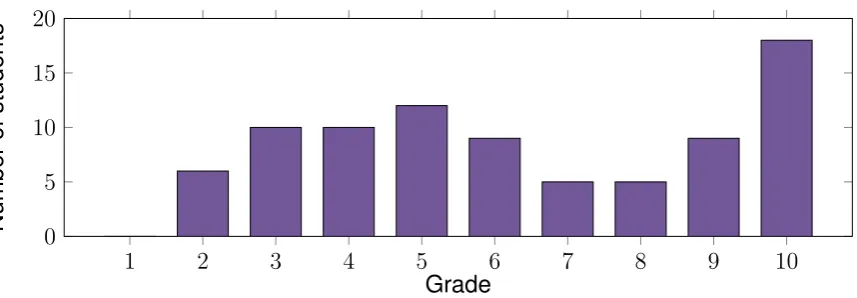
A division may arise between learners thatdoanddo not ‘get it’. This is reflected
in student grades that follow a bimodal distribution where most students score ei-ther below or above the expected average grade (Figure 1.1). Some may believe that students who score below the average have limited programming capabilities, leading to student drop-out (Robins, Rountree, & Rountree, 2003) or even teachers advising a student to do so. Dehnadi and Bornat (Dehnadi & Bornat, 2006) reported this as the “camel hump” and advocated the existence of a simple programming ap-titude test dividing programmers from non-programmers. However, this work was retracted because evidence was lacking for the predictive value for performance (Bornat, 2014; Ferguson, 2014). An alternative cause of the bimodal can be sought
in the learned edge momentum (LEM). The LEM effect states that if subsequent
topics in a course are dependent on previous topics, students who grasp the first topic are more likely to grasp the second, and those who do not grasp the first topic are less likely to grasp the second, and therefore less likely to grasp the third, and so on (Robins, 2010). This highlights the importance of good basic understanding to avoid increasing knowledge gaps between students over time. Nevertheless, the variation in students’ expertise levels make it difficult to design course materials and processes that are challenging and interesting for all students (Lahtinen, Ala-Mutka, & J¨arvinen, 2005). Moreover, teachers and course creators must be aware of the issues that hinder learning progress before they can create materials to overcome them (Herman, Kaczmarczyk, Loui, & Zilles, 2008).
1 2 3 4 5 6 7 8 9 10 0
5 10 15 20
Grade
Number
of
[image:8.595.76.505.85.234.2]students
Figure 1.1: bi-modal grade distribution for an introductory course Java programming (HAVO 4, Ludger College, Doetinchem, the Netherlands, 2010-2014)
A short reflecting upon currently available programming lesson materials for sec-ondary education discovers that these provide many exercises, but provide little in-struction. This encourages “trial-and-error” practises rather than deep understand-ing. Moreover, even when provided with comparable, working examples students are not capable of doing the exercises, let alone understand the written code. Stu-dents' struggles with programming have been observed in their course work, such as the BMI-calculator assignment (Appendix A). This assignment was designed to assess understanding of different programming constructs. The majority of students displayed poor understanding of the basic construct of variables. For example, stu-dents did not convert data correctly to the appropriate type, were unaware of the value of variables at specific moment, and did not use variables whenever oppor-tune (see Appendix A, Section A.3).
In collaborative work, misconceptions about variables in imperative programming amongst younger, novice programmers have been further investigated. In earlier work Plass (2015) presented identified misconceptions and our tests developed to assess misconceptions held by students. In the present work, I describe the material designed to instruct correct understanding about variables. Further, I report on the empirical study done to evaluate the effectiveness of this material.
Chapter 2
Background & Related Work
The aim of the present work is to develop an intervention —in the form of an interac-tive video— teaching correct understanding of variables to novice programmers. In this section we report existing knowledge on three important aspects: current state of programming education, misconceptions about variables, and video instructions. This information serves as the foundation for the design of our instruction material.
2.1 Computer Science Education
Programming is a mandatory subject of the computer science curriculum at sec-ondary education in the Netherlands1 However, programming is considered a hard
subject nonetheless due to the abstract concepts (van Diepen, 2014; Kuittinen & Sajaniemi, 2004). Analogies, such as the container or “box”, used to explain these concepts may lead to misconceptions. For example, moving instead of copying a value, and the ability to contain multiple items (Smith, DiSessa, & Roschelle, 1993).
2.1.1 Computer Science Teaching Methods
In the Netherlands are three dominating, published computer science teaching meth-ods (Tolboom et al., 2014), Enigma, Fundament Informatica (Instruct) and Informatica-Actief. Although programming is mandatory, Stichting Enigma Online (2013) is the only method offering a full introductory (Java) programming course in their main cur-riculum. Instruct (2018) included “concept functions” in their main curriculum and offers supplementary programming modules. INFORMATICA-Actief (2015) included algorithms in their main course. Alternatively, teachers develop their own program-ming courses (e.g., Programprogram-ming in Delphi (Heijmeriks, 2007)).
1Subdomein B3: Software 7. De kandidaat beheerst eenvoudige datatypen,
programmastruc-turen en programmeertechnieken.
These methods have in common that they tend to focus on procedural rather than conceptual knowledge. Students have to ‘write’ a full application following step-wise instructions2or examples, without having mental models of how this functions.
For example, Enigma’s Java and the Delphi course instruct OO-programming using a WYSIWYG-editor. Meaning that students create application windows using a vi-sual editor, and then write a few lines of code to add functionality to a button. In this process, variables are used without proper instruction of their function and be-haviour. The methods provide examples of the correct syntax for various functional-ity (e.g., retrieve user input, do some calculation, and write the result on screen) and exercises to apply the new bits and pieces. With exception of Informatica-Actief's algorithm module, which does focus on programming concepts rather than writing syntax. The method uses a visualiser to show the effect of changes applied to vari-ables, loops and subtasks outside a language specific environment.
2.1.2 Constructivism in Computer Science Education
Constructivism is a theory of learning claiming that students actively construct knowl-edge rather than passively receive and store knowlknowl-edge presented by a teacher or book (Ben-Ari, 1998). This approach is based on the view of Piaget and Vygotskys (1987), stating that humans construct meaning in the interaction between their expe-riences and their ideas. Related is Vygotsky’s (1980) theory on the zone of proximal development (ZPD), which marks the difference between what a learner can do without help and what they cannot do. It is believed that experiences in the ZPD en-courage and advance learning. Meaning that the learning process should be tailored to the learner’s prior knowledge and experiences. Key elements are that knowledge builds upon existing knowledge and that one should focus on understanding of es-sentials rather then learning by heart. A constructivist approach requires advanced instruction skills; a teacher should provide adaptive guidance based on the student’s understanding.
BAri (1998) states that for students with no prior model, the teacher must en-sure that a viable hierarchy of models is constructed; meaning this must be explicitly instructed and discussed. Instruction should not be limited to procedural knowledge (to do x, follow steps 1 to n), and exercises should be delayed until there is a viable model constructed. Premature attempts likely lead to endless “trial-and-error” pro-gramming, which does not facilitate development of expert-like programming skills. Further, one should be aware that autodidactic prior experiences not necessarily correlate with success, they may as well cause firm non-viable models (i.e., miscon-ceptions).
2.2. MISCONCEPTIONS ABOUTVARIABLES 5
The constructivist approach showed to support adoption of deep programming strategies and structures, and is recommended for teaching variables (Kuittinen & Sajaniemi, 2004). Adhering to the constructivist approach, Kuittinen and Sajaniemi (2004) recommend to first introduce constants (named literals), then fixed values (constants set at runtime), and one by one introduce dynamic functions such as the stepper (counting) and transformer (calculation). Each of these different roles of variables should be instructed by a description and concrete examples express-ing the variable purpose and behaviour. Animations can support explainexpress-ing various roles by visualising the past and future values, and show the syntax to access or transform values stored in variables. An active role of the student can further im-prove effectiveness of the animation (Mayer, 1988). Somewhat surprisingly, as de-scribed above, most existing teaching methods in the Netherlands don’t follow these recommendations.
Although a constructivist approach is preferable, learning outcomes highly de-pend on the teachers expertise, skills and commitment. Otherwise, students receiv-ing inadequate guidance and support, risk becomreceiv-ing frustrated and discouraged ulti-mately leading to disengagement and non-adherence (Wilson, 2012). This stresses the importance of high quality, easy to use and well formed (i.e., conforming to the constructive approach) instruction materials to support teachers in their knowledge transfer and student guidance.
2.2 Misconceptions about Variables
Students may hold certain misconceptions about variables. Although misconcep-tions are —according to constructivism— necessary to construct new knowledge (Smith et al., 1993), they need to be identified and transformed to correct concep-tual models in order to facilitate development of programming skills.
2.2.1 Identified Misconceptions
Studies on misconceptions in programming —and about variables in particular— revealed four categories of origin of misconceptions: mathematics, anthropomor-phism, analogy, and semantics.
People learn everyday and build upon previous obtained knowledge. However, sometimes these earlier experience can hinder correct understanding of new con-cepts. Misconceptions about variables can arise from previous experiences in al-gebra where a variable is a letter replacing a value in an equation to be solved
both sides equal, so a value can also be moved from a variable left from the equal-sign to a variable on the right (opposed to asequal-signment in programming that is always only done from right to left). For example,a = 4; b = 3; b = a, can result in either (correctly)a = 4andb = 4, or (incorrectly)a = 3andb = 3.
Inter-human communication experiences can also cause wrong expectations of variables. In everyday communication we learn that contextual information supports correct understanding. Even when being imprecise humans can interpret the
mean-ing of words like smallest. A novice programmer may, erroneously, expect the
computer as well to understand context and intention (Pea, 1986; Pea, Soloway, & Spohrer, 1987).
Another potential source of misconceptions is that of the container analogy; a variable is like a box (Smith et al., 1993; Ben-Ari, 1998). This analogy can help explain that a variable is given a name and can hold a value. However, the analogy may also result in students to think that a variable can contain more than one value, or that a value is removed when assigned to another variable.
Lastly, there have been identified various misunderstandings in the semantics of assignment statements such as assumptions that variables are swapped or added (Ma, Ferguson, Roper, & Wood, 2007).
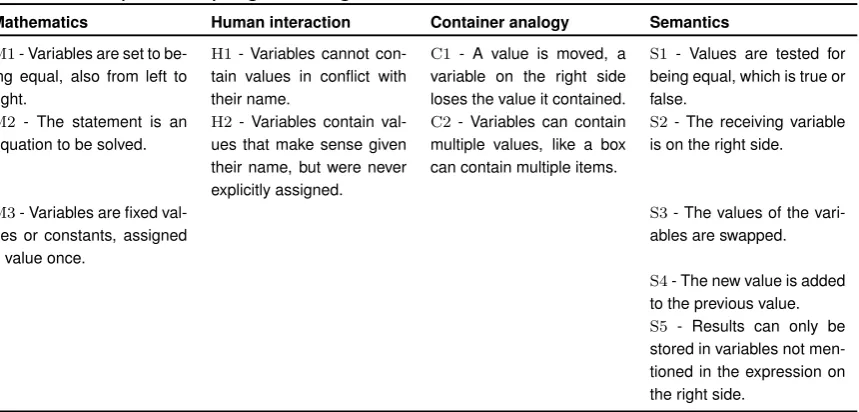
[image:12.595.75.505.498.704.2]In previous work (Plass, 2015) we extensively reported misconceptions identified from literature3. These misconceptions, grouped by origin category, are listed in
Table 2.1.
Table 2.1: Identified misconceptions in variable assignment for primitive types in imperative programming.
Mathematics Human interaction Container analogy Semantics
M1- Variables are set to
be-ing equal, also from left to right.
H1- Variables cannot
con-tain values in conflict with their name.
C1- A value is moved, a
variable on the right side loses the value it contained.
S1 - Values are tested for
being equal, which is true or false.
M2 - The statement is an
equation to be solved.
H2- Variables contain
val-ues that make sense given their name, but were never explicitly assigned.
C2- Variables can contain
multiple values, like a box can contain multiple items.
S2 - The receiving variable
is on the right side.
M3- Variables are fixed
val-ues or constants, assigned a value once.
S3- The values of the
vari-ables are swapped.
S4- The new value is added
to the previous value.
S5 - Results can only be
stored in variables not men-tioned in the expression on the right side.
3Additional misconceptions have been identified from the results of our study. These
2.2. MISCONCEPTIONS ABOUTVARIABLES 7
2.2.2 Assessing Misconceptions
To design reforming instructions, we need to detect mistakes and understand the
underlying non-viable model (Herman et al., 2008). Misconceptions held by students are often assessed with think-aloud protocols and task-based interviews, which give insight into thoughts but also influence thinking. Alternatively, misconceptions can be assessed with a directed test.
Common think-aloud approaches to uncover misconceptions include asking stu-dents to explain what they think happens in particular code segments (Bayman & Mayer, 1983; Kurland & Pea, 1985; Pea et al., 1987), giving small problems with code segments to solve while letting the student think out loud and asking about specific concepts (Kaczmarczyk, Petrick, East, & Herman, 2010), or asking open ended questions (Tew, 2010). Although these approaches may reveal misconcep-tion, they can change the sequence of thinking or slow down the process (Hickman & Monaghan, 1993). A partial solution can be found in the use of a smartpen (e.g., Livescribe4). The pen records writing actions and audio, allowing the student to work
on their normal pace and reflect asynchronous upon their work.
Attempts to develop a formal test assessing students understanding of program-ming concepts —including, but not limited to variables— have been undertaken. In the FCS1 (Tew & Guzdial, 2011) multiple choice test each incorrect answer indi-cates a specific misconception. However, the test contains only three items about variables, and the possible incorrect answers were not constructed from miscon-ceptions but rather created based on guidelines (Miller, Linn, & Gronlund, 2009, pp. 194–217). Moreover, the FCS1, is not available for general use (Taylor et al., 2014). Dehnadi (2006) developed a test focusing on assignment of variables of primitive types. This test consists of multiple choice questions based on code fragments. Answers have been mapped to behavioural mistakes, but not to the misconception underlying these mistakes.
Misconception Assessment Test
Based on the work of Dehnadi (2006), a directed test assessing misconceptions held by a student was developed and presented in Plass (2015), with some alter-ations in construction and interpretation of the answers. Our test use open-ended questions to avoid response bias and because we assumed the list of identified misconceptions to be incomplete. Further, we mapped incorrect answers to identi-fied misconceptions rather than behavioural mistakes because we were interested in the non-viable models underlying the mistake. For all identified misconceptions,
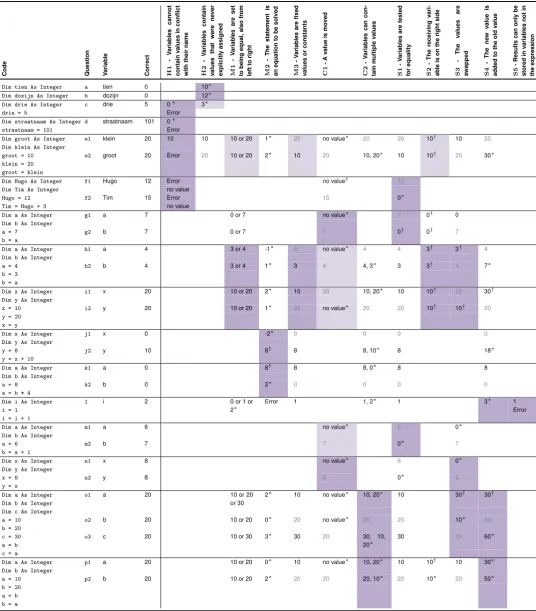
we constructed programming code snippet(s) eliciting certain incorrect responses whenever a student holds a certain misconception. For all programming code snip-pets the student has to answer the values for all variables after execution of the code; predicted incorrect responses have been mapped to misconceptions. The re-sulting assessment test is available in Appendix B, the programming code snippets and questions mapped to misconceptions are given in Table 2.2.
The assessment test was carried out with novice programmers, and showed able to detect misconception H2, M1, M2, S1 S2, and misconception S4. Conversely, no
evidence was found that the test was able to detect misconceptionH1, C1, C2,M3, S3, and misconceptionS5.
Some identified misconceptions were not (C1) or hardly (H1,C2, S3) detected in
the sample (see Appendix D, Section D.2). This may be due to ineffective assess-ment or participants not holding these misconceptions. Though, some identified misconceptions clearly could not be detected by the test due to limitations in the con-structed programming code snippets. First, on the basis of the expected incorrect responses differentiation between misconceptionS1and misconceptionM3was
im-possible. For example, for code snippetpre h,Dim a As Integer; Dim b As Integer;
a = 4; b = 3; b = a, the incorrect response to questionpre h2,b = 3, (combined
with the correct value for pre h1, a = 4) matches the expected values mapped to both misconception S1 and M3 as presented in Table 2.2. In few cases however,
misconception S1 could be uniquely detected by unanticipated responses such as
“Error, not equal”, indicating that the participants believes equality need to be tested. In a similar vein, misconceptionS5elicited the same incorrect responses as
misconception M2, but, unique detection of misconception M2 was possible based
on code snippetspre jandpre k(see Table 2.2).
Further, unanticipated mistakes were observed resulting in identification of addi-tional misconceptions, namely, misconception O1 that the value for one variable is
computed and the other is set to be equal, misconceptionO2 that a known value of
another variable is used when there is no value explicitly assigned, and three sub-implementations of misconceptionM2that a statement is an equation to be solved.
2.2. MISCONCEPTIONS ABOUTVARIABLES 9
Table 2.2: (pre)Test questions mapped to identified misconceptions. Answers that do not differentiate between correct values and misconceptions are not listed, or depicted in grey if they support misconception detection by another question. Coloured cells mark
questions designed to assess the specific misconception. ∗ marks answers uniquely
detecting a misconception. † marks answers that combined with the other questions of
the code snippet detect a misconception. All code and values are for Visual Basic.
Code Question Variab
le Correct H1 -Variab les cannot contain values in conflict with their name H2 -Variab les contain values that were ne ver explicitl y assigned M1 -Variab les are set to being equal, also fr om left to right M2 -The statement is an equation to be solved M3 -Variab les are fix ed values or constants C1 -A value is mo ved C2 -Variab les can con-tain m ultiple values S1 -Variab les are tested for equality S2 -The receiving vari-ab le is on the right side S3 -The values are swapped S4 -The ne w value is ad ded to the old value S5 -Results can onl y be stored in variab les not in the expression
Dim tien As Integer a tien 0 10∗
Dim dozijn As Integer b dozijn 0 12∗
Dim drie As Integer drie = 5
c drie 5 0∗ 3∗
Error
Dim straatnaam As Integer straatnaam = 101
d straatnaam 101 0∗
Error
Dim groot As Integer Dim klein As Integer groot = 10 klein = 20 groot = klein
e1 klein 20 10
Error
10 10 or 20 1∗ 20 no value∗ 20 20 10† 10 20
e2 groot 20 Error 20 10 or 20 2∗ 10 20 10, 20∗ 10 10† 20 30∗
Dim Hugo As Integer Dim Tim As Integer Hugo = 12 Tim = Hugo + 3
f1 Hugo 12 Error
no value
no value† 12
no value
f2 Tim 15 Error 15 0∗
no value
Dim a As Integer Dim b As Integer a = 7
b = a
g1 a 7 0 or 7 no value∗ 7 0† 0
g2 b 7 0 or 7 7 0† 0† 7
Dim a As Integer Dim b As Integer a = 4
b = 3 b = a
h1 a 4 3 or 4 -1∗ 4 no value∗ 4 4 3† 3† 4
h2 b 4 3 or 4 1∗ 3 4 4, 3∗ 3 3† 4 7∗
Dim x As Integer Dim y As Integer x = 10 y = 20 x = y
i1 x 20 10 or 20 2∗ 10 20 10, 20∗ 10 10† 20 30†
i2 y 20 10 or 20 1∗ 20 no value∗ 20 20 10† 10† 20
Dim x As Integer Dim y As Integer y = 8
y = x + 10
j1 x 0 -2∗ 0 0 0 0
j2 y 10 8† 8 8, 10∗ 8 18∗
Dim a As Integer Dim b As Integer a = 8
a = b * 4
k1 a 0 8† 8 8, 0∗ 8 8
k2 b 0 2∗ 0 0 0 0
Dim i As Integer i = 1
i = i + 1
l i 2 0 or 1 or
2∗ Error 1 1, 2
∗ 1 3∗ 1
Error
Dim a As Integer Dim b As Integer a = 6
b = a + 1
m1 a 6 no value∗ 6 0∗
m2 b 7 7 0∗ 7
Dim x As Integer Dim y As Integer x = 8
y = x
n1 x 8 no value∗ 8 0∗
n2 y 8 8 0∗ 8
Dim a As Integer Dim b As Integer Dim c As Integer a = 10 b = 20 c = 30 a = b c = a
o1 a 20 10 or 20
or 30
2∗ 10 no value∗ 10, 20∗ 10 30† 30†
o2 b 20 10 or 20 0∗ 20 no value∗ 20 20 10∗ 20
o3 c 20 10 or 30 3∗ 30 20 30, 10,
20∗
30 20 60∗
Dim a As Integer Dim b As Integer a = 10 b = 20 a = b b = a
p1 a 20 10 or 20 0∗ 10 no value∗ 10, 20∗ 10 10† 10 30∗
[image:15.595.32.569.212.824.2]2.3 Video Instruction
The number of available video materials for educational purposes have been rapidly increasing, amongst other reasons due to relatively cheap, easy access to tech-nologies and easy distribution via internet. Educational videos have advantages over paper tutorials or classroom instructions, such as the richness of the represen-tation and independence of time and location, but the quality of productions is not necessarily sufficient for them to be (effective) educational videos (Winslett, 2014; Van der Meij & Van der Meij, 2013; H¨offler & Leutner, 2007).
Instructional design is subject of academic interest. This work, however, is of-ten theoretical and provides no design guidelines. For example, Winslett (2014) reviewed publications on educational videos and classified production types and learning objectives, but did not attempt to provide best practices or principles. Even so, Wilson (2013) presented different views on instructional design and its possibili-ties, but did not specify a set of instructional principles or strategies, even tough, the author stated that instructional design theories differ from educational psychology and learning sciences by its aim to guide teachers in the process of creating courses and media. The author’s concluding thoughts are that “Instructional design practice involves knowledge production just as doing research does. Art, science, craft, anal-ysis, testing —all have a role for designing good instruction[. . . ].” H¨offler and Leutner (2007) presented a detailed theoretical framework, and give some suggestions on how this influences learning. For example, they state that learning outcomes are improved by presentation of both verbal and visual information —the “multimedia principle” (Mayer, 2002). From their meta-analysis the authors concluded that ani-mations out perform static images, and that representational aniani-mations are superior to animation with a decorational function.
2.3. VIDEOINSTRUCTION 11
Van der Meij and Van der Meij (2013) developed concrete guidelines (see Sec-tion 2.3) for the design of instrucSec-tional videos for software training, based on re-search about information processing and instructional design principles. The au-thors found that, videos adhering to these guidelines outperformed paper tutorials in improvement of both skill and motivation. However, these guidelines were de-veloped for tutorial videos (i.e., procedural knowledge) and not all guidelines may be equally important for other learning objectives. Clearly, for transfer of concep-tual knowledge is deemed irrelevant guideline 5, which explicitly states to provide procedural rather than conceptual information. Further, additional practices may be needed for a production to serve conceptual learning objectives.
Guidelines for Tutorial Videos
by Van der Meij and Van der Meij (2013)Guideline 1: Provide easy access Make the video easy to find.
Guideline 1.1 Craft the Title carefully Use a verb and object to indicate what the video is about, and avoid use of jargon in introductory materials.
Guideline 2: Use animation with narration Display a sequence of events that ex-presses an actual scenario of use.
Guideline 2.1 Be faithful to the actual interface in the animation The con-tent and format should correspond (congruency principle); demonstrate task execution in context.
Guideline 2.2 Use a spoken human voice for the narration Explain what is happening on the screen; learning is enhanced by provision of both visual and auditory sensory information (modality principle).
Guideline 2.3 Action and voice must be in synch Simultaneous presentation is more effective than successive (temporal contiguity principle).
Guideline 3: Enable functional interactivity Unfold the scenario fit to the users capabilities; use interaction to pause the stream of information (limited capacity model).
Guideline 3.1 Pace the video carefully Keep a conversational tempo, speak-ing to quickly leads to overload, to slow to boredom.
Guideline 3.2 Enable user control Enable standard media player controls to allow the user to (re)inspect and focus. Use segmentation to activate the user.
Guideline 4: Preview the task Give an outline and clarify main goals.
Guideline 4.2 use a conversational style to enhance perceptions of task relevance
A personal style is more appealing that a formal style, thereby stimulat-ing active processstimulat-ing (personalization principle). Further, a familiar style requires less cognitive effort.
Guideline 4.3 Introduce new concepts by showing their use in context Introduce vocabulary and explain concepts when relevant (i.e., appearing during the
demonstration) to reduce working memory load.
Guideline 5: Provide procedural rather than conceptual information Focus on the learning objective.
Guideline 6: Make tasks clear and simple Use easy to understand, concrete and realistic explanations and eave out all non-essential information (coherence principle).
Guideline 6.1 Follow the user’s mental plan in describing an action sequence
Follow the sequence of actual task execution.
Guideline 6.2 Draw attention to the connection of user actions and system reactions
Highlight the relation between action and system response.
Guideline 6.3 Use highlighting to guide attention Information that belongs together should be presented in close proximity (spatial contiguity prin-ciple). Highlight feature that require attention and distinguish highlights from the actual interface (signalling principle).
Guideline 7: Keep videos short A video should last 1 to 3 minutes. Create mean-ingful segments with a clear beginning and end to optimize engagement and minimize cognitive load (segmenting principle).
Chapter 3
Intervention
[image:19.595.136.490.495.712.2]Our aim was to develop material to instruct correct conceptual knowledge about variables of primitive types in imperative programming, thereby, addressing any mis-conceptions a student may hold on this topic. Therefore, we created an interactive, educational video. First, we defined the learning goals addressing identified mis-conceptions. Next, following the constructivist approach, we ordered these learning goals by increasing complexity. Then, we created a storyline naturally appointing each learning goal. Following the story of hacker Nelly trying to retrieve a passcode, a few lines of code are traced, gradually explaining assignment statements. The video is paused at strategical moments to maintain or regain attention and assess knowledge reception. The scenario script, including questions, is available in Ap-pendix C, and the video is available on YouTube (https://youtu.be/WARZCZ D66Y).
Figure 3.1: still of the created video.
3.1 Learning Objectives
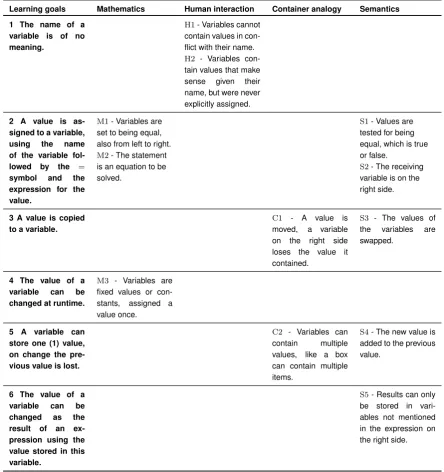
The objective of the video instruction is teach viable models about variables by providing alternative knowledge addressing identified misconceptions students may hold. Based on the misconceptions from the literature and presented in Section 2.2.1, we formulated six learning goals as presented below. The relations between these learning goals and identified misconceptions are presented in Table 3.1. These learning goals are one by one instructed in the video, showing both the program-ming code and a visualisation of the computer memory.
learning goal 1 The name of a variable is of no meaning.
learning goal 2 A value is assigned to a variable, using the name of the variable followed by the=-symbol and the expression for the value (e.g.,a = 1).
learning goal 3 A value is copied to a variable (i.e., for b = a, both a and b have the same value [not the same object]).
learning goal 4 The value of a variable can be changed at runtime.
learning goal 5 A variable can store one (1) value, on change the previous value is lost.
learning goal 6 The value of a variable can be changed as the result of a compu-tation using the value stored in this variable (e.g., a = a + 1).
Based on the programming course progress and student performance, we as-sumed prior knowledge listed below. Nonetheless, these items are briefly touched upon at the start of the video to refresh memory and provide a comfortable start.
A Variables are used to improve programming code efficiency, readability and flex-ibility.
B Each variable has a name, which is a referent to reserved space in the computer memory.
C Each variable has a value, which is stored in and read from the memory using the variable name. (In Visual Basicif no value is assigned a default value is given.) D In Visual Basic, a variable is of a specific data type, which is given in the
decla-ration statement afterAs.
a Variables of Integer type can only contain non-decimal numeric values. E In Visual Basic, when you do not specify an initial value a default value is
3.1. LEARNING OBJECTIVES 15
Table 3.1: Learning goals related to misconceptions. Extended version of Ta-ble 2.1, indication misconceptions and learning goals defined to address these misconceptions.
Learning goals Mathematics Human interaction Container analogy Semantics
1 The name of a variable is of no meaning.
H1- Variables cannot
contain values in con-flict with their name.
H2 - Variables
con-tain values that make sense given their name, but were never explicitly assigned.
2 A value is as-signed to a variable,
using the name
of the variable
fol-lowed by the =
symbol and the
expression for the value.
M1- Variables are
set to being equal, also from left to right.
M2- The statement
is an equation to be solved.
S1- Values are
tested for being equal, which is true or false.
S2- The receiving
variable is on the right side.
3 A value is copied to a variable.
C1 - A value is
moved, a variable on the right side loses the value it contained.
S3 - The values of
the variables are swapped.
4 The value of a
variable can be
changed at runtime.
M3 - Variables are
fixed values or con-stants, assigned a value once.
5 A variable can store one (1) value, on change the pre-vious value is lost.
C2 - Variables can
contain multiple values, like a box can contain multiple items.
S4- The new value is
added to the previous value.
6 The value of a
variable can be
changed as the
result of an ex-pression using the value stored in this variable.
S5- Results can only
3.2 Instruction Material Design
For the instruction material a video was chosen because this type of media is fa-miliar to and popular amongst our target audience, and video instructions provide high motivation and support long-term knowledge acquiring (van der Meij & van der Meij, 2015; H¨offler & Leutner, 2007). For the design of the instructional video we relayed, as advised by Wilson (2013), on all three instructional design approaches: 1) Artistic, using intuition (e.g., storyline); 2) Emperical, collecting tryout data (e.g., topic selection); and 3) Analytical, using principles from theory (see Chapter 2).
The chose video style is a paper-cut stop-motion style due to its relatively easy, cheap and flexible production possibilities. Moreover, the style is a commonly ap-preciated animation technique. One of the advantages of the production style was that it allowed us to create three versions for different programming languages1whit
exactly the same animations and voice-over. The story-line of hacker Nelly was added to make the scenario more playful and interesting, and provide some context for otherwise seemingly meaningless lines of code.
Throughout the video is visualised a simulation of code execution with a voice-over explaining step-by-step the effect on the variables and their values in the com-puter memory. This presentation is consistent with recommendation for conceptual knowledge transfer given by Van der Meij and Van der Meij (2013) and recommen-dations for instructing variables by Kuittinen and Sajaniemi (2004). After a short introduction, presenting assumed prior knowledge, the scenario gradually builds up knowledge about variables , including all learning goals. As advised by Kuittinen and Sajaniemi (2004), starting with labels for variables, followed by assignment of a numeric value and than advancing to more complex assignment statements.
The planned scenario resulted in a relatively long video (4:44, while 1–3 min-utes was recommended (Van der Meij & Van der Meij, 2013)). Therefore, pauses were included at logical moments (i.e., after instructing each of the learning goals) to reactivate viewer attention. Mayer (1988) suggested these pauses to improve effectiveness, as well was this recommended in guidelines by Van der Meij and Van der Meij (2013). Each pause included a multiple choice question, usable for self-assessment of correct understanding, and facilitate viewer control of pace and segment replay. This optimises viewer understanding before proceeding to the next item, which supports the constructivist approach of building upon prior knowledge (Ben-Ari, 1998; Kuittinen & Sajaniemi, 2004).
1The study was planned to be conducted with participants following a programming course in
3.2. INSTRUCTIONMATERIALDESIGN 17
3.2.1 Adherence to Guidelines
Although design decisions initially may originate from intuition or prior experience, they do adhere to the guidelines proposed by Van der Meij and Van der Meij (2013) as presented in Section 2.3. When applicable the scenario and production were advanced by explicit application of these guidelines.
Although the guidelines were designed for instruction of procedural knowledge, they mostly apply as well to instructions of conceptual knowledge. Except for guide-line 5, which explicitly states to provide procedural rather than conceptual informa-tion, while expertise programming skills require conceptual knowledge rather that procedural (Ben-Ari, 1998). Acknowledging this, Van der Meij and Van der Meij (2013) provide an alternative; a simulation displaying problem-solving steps in com-bination with a voice-over informing about the rationale behind each step. This de-scription seamlessly fits the design of our video.
Guideline 1The video has a short but descriptive title “How do variables work?”
The video was published online and a hyperlink was offered via the schools prevalent media platform accessible to all targeted students.
Guideline 2 The video starts with a quick recap of what variables are used for and then frames the main questions of how variables work. Each step is visualised and synchronously explained by a (human) narrator. The animation does not show the actual interface to improve readability, but the congruency principle is applied by showing compatible, working programming code. The computer memory bank with the variables is a conceptual representation.
Guideline 3The video follows a slow conversational pace and is segmented into six parts corresponding with the learning goals. The Hapyak video player provides basic user control (play, pause, replay, and skipping), and shows segments in a time-line. Segments were created by pauses with multiple choice questions. The video design consciously deviated fromguideline 7, but instead used these segments to channel attention and reduce cognitive load.
Guideline 4The aim of the video is clearly stated and the scenario is introduced. Then, assignment statements are instructed with step-wise increasing complexity. New information is embedded into the story-line, visualised (in code and memory), and explained by the narrator.
Chapter 4
Method
We conducted a quasi-experimental, within-subject empirical study to evaluate an instruction material designed to teach correct understanding of variables in three classes with students of secondary education enrolled in a introductory Visual Ba-sic programming course. Students watched an interactive video as described in Chapter 3. Misconceptions held about variables were measured prior to and after watching this video.
4.1 Participants
A total of thirty-seven Dutch students, divided over three classes, in their fourth year of secondary education were recruited to participate in the study1. Students
were following general higher education (havo, 2 classes) or pre-university educa-tion (vwo, 1 class), enrolled in the computer science curriculum, including an in-troductory programming course, and obliged to participate during class. Students scoring above 60% in the post-test were rewarded a small benefit at their final exam for the programming course. Four students did not complete the test(s) and have been excluded from further analysis. The remaining 33 participants (27 male, 6 fe-male, 15-18 y.o.) followed higher general secondary education (havo, n = 22) or
pre-university education (vwo, n = 11). All participants did have some prior
experi-ence in HTML and CSS. All but one reported no further programming experiexperi-ence.
1The study was also conducted at another school of secondary education and a university of
ap-plied science, but data obtained from these samples were exclude from further analysis due to low number of participants (respectively 2 and 6), difference in programming language (slightly alternat-ing the answer model), and (unsupervised) procedure.
4.2 Materials
The study materials are the pre-test to detect initial misconceptions, the post-test to measure the learning effect of the instruction video, and the interactive video to instruct correct understanding of assignment statements for variables in impera-tive programming. Explanation of the procedure and hyperlinks to the assessment tests and video were provided through the school’s learning environment2(see
Fig-ure 4.1). All materials were accessed trough a desktop computer equipped with in-ear headphones.
Pre- and Post-Test were developed to assess whether a student has a correct understanding of or holds misconceptions about variables based on the work of the work of Ma et al. (2007); Dehnadi and Bornat (2006), as described in Section 2.2.2. The pre-test contained, next to the assessment questions, two questions asking for level of education, and prior programming experience. The 29 assessment ques-tions ask for the value of each variable after execution of a given programming code snippet. For each question, incorrect responses were predicted and mapped to spe-cific misconceptions, and for each misconception at least two programming code snippets (with one or more questions) were constructed to detect the specific mis-conception (see Table 2.2). The question order was randomised to minimise the learning effect of the test itself. The post-test contained a variation of each pre-test code snippets and assessment questions, slightly altering names and values to ensure assessing misconceptions in a similar way. The assessment tests were published via Socrative3. A representative screen and all pre- and post-test code
snippets and questions are presented in Appendix B.
Interactive Video was developed to instruct correct understanding of the learning goals addressing identified misconceptions about variables as presented in Table 3.1. The video loosely follows a constructivist approach by giving context and grad-ually building up knowledge while triggering active involvement. Further, if applica-ble, we adhered to the guidelines for design of an instruction video by Van der Meij and Van der Meij (2013). A paper-cut, stop-motion animation follows hacker Nelly while she is tracing a few lines of code to retrieve a hidden value —the password of architect Nico. For each line of code, the effect of statement execution on the variables and their values in the computer memory is visualised, and a voice-over explains what happens in natural language. The resulting video has been published
2https://candea.itslearning.com/
4.3. PROCEDURE 21
on YouTube4. Six required multiple choice questions were included to retain
atten-tion, and highlighting important learning goals. These questions were added using the freely available web based tool Hapyak5. The script, questions, and video stills
[image:27.595.138.491.169.364.2]are available in Appendix C. Details on the design rational are given in Chapter 3.
Figure 4.1: illustration of the format in which the instructions and hyperlinks to the pre-test, interactive video and post-test were presented to the par-ticipants via ItsLearning. (Readable instructions are available in Ap-pendix C, Section C.3)
4.3 Procedure
Participants were seated at a computer in the classroom. They received a <1
minute oral instruction emphasising that it was not allowed to collaborate or look up answers, and directing the participants to further instructions at the learning envi-ronment. Hereafter, the participants started their computer and visited the directed learning environment page. From this page they navigated to the pre-test and sub-sequently the interactive video and afterwards the post-test. Although a time limi-tation was not explicitly given, all students finished within 45 minutes, before class ended. The study was fully conducted under supervision in the classroom. Students were allowed to ask procedural questions only (e.g., problems with headphones), substantive questions about the material were not answered. This procedure was repeated three times, once for each participating class.
4https://youtu.be/WARZCZ D66Y
4.4 Measures
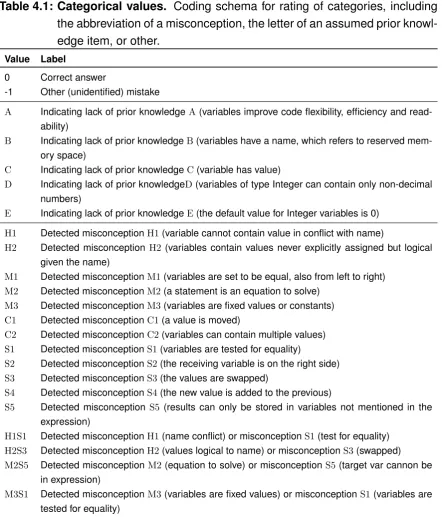
Misconceptions held by each participant were assessed before and after watching the interactive video by the assessment questions of the pre- and post-test. In the post-test one question was accidentally left out, leaving 28 questions to be used for evaluation of the intervention; pre-test questions 3--22 and 24--31, and post-test questions1--28. Participants level of education and prior programming experience were measured by the first two pre-test questions. The responses to a total of 2 demographic and 56 assessment questions were recorded for 33 participants. The obtained data is available in Appendix D, Section D.1.
We applied some transformations to the assessment questions and response data before analysis. The questions were ordered aligning pre- and post-test ques-tions constructed to assess the same misconcepques-tions in correspondence with Table 2.2, and renumbered alphanumerical [a--p] for each programming code snippet and numeric [1--3] for each question about the code snippet, with a prefix [pre or post] indicating the test. The responses were recoded rating the possibly held miscon-ception. For non-differential responses, combined misconceptions were rated. Fur-ther, due to the frequency of responses indicating a lack of assumed prior knowl-edge these items were added to the categorical values. Finally, we added another
category to rate remaining incorrect responses. Resulting in a list of 23 possible val-ues as given in Table 4.1. Following, the scores for each category was calculated, counting for each participant the number of times a category was rated. Details on the recoding and transformation process are given in the remainder of this section.
The resulting dataset includes three independent variables (participant, educa-tional level, and prior programming experience), a total of 56 categorical variables —28 explanatory and 28 outcome— (the recoded pre- and post-test responses) with 23 possible values (0 for a correct response and for incorrect responses an abbrevi-ation of the misconception, a letter of prior knowledge item, or other), and 34 ordinal variables (calculated pre- and post-test scores for specific clusters of categories i.e., all, class or error, identified misconceptions, and learning goals) —17 explanatory and 17 outcome. This dataset in available in Appendix D, Section D.2, and was used for analysis evaluating the effectiveness of the video in addressing misconceptions.
4.4.1 Recoding
4.4. MEASURES 23
Table 4.1: Categorical values. Coding schema for rating of categories, including the abbreviation of a misconception, the letter of an assumed prior knowl-edge item, or other.
Value Label
0 Correct answer
-1 Other (unidentified) mistake
A Indicating lack of prior knowledgeA(variables improve code flexibility, efficiency and
read-ability)
B Indicating lack of prior knowledgeB(variables have a name, which refers to reserved
mem-ory space)
C Indicating lack of prior knowledgeC(variable has value)
D Indicating lack of prior knowledgeD(variables of type Integer can contain only non-decimal
numbers)
E Indicating lack of prior knowledgeE(the default value for Integer variables is 0) H1 Detected misconceptionH1(variable cannot contain value in conflict with name)
H2 Detected misconceptionH2 (variables contain values never explicitly assigned but logical
given the name)
M1 Detected misconceptionM1(variables are set to be equal, also from left to right) M2 Detected misconceptionM2(a statement is an equation to solve)
M3 Detected misconceptionM3(variables are fixed values or constants) C1 Detected misconceptionC1(a value is moved)
C2 Detected misconceptionC2(variables can contain multiple values) S1 Detected misconceptionS1(variables are tested for equality)
S2 Detected misconceptionS2(the receiving variable is on the right side) S3 Detected misconceptionS3(the values are swapped)
S4 Detected misconceptionS4(the new value is added to the previous)
S5 Detected misconception S5 (results can only be stored in variables not mentioned in the
expression)
H1S1 Detected misconceptionH1(name conflict) or misconceptionS1(test for equality) H2S3 Detected misconceptionH2(values logical to name) or misconceptionS3(swapped) M2S5 Detected misconceptionM2(equation to solve) or misconceptionS5(target var cannon be
in expression)
M3S1 Detected misconceptionM3(variables are fixed values) or misconceptionS1(variables are
was done to optimise the accuracy of misconception detection without changing the rating frequency. Meaning that if a programming code snippet had two questions and one was answered correctly and the other incorrect, the correct answer may be used to understand the misconception underlying the incorrect answer, but the mis-conception was rated only once. While, if both questions were answered incorrect, the misconception was rated twice. For example, take programming code
snip-pet Dim a As Integer; Dim b As Integer; a = 7; b = a, and question (pre g1)
“What is the value for a?” The incorrect response a = 0 would be rated S3 when
the correct value (b = 7) was given, whileS2was rated for both questions when the
(incorrect) response topre g2was b = 0. However, if the value forbwas0, but for acorrect (7), then (only) question pre g2was ratedS1.
A new category was created when incorrect responses did not differentiate be-tween multiple misconceptions, and neither could be disproved. For example, take
code snippetpre i Dim x As Integer; Dim y As Integer; x = 10, y = 20; y = y.
The combined incorrect responsesx = 10andy = 20were the predicted values for misconceptionM3as well as misconceptionS1, thus these incorrect responses were
ratedM3S1. Based on non-differential values, the following concatenated categories
have been identified: H1S1,H2S3,M2S5, andM3S1.
Then, remaining incorrect responses —not corresponding to any of the predicted values, mapped to identified misconceptions— but clearly indicating a lack of as-sumed prior knowledge as listed in Section 3.1 were rated accordingly. Meaning that, all responses that included a variable name or an expression were rated C
(a variable has a value), non-integer values were rated D (a variable of data type
Integer cannot contain decimal numbers), and no value (and a few occasions of
Error) were rated E (variables of type Integer get default value 0 if no value is
explicitly assigned). Assessing misconceptions was prevalent, thus lack of prior knowledge was only rated if the response did not match to any of predicted val-ues detecting misconceptions. Except for cases were the misconception would re-sult in an incompatible type. For example, take programming code snippet pre e Dim groot As Integer; Dim klein As Integer; groot = 10; klein = 20;
groot = klein, and question (pre e1) “What is the value for klein?” The incorrect
response 0.5was ratedD rather than M2because a student with proper assumed
prior knowledge should have know that this value is not possible and rather re-sponded withErroror round-up number1.
4.4. MEASURES 25
such as “variable”, “user input”, or “563556”. However, often there might be a combi-nation of misconceptions underlying these mistakes. The fast majority of these un-classified incorrect responses included a numeric value that may have resulted from an algebraic solution. Although meaningless at first sight, there is often ‘logic’ behind these responses when including somemagical value contagion. For example, take
code snippet Dim a As Integer, Dim b As Integer, a = 10, a = b * 8,
ques-tion (post k1) “What is the value for a?”, and response 80. When ‘magically trans-ferring’ the old value ofa(10) tob, it results in a perfect equation; 80 = 10×8. This
may indicate holding misconceptionM2, but also suggests misconceptionS3. There
were too many, inconsistent, unanticipated behavioural mistakes to draw solid con-clusions about the assumptions underlying these mistakes. Moreover, identifying misconceptions is outside the scope of this report, for the remainder of this work these are all categorised asother.
4.4.2 Transformation
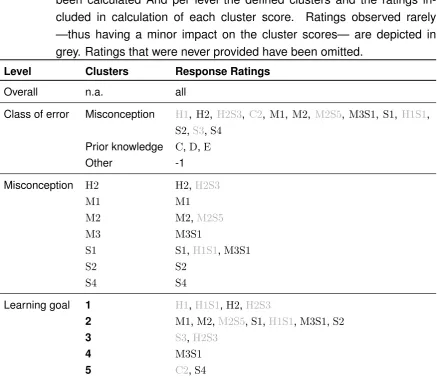
Finally, we scored per participant per test the total number of incorrect responses, the number of incorrect responses per class (i.e., identified misconception, prior knowledge, or other) and the number of ratings per misconception, the score per learning goal was calculated based on the ratings of related misconceptions. Thereby we calculated scores on four levels: overall, class of error, misconceptions and for learning goals, with respectively 7 and 5 clusters for last two (see Table 4.2).
The overall score was obtained by calculating all incorrect responses. Class of error scores were obtained by counting all the possible categorical values detecting identified misconceptions, or indicating assumed prior knowledge or the number of
other incorrect responses.
Misconception scores were obtained by counting all ratings of possible categor-ical values including each specific misconception. Minimally including the miscon-ception abbreviation itself, and possibly concatenated abbreviations. Seldom re-ported ratings for non-differential values were counted with the predominant mis-conception. Often ratedM3S1 was included in the calculation of the scores for both
misconceptionS1and M3. Noteworthy, misconception M3could never be uniquely
detected based on the tests, so the score of misconceptionM3 was based only on
ratings ofM3S1. MisconceptionsH1,C1,C2,S3, andS5have been rejected because
these were not or hardly present in our sample.
Learning goal scores were obtained by counting all ratings of possible categorical values for all misconceptions related to a specific goal. For example, scores for
learning goal 2 are based on the number of ratings of misconception M1,M2, S1,
We did choose tonot normalise the scores because choice of the divider would
[image:32.595.67.505.286.663.2]be prone to subjectivity. Specific assessment questions have been constructed to assess certain misconceptions, however, other questions may be as adequate in as-sessing this misconception. The discussion whether a question should be included in the set of question that can possibly detect a misconception is outside of the score of this report. Therefore, we choose to use raw misconception scores rather then normalised scores. Moreover, lack of prior knowledge was not intended to be as-sessed by the developed test, therefore, no consideration of question construction and efficiency regarding this subject took place.
Table 4.2: Levels of analysis. The levels on which pre- and post test scores have been calculated And per level the defined clusters and the ratings in-cluded in calculation of each cluster score. Ratings observed rarely —thus having a minor impact on the cluster scores— are depicted in grey. Ratings that were never provided have been omitted.
Level Clusters Response Ratings
Overall n.a. all
Class of error Misconception H1, H2,H2S3, C2, M1, M2, M2S5, M3S1, S1,H1S1, S2,S3,S4
Prior knowledge C,D,E
Other -1
Misconception H2 H2,H2S3
M1 M1
M2 M2,M2S5
M3 M3S1
S1 S1,H1S1,M3S1
S2 S2
S4 S4
Learning goal 1 H1,H1S1,H2,H2S3
2 M1,M2,M2S5,S1,H1S1,M3S1,S2
3 S3,H2S3
4 M3S1
4.5. DATA ANALYSIS 27
4.5 Data analysis
To evaluate the effectiveness of the interactive video in addressing misconceptions about assignment statements for variables in imperative programming held by stu-dents in secondary education we compared the mean scores (i.e., the number of incorrect responses) between the pre- and post-test.
Using a Shapiro-Wilk test for normality on the outcome variable a normal distri-bution could not be assumed for the number of incorrect responses in the post-test,
p= 0.028, therefore, non-parametric tests were chosen. We used Wilcoxon
Signed-ranks tests to compare the means of two related samples.
First of all, we compared the total number of errors between the pre- and post-test to evaluate the overall learning effect. Then, we ran several paired post-test —com-paring the number of errors between the pre- and post-test on various clusters of errors— to further investigate the effectiveness on different levels (see Table 4.2). First, all incorrect responses were grouped by the class of error (i.e., detecting an identified misconception, indicating a lack of prior knowledge, or other mistakes) to investigate the extend to which the learning effect was related to misconceptions. Next, we analysed scores per identified misconception to evaluate the effectiveness in addressing specific misconceptions about variables. Then, we analysed miscon-ceptions scores grouped per learning goal to evaluate the effectiveness in instructing correct understanding of assignment statements for variables.
Chapter 5
Results
The interactive video was received overwhelmingly positive by students. They pro-vided comments such as “the video was very educational” or “clear movie!” Multiple students expressed a desire to have received this instruction sooner based on a be-lieve of increased understanding of variables and expectation to be better equipped to complete the programming course assignments.
Identification of misconceptions and development of assessment tests were sub-ject of an earlier report (Plass, 2015), where we also reported the overall effect of our video designed to address identified misconceptions. The difference in num-ber of (in)correct answers between the pre- and post-test indicated that the video positively affected understanding of variables. The majority of participants in the Vi-sual Basic group showed an improvement after the video, however, in the Java and JavaScript samples some participants showed a deterioration in correct knowledge in the post-test. In the remainder of this chapter we report the quantitative results evaluating the effectiveness of the video in addressing misconceptions about assign-ment stateassign-ments for variables of primitive type in imperative programming for Dutch secondary education students enrolled in a introductory course Visual Basic pro-gramming. We extend evaluation of the effect of the video with detailed analysis for each specific misconception and learning goal.
5.1 Frequencies
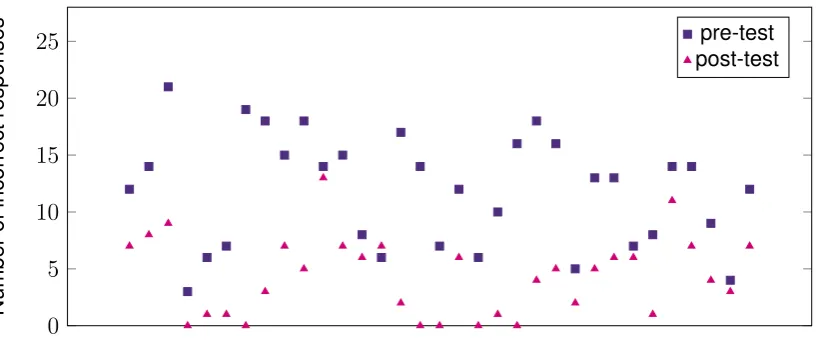
A total of 33 participants answers 28 questions each per assessment tests. All but one participants improved their score (the number of correct responses) in the post-test compared to the pre-post-test. However, there is some variety between participants in the degree of improvement (see Figure 5.1).
In the pre-test non of the participants answers all questions correctly, while in the post-test six participants did so. In total, in the pre-test, participants provided391
0 5 10 15 20 25
Participants
Number
of
incorrect
responses
[image:36.595.75.485.83.260.2]pre-test post-test
Figure 5.1: Number of incorrect responses (range 0-28) for pre- and post-test per participant.
correct responses, spread over 25 questions. In the post-test, a total of144incorrect
responses where given over 23 questions, by 27 participants. Only a single question (n2) was answered correctly by all participants in both assessment tests. None of the questions was answered incorrectly by all participants in either the pre- and/or post-test, but questionsm1,n1andn2never elicited any of the predicted values indi-cating an identified misconception. In the pre-test247 incorrect responses, n = 31,
spread over 20 questions, indicated a identified misconception. In the post-test 59
incorrect responses,n= 15, over 18 questions, indicated a identified misconception.
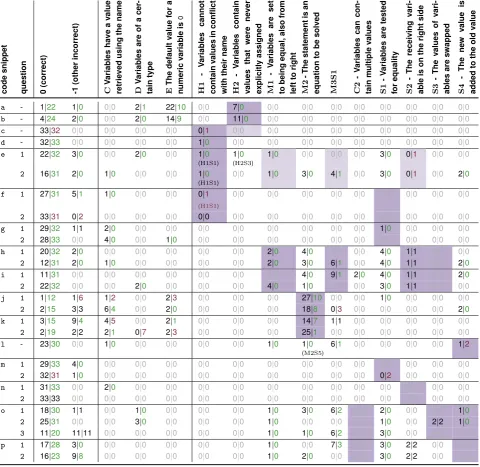
The full variation in number of incorrect responses over the different questions, and indicating the identified misconceptions is presented in Table 5.1.
5.2 Data Analysis
5.2.1 Overall Learning Effect
First, we verified earlier results indicating an overall improvement of test results af-ter the inaf-tervention. For this we counted and compared the number of incorrect responses per test, using only participants from the Visual Basic course.
A Wilcoxon Signed-ranks test indicated that post-test scores, M dn = 5, were
significantly lower than the pre-test scores, M dn = 13, Z = −5.0, p = 0.00. In
other words, participants showed improved understanding of variables, providing significantly less incorrect responses in the post-test (Sum = 144) than the pre-test
(Sum = 391). This decline in number of incorrect responses aligns with the visual
5.2. DATAANALYSIS 31
Table 5.1: Frequency of ratings The number correct responses and the number of incorrect responses indicating identified misconceptions, lack of as-sumed prior knowledge, or unanticipated behavioural mistakes per ques-tion for both the pre- and post-test. | separates between the pre- and
post-test ratings. The text colour indicates the differences between the pre- and post-test; black no difference, green improvement and red de-terioration. Never observed misconception C1 and S5 are omitted. For
non-differential misconceptionM3we report the frequencies forM3S1
in-stead, for all other non-differential incorrect responses we report their occurrence in parentheses under the predominant misconception.
code
snippet
question 0(correct) -1(other
incorrect) C Variab les ha ve a value retrie ved using the name D Variab les are of a cer -tain type E The default value for a numeric variab le is 0 H1 -Variab les cannot contain values in conflict with their name H2 -Variab les contain values that were ne ver explicitl y assigned M1 -Variab les are set to being equal, also fr om left to right M2 -The statement is an equation to be solved M3S1 C2 -Variab les can con-tain m ultiple values S1 -Variab les are tested for equality S2 -The receiving vari-ab le is on the right side S3 -The values of vari-ab les are swapped S4 -The ne w value is ad ded to the old value
a - 1|22 1|0 0|0 2|1 22|10 0|0 7|0 0|0 0|0 0|0 0|0 0|0 0|0 0|0 0|0 b - 4|24 2|0 0|0 2|0 14|9 0|0 11|0 0|0 0|0 0|0 0|0 0|0 0|0 0|0 0|0
c - 33|32 0|0 0|0 0|0 0|0 0|1 0|0 0|0 0|0 0|0 0|0 0|0 0|0 0|0 0|0 d - 32|33 0|0 0|0 0|0 0|0 1|0 0|0 0|0 0|0 0|0 0|0 0|0 0|0 0|0 0|0
e 1 22|32 3|0 0|0 2|0 0|0 1|0
(H1S1)
1|0
(H2S3)
1|0 0|0 0|0 0|0 3|0 0|1 0|0 0|0
2 16|31 2|0 1|0 0|0 0|0 1|0
(H1S1) 0
|0 1|0 3|0 4|1 0|0 3|0 0|1 0|0 2|0
f 1 27|31 5|1 1|0 0|0 0|0 0|1
(H1S1)
0|0 0|0 0|0 0|0 0|0 0|0 0|0 0|0 0|0
2 33|31 0|2 0|0 0|0 0|0 0|0 0|0 0|0 0|0 0|0 0|0 0|0 0|0 0|0 0|0 g 1 29|32 1|1 2|0 0|0 0|0 0|0 0|0 0|0 0|0 0|0 0|0 1|0 0|0 0|0 0|0 2 28|33 0|0 4|0 0|0 1|0 0|0 0|0 0|0 0|0 0|0 0|0 0|0 0|0 0|0 0|0 h 1 20|32 2|0 0|0 0|0 0|0 0|0 0|0 2|0 4|0 0|0 0|0 4|0 1|1 0|0 0|0
2 12|31 2|0 1|0 0|0 0|0 0|0 0|0 2|0 3|0 6|1 0|0 4|0 1|1 0|0 2|0
i 1 11|31 0|0 0|0 0|0 0|0 0|0 0|0 0|0 4|0 9|1 2|0 4|0 1|1 0|0 2|0
2 22|32 0|0 0|0 2|0 0|0 0|0 0|0 4|0 1|0 0|0 0|0 3|0 1|1 0|0 0|0 j 1 1|12 1|6 1|2 0|0 2|3 0|0 0|0 0|0 27|10 0|0 0|0 1|0 0|0 0|0 0|0 2 2|15 3|3 6|4 0|0 2|0 0|0 0|0 0|0 18|8 0|3 0|0 0|0 0|0 0|0 2|0
k 1 3|15 9|4 4|5 0|0 2|1 0|0 0|0 0|0 14|7 1|1 0|0 0|0 0|0 0|0 0|0
2 2|19 2|2 2|1 0|7 2|3 0|0 0|0 0|0 25|1 0|0 0|0 0|0 0|0 0|0 0|0
l - 23|30 0|0 1|0 0|0 0|0 0|0 0|0 1|0 1|0
(M2S5)
6|1 0|0 0|0 0|0 0|0 1|2
m 1 29|33 4|0 0|0 0|0 0|0 0|0 0|0 0|0 0|0 0|0 0|0 0|0 0|0 0|0 0|0
2 32|31 1|0 0|0 0|0 0|0 0|0 0|0 0|0 0|0 0|0 0|0 0|2 0|0 0|0 0|0
n 1 31|33 0|0 2|0 0|0 0|0 0|0 0|0 0|0 0|0 0|0 0|0 0|0 0|0 0|0 0|0 2 33|33 0|0 0|0 0|0 0|0 0|0 0|0 0|0 0|0 0|0 0|0 0|0 0|0 0|0 0|0 o 1 18|30 1|1 0|0 1|0 0|0 0|0 0|0 1|0 3|0 6|2 0|0 2|0 0|0 0|0 1|0
2 25|31 0|0 0|0 3|0 0|0 0|0 0|0 1|0 0|0 0|0 0|0 1|0 0|0 2|2 1|0
3 11|20 11|11 0|0 0|0 0|0 0|0 0|0 1|0 1|0 6|2 0|0 3|0 0|0 0|0 0|0 p 1 17|28 3|0 0|0 0|0 0|0 0|0 0|0 1|0 0|0 7|3 0|0 3|0 2|2 0|0 0|0
Table 5.2: Frequencies of incorrect responses. The transformed scores, from left to right are presented: the variable and test, the median score, the count of incorrect responses over all participants, and the number of par-ticipants (N = 33) that provided one or more incorrect responses for the
reported score.
Level Scoretest Mdn Sum n
Overall Totalpre-test 13 391 33
Totalpost-test 5 144 27
Class of error Misconceptionpre-test 7 247 31
Misconceptionpost-test 0 59 15
Prior knowledgepre-test 2 82 28
Prior knowledgepost-test 1 46 18
Otherpre-test 1 62 27
Otherpost-test 1 39 22
Misconception H2 pre-test 0 19 13
H2post-test 0 0 0
M1pre-test 0 16 6
M1post-test 0 0 0
M2pre-test 3 106 28
M2post-test 0 26 12
M3pre-test 1 45 20
M3post-test 0 15 5
S1pre-test 1 82 23
S1post-test 0 18 6
S2pre-test 0 8 4
S2post-test 0 10 4
S4pre-test 0 11 7
S4post-test 0 2 2
Learning goal 1pre-test 0 20 14
1post-test 0 1 1
2pre-test 6 212 30
2post-test 0 54 15
3pre-test 0 2 2
3post-test 0 2 2
4pre-test 1 45 20
4post-test 0 15 5
5pre-test 0 13 8