MASTHER THESIS
QUANTIFYING DIAPHRAGM
EFFORT USING DIAPHRAGM
ELECTROMYOGRAPHY
B
ABETTE VAN DEW
ERFFM
AY2019
CHAIRMAN AND TECHNICAL SUPERVISOR: PROF. DR. IR.M.J.A.M. VAN PUTTEN
MEDICAL SUPERVISOR: PROF. DR.L.M.A.HEUNKS
TM SUPERVISOR: A.H.JONKMAN,MSC.
PROCESS SUPERVISOR: R.J.HAARMAN, DRS.
EXTRA SUPERVISOR: H.J. DE VRIES,MD
2
A
BSTRACT
Introduction: Diaphragm dysfunction develops in the majority of mechanically ventilated critically ill patients on the intensive care unit (ICU), and is associated with adverse outcomes, including prolonged duration of weaning and increased mortality. Insufficient or excessive levels of ventilatory assist may result in diaphragm dysfunction. Monitoring diaphragm effort could help to create a diaphragm-protective ventilation strategy. The golden standard for measuring diaphragm effort, transdiaphragmatic pressure (Pdi), has certain difficulties, e.g. acquiring and interpreting Pdi, that limit the use in clinical care. An alternative technique could be the electrical activity of the diaphragm (EAdi), as it is already demonstrated EAdi strongly correlates with Pdi. EAdi has been used to quantify breathing effort in ICU patients before within a limited range of respiratory muscle effort. Therefore, our goal was to study the correlation between EAdi and Pdi in the entire physiological range of breathing effort in healthy subjects to be able to quantify diaphragm effort using EAdi.
Methods: Mouth pressure (Pmo), Pdi and EAdi were recorded continuously in fifteen healthy subjects using nasogastric catheters. Different levels of inspiratory threshold loading were applied, ranging from 10% to 80% of maximal Pdi during an occlusion. The Pdi-EAdi relationship was assessed per subject using linear regression on all breaths or the breaths under a cutoff value for Pdi or EAdi. We tried to approximate the slope of the cutoff EAdi regression using Pmo/EAdi during different occlusions.
Results: On average, a moderate linear correlation was found between EAdi and Pdi within each subject (r2 of 0.66±0.16). In thirteen subjects, r2 improved significantly when the
breaths above 60% of maximal Pdi, cutoff Pdi, were discarded (0.81±0.10, p < 0.05). An EAdi cutoff of ±70% of maximal EAdi resulted in an insignificant increase of r2
(0.68±0.16, p = 0.140). The slopes found by linear regression were very heterogeneous among subjects, ranging from 0.39 to 1.77 cmH2O/µV. No agreement was found between the slope and Pmo/EAdi during occlusions.
3
I
NDEX
Abstract ... 2
Chapter 1. Introduction ... 5
Chapter 2. Background Information ... 6
2.1. Respiratory system ... 6
2.1.1. Respiratory physiology ... 7
2.1.2. Diaphragm ... 7
2.2. Mechanical ventilation ... 9
2.2.1. Physiology of mechanical ventilation ... 9
2.2.2. Ventilator-induced diaphragm dysfunction ... 10
2.2.2.1. Disuse atrophy of the diaphragm ... 10
2.2.2.2. Load-induced diaphragm injury ... 10
2.3. Monitoring diaphragm effort ... 11
2.3.1. Respiratory muscle pressure ... 11
2.3.2. Transdiaphragmatic pressure ... 12
2.3.4. Electrical activity of the diaphragm ... 13
2.3.4.1. Relationship between Pdi and EAdi ... 14
Chapter 3. Methods... 17
3.1. Study design and population ... 17
3.2. Data acquisition ... 17
3.3. Study protocol ... 18
3.4. Data analysis ... 19
3.4.1. EAdi signal processing ... 19
3.4.2. Obtaining variables ... 19
3.4.3. Relationship between ∆EAdi and ∆Pdi ... 20
3.4.4. Predicting the relationship using a conversion factor ... 20
3.5. Statistics... 21
Chapter 4. Results... 22
4.1. Relationship between ∆EAdi and ∆Pdi ... 22
4.2. Predicting the relationship using a conversion factor ... 24
Chapter 5. Discussion ... 26
5.1. Relationship between ∆EAdi and ∆Pdi ... 26
4
5.3. Strengths and limitations ... 28
5.4. Clinical implications ... 28
5.5. Future directions ... 28
5.6. Conclusion ... 29
References ... 30
Supplements ... 32
S.1. Methods... 32
S.1.1. Example of breath selection ... 32
S.1.2. Average template subtraction ... 32
S.1.3. Wavelet-based adaptive filter ... 32
S.2. Results ... 33
S.2.1. Regression with second order polynomial ... 33
5
C
HAPTER
1.
I
NTRODUCTION
The diaphragm is the main inspiratory muscle, as it is responsible for approximately 70% of respiration during tidal breathing [1]. Diaphragm dysfunction develops in the majority of mechanically ventilated critically ill patients on the intensive care unit (ICU) [2], and is associated with adverse outcomes, including prolonged duration of weaning and increased mortality [3-5]. Mechanical ventilation is one of the contributors to the development of diaphragm dysfunction during an ICU course [3]. Ventilator-induced diaphragm dysfunction consists of two opposing mechanisms: disuse atrophy of the diaphragm due to e.g. ventilatory over-assist [6-8], or load-induced injury of the diaphragm due to e.g. ventilatory under-assist [8-10]. In both mechanisms, non-physiological diaphragm effort plays an important role [3]. Monitoring diaphragm effort could help to create a diaphragm-protective ventilation strategy by finding a balance between over-assist or under-assist to prevent diaphragm dysfunction. However, diaphragm effort is still inadequately monitored in the ICU [11].
The gold standard for measuring diaphragm effort at the ICU is transdiaphragmatic pressure (Pdi). The interpretation of transdiaphragmatic pressure requires extensive training and sufficient understanding of the respiratory physiology [12, 13]. Furthermore, the balloon catheters used to obtain Pdi need strict control of balloon inflation volume and an adequate position for a correct measurement. These disadvantages limit the use of Pdi to monitor diaphragm effort in clinical practice.
Diaphragm electromyography is an alternative technique for monitoring the diaphragm [14-16]. A nasogastric tube embedded with electrodes measures the electrical activity of the diaphragm (EAdi). This technique is already used in clinical practice, and is relatively easy to calibrate and interpret. Previous studies showed that a strong correlation exists between EAdi and breathing effort [17, 18]. One of these studies used EAdi to estimate breathing effort in mechanically ventilated patients and showed promising results [18]. However, the researchers did not assess the gold standard for measurement of diaphragm effort, and the linear relationship that they demonstrated was only established in a very small range of breathing effort. Therefore, it is unknown to which extent EAdi relates to diaphragm effort, and until what level of diaphragm effort the relationship can be presumed linear.
6
C
HAPTER
2.
B
ACKGROUND
I
NFORMATION
2.1.
R
ESPIRATORY SYSTEM
The main function of the respiratory system is to accommodate exchange of oxygen and carbon dioxide between the atmosphere and blood. The primary organs of the respiratory system are the lungs, which carry out this gas exchange as we breathe. Breathing is initiated by the respiratory control center in the medulla oblongata in the brain stem. This control center monitors the changes in PaCO2, PaO2, and pH. The respiratory control center can adjust minute ventilation in order to meet metabolic demands and to achieve homeostasis [19].
[image:6.595.80.291.444.685.2]The primary inspiratory muscles responsible for inspiratory flow are the diaphragm and external intercostal muscles. During higher effort or a forced inspiration, the accessory muscles of inspiration engage: the scalenes, sternocleidomastoids, neck and back muscles, and upper-respiratory-tract muscles. Expiration normally is a passive event, accomplished by the elastic recoil of the lungs as inspiratory muscles relax. During higher effort or a forced expiration, the expiratory muscles engage: abdominal muscles (including the rectus abdominis, internal and external oblique, and transverse abdominal muscle), internal intercostal muscles, and back muscles [19].
FIGURE 2-1. REPRESENTATION OF THE RESPIRATORY SYSTEM AND ITS RELEVANT PRESSURES. A NASOGASTRIC CATHETER IS INSERTED TO MEASURE ESOPHAGEAL PRESSURE (PES), GASTRIC PRESSURE (PGA) AND THE ELECTRICAL ACTIVITY OF THE DIAPHRAGM (EADI) USING TWO PRESSURE-CONDUCTING BALLOONS AND AN ELECTRODE ARRAY, RESPECTIVELY. PES IS A SURROGATE FOR PLEURAL PRESSURE (PPL) AND GASTRIC PRESSURE IS A SURROGATE FOR ABDOMINAL PRESSURE. OTHER PRESSURES ARE MOUTH PRESSURE (PMO), AIRWAY PRESSURE (PAW), AND ALVEOLAR PRESSURE (PALV) [20].
Electrode array Pmo
Paw
Palv
Pes Ppl
7
2.1.1.
R
ESPIRATORY PHYSIOLOGYLung volume is determined by the interaction between the chest wall and the lungs. At the end of a relaxed expiration, the tendency of the chest wall to pull outward exactly balances the tendency of the lungs to collapse. These two opposing forces result in a pressure less than barometric pressure in the space between lungs and chest wall. In other words, it results in a negative pleural pressure (Ppl) [19]. At the end of a relaxed expiration with the mouth open, alveolar pressure (Palv), mouth pressure (Pmo) and atmospheric pressure are equal. The pressure gradient across the lung, or transpulmonary pressure (Ptp), is the pressure difference between Palv (which is equal to Pmo) and Ppl, and it is responsible for maintaining alveolar inflation. The total pressure required to expand or contract the lungs and chest wall is represented by the transthoracic pressure gradient (Pcw): the difference between Ppl and atmospheric pressure. The summation of these two pressure gradients, Pcw and Ptp, is the transrespiratory pressure gradient (Prs). Prs is the difference between Palv and atmospheric pressure, and it is responsible for the airflow during breathing.
The respiratory muscles affect the elastic recoil pressure of the chest wall. Contraction of inspiratory muscles increases the thoracic cavity and the elastic recoil of the chest wall, and makes Ppl more negative. As a result, the lungs passively expand and a negative pressure gradient arises between Palv and Pmo. This negative pressure gradient, or negative Prs, generates an inspiratory flow [19]. A schematic representation of the chest wall, lungs, diaphragm, and the relevant pressures of the respiratory system are shown in figure 2-1.
2.1.2.
D
IAPHRAGM [image:7.595.72.438.505.713.2]The diaphragm is the main inspiratory muscle that accounts for approximately 70% of normal tidal breathing [1]. This thin sheet of skeletal muscle is double-domed and separates the thoracic cavity from the abdominal cavity. During inspiration, the diaphragm contracts and both domes flatten. This
8 contraction is controlled through the left and right phrenic nerves, which arise from the anterior rami of the C3-C5 segments.
The diaphragm consists of a muscular part and a central tendon: the muscle fibers from the muscular part converge radially on the central tendon. The continuous sheet of muscle fibers is divided into three parts, based on peripheral attachments. The first part, or sternal part, attaches to the xiphoid process. The second part, or crural part, attaches to three superior lumbar vertebrae and two ligaments, and consists of the left and right crus. The muscle fibers of the crural diaphragm forms the esophageal hiatus, as seen in figure 2-2. The last part, or costal part, attaches to the inferior six costal cartilages and their adjoining ribs, and forms the two domes of the diaphragm [19].
The muscle fibers of the costal diaphragm that directly appose to the lower rib cage form the so-called “zone of apposition”. During inspiration, the fibers in the zone of apposition shorten. As a result, both domes of the diaphragm descend and flatten, causing the size of the thoracic cavity to increase and the abdominal cavity to compress. Thus, during normal tidal breathing, Ppl decreases and abdominal pressure (Pab) increases. The resulting pressure gradient is the transdiaphragmatic pressure (Pdi).
𝑃𝑑𝑖= 𝑃𝑎𝑏− 𝑃𝑝𝑙 (1)
[image:8.595.74.447.556.670.2]The amount of transdiaphragmatic pressure, or force, the diaphragm generates during contraction depends on a number of physiologic relationships. Force generation relates to the initial length of the diaphragm length relationship), the velocity of diaphragm muscle fiber shortening (force-velocity relationship), and the rate at which the diaphragm is stimulated (force-frequency relationship). The most clinically important determinant of force generation is the force-length relationship, which shows that single muscle fibers do not produce the same amount of isometric force when they are activated at different static lengths. Theoretically, at shorter lengths force increases as length increases, at medium lengths force remains approximately the same as length increases, and at long lengths force decreases as length increases (figure 2-3A). The first two phenomena have been demonstrated in vivo for the human diaphragm (figure 2-3B) [22]. The force-velocity relationship is closely related to the force-length relationship: the more rapidly a muscle shortens during contraction (i.e. the more rapidly its length decreases), the lower the force generated during contraction.
FIGURE 2-3. FORCE-LENGTH RELATIONSHIP. A SHOWS THE THEORETICAL FORCE-LENGTH RELATIONSHIP OF A MUSCLE FIBER. B SHOWS THE FORCE-LENGTH RELATIONSHIP OF THE HUMAN DIAPHRAGM BASED ON 7 HEALTHY SUBJECTS. RELATIVE TRANSDIAPHRAGMATIC PRESSURE (PDI) IS RELATED TO DIAPHRAGM MUSCLE LENGTH (DML) [22].
Muscle fiber length
9
2.2.
M
ECHANICAL VENTILATION
Mechanical ventilation is a life-sustaining modality for ICU patients with acute respiratory failure. Their minute ventilation is insufficient to maintain adequate homeostasis of oxygen and/or carbon dioxide, due to for example pneumonia or an acute exacerbation of chronic obstructive pulmonary disease. Depending on the patient’s condition, mechanical ventilation can be continued for multiple hours, days, or even weeks. The goal of mechanical ventilation is to maintain adequate oxygenation and ventilation by facilitating lung inflation, and by unloading the patient’s work of breathing.
Many different modes of mechanical ventilation exist, for example volume-control, pressure-control, or pressure-support. The different modes are classified according to three variables: the control variable (pressure or volume), breath sequence, and targeting scheme. There are three breath sequences: continuous mandatory ventilation (CMV), intermittent mandatory ventilation (IMV), and continuous spontaneous ventilation (CSV). Mandatory breaths are triggered and/or cycled by the ventilator, and spontaneous breaths are breaths for which the patient retains control over timing. During CMV no spontaneous breaths are possible, during IMV spontaneous breaths are possible between mandatory breaths, and during CSV there are no mandatory breaths. The last variable for classifying the ventilatory mode is the targeting scheme, which is a model of the relationship between operator inputs and ventilator outputs to achieve a specific ventilatory pattern. There are several types of targeting schemes, e.g. proportional ventilation. An example of proportional ventilation is neurally adjusted ventilatory assist (NAVA), which gives an inspiratory pressure proportional to the EAdi signal. In the modes of mechanical ventilation where the patient triggers breaths, the breathing effort is shared by the patient and the ventilator.
2.2.1.
P
HYSIOLOGY OF MECHANICAL VENTILATIONMechanical ventilation can partially support or completely control the patient’s breathing by applying a positive pressure to the airway. The applied positive pressure during mechanical ventilation (Pvent) differs from the negative pressure gradient necessary for normal breathing. The total pressure applied to the patient (Ptotal), or airway pressure, is the sum of Pvent and the pressure generated by the patient’s muscles (Pmus). Ptotal must overcome the opposing forces produced by the elastic and resistive properties from the respiratory system, described by the simplified equation of motion:
𝑃𝑡𝑜𝑡𝑎𝑙= 𝑃𝑣𝑒𝑛𝑡+ 𝑃𝑚𝑢𝑠 = 𝐸𝑟𝑠⋅ 𝑉 + 𝑅𝑟𝑠⋅ 𝑉̇ + 𝑃𝐸𝐸𝑃 (2) Where Ers is the elastance of the respiratory system, V is volume, Rrs is the respiratory system resistance, 𝑉̇ is flow, and PEEP is positive end-expiratory pressure.
10 When respiratory muscles are contracting, Pmus becomes a significant part of Ptotal (see equation 2). At any time, Ppl depends on Pmus and Pcw, and Pmus can be expressed as
𝑃𝑚𝑢𝑠 = 𝑃𝑐𝑤− 𝑃𝑝𝑙 (3)
Thus, Pmus must overcome the transthoracic pressure to create an inspiratory flow. The pressure generated by the diaphragm, Pdi, contributes substantially to Pmus [23].
2.2.2.
V
ENTILATOR-
INDUCED DIAPHRAGM DYSFUNCTIONAlthough mechanical ventilation is a life-sustaining modality, it also inflicts injury to the patient. One of these injuries is respiratory muscle dysfunction. Diaphragm dysfunction is highly prevalent in critically ill patients, and it is associated with a poorer prognosis and increased mortality [2, 4, 5]. Mechanical ventilation is an important contributor to development of this dysfunction. Ventilator-induced diaphragm dysfunction is defined as a time-dependent decrease of diaphragm strength after initiation of mechanical ventilation [24]. Two different mechanisms cause ventilator-induced diaphragm dysfunction: 1) disuse atrophy due to excessive ventilator support, and 2) load-induced injury due to insufficient ventilator support [3].
2.2.2.1.
D
ISUSE ATROPHY OF THE DIAPHRAGMHistological evidence for disuse atrophy of the human diaphragm was found by Levine et al. [6]. They obtained biopsy specimens of the diaphragm from 14 donors who completed 18 to 69 hours of diaphragm inactivity and mechanical ventilation, and showed marked atrophy in the diaphragm muscle fibers. Atrophy of the muscle fibers seemed specific for the diaphragm, as the pectoralis muscle was not affected by the same period of mechanical ventilation. Jaber et al. demonstrated that the force-generating capacity of the diaphragm, or diaphragm effort, deteriorated in mechanically ventilated patients at the ICU [7]. Disuse atrophy, demonstrated by a reduced diaphragm thickness using ultrasound, was associated with low respiratory effort in mechanically ventilated patients [8]. Their findings suggest that titrating ventilatory support to maintain adequate levels of effort might prevent changes in diaphragm configuration.
2.2.2.2.
L
OAD-
INDUCED DIAPHRAGM INJURYHistological evidence of load-induced diaphragm injury has not only been demonstrated in animals [9], but also in humans [10]. Orozco-Levi et al. took samples of the costal diaphragm in patients after a threshold inspiratory loading test was performed [10]. They found significantly more signs of sarcomere disruption after that test, indicating load-induced injury. Laghi et al. demonstrated a marked decrease in diaphragm contractility, or diaphragm effort, after a fatigue protocol in healthy subjects [25]. The marked decrease in contractility also indicates load-induced injury. The study of Goligher et al. not only showed reduced diaphragm thickness, but also increased diaphragm thickness [8]. This increase was found in patients associated with high inspiratory effort. The concept of increased diaphragm thickness due to an inflammatory response and fiber swelling may reflect load-induced injury.
11
2.3.
M
ONITORING DIAPHRAGM EFFORT
Monitoring diaphragm effort could help to create a diaphragm-protective ventilation strategy by finding a balance between over-assist or under-assist to prevent diaphragm dysfunction. The techniques for monitoring diaphragm effort include respiratory muscle pressure, transdiaphragmatic pressure, and electromyography of the diaphragm. Ultrasound of the diaphragm goes beyond the scope of this thesis, so it will not be discussed.
2.3.1.
R
ESPIRATORY MUSCLE PRESSURERespiratory muscle pressure (Pmus) is a part of the equation of motion (equation 2) when patients are breathing spontaneously [12]. Pmus is calculated as the difference between the static recoil pressure of the relaxed chest wall (Pcw,rel) and Ppl (see equation 3). As Ppl cannot be easily measured, esophageal pressure (Pes) is used as a surrogate.
𝑃𝑚𝑢𝑠 = 𝑃𝑐𝑤,𝑟𝑒𝑙− 𝑃𝑝𝑙≈ 𝑃𝑐𝑤,𝑟𝑒𝑙− 𝑃𝑒𝑠 (4)
Pes is measured by a pressure-conducting balloon catheter positioned in the lower two-thirds of the esophagus. Pcw,rel can be calculated by dividing tidal volume by the chest wall compliance. As the real chest wall compliance only can be obtained under passive conditions, the theoretical chest wall compliance is estimated as 4% of the predicted vital capacity [26]. Three main variables for effort can be derived using Pmus: work of breathing (WOB), pressure-time product (PTP), and tension-time index (TTI).
Work is done if there is a displacement of the point of application in the direction of the force, expressed as force × displacement [27]. In a three-dimensional system, such as the respiratory system, work is performed when a pressure changes the volume of that system. The WOB performed by the respiratory muscles equals the integral of the product of Pmus and the change in volume:
𝑊𝑂𝐵 = ∫ 𝑃𝑚𝑢𝑠⋅ 𝑑𝑉 = ∫(𝑃𝑐𝑤,𝑟𝑒𝑙− 𝑃𝑒𝑠) ⋅ 𝑑𝑉 (5)
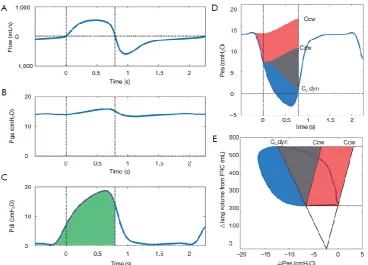
Detailed analysis of the WOB is possible using the Campbell diagram to divide work into resistive, elastic and PEEPi components, as seen in figure 2-4E [20]. The main limitation of WOB is that it is dependent of volume displacement, which makes WOB totally insensitive to isometric contraction. Next to this insensitivity, WOB does not take the duration of effort into account.
The pressure-time product (PTP) is the time-integral of Pmus, and thus circumvents the problems introduced by WOB [27].
𝑃𝑇𝑃 = ∫ 𝑃𝑚𝑢𝑠𝑑𝑡 (6)
12
FIGURE 2-4. PRESSURE-BASED ASSESSMENT OF BREATHING EFFORT DURING THE INSPIRATORY PHASE. DASHED LINES REPRESENT MOMENTS OF ZERO FLOW. (A) FLOW WAVEFORM; (B) GASTRIC PRESSURE (PGA); (C) TRANSDIAPHRAGMATIC PRESSURE (PDI), CALCULATED AS
PGA−PES. GREEN HATCHED AREA IS THE PRESSURE-TIME-PRODUCT (PTP) OF THE DIAPHRAGM DURING INSPIRATION; (D) ESOPHAGEAL
PRESSURE (PES) TRACINGS. THE COMPLIANCE OF THE CHEST WALL (CCW), ESTIMATED AT 4% OF VC, HAS BEEN SUPERIMPOSED ON PES
AT THE ONSET OF THE FALL IN PES AND AT ONSET OF INSPIRATORY FLOW GENERATION (FIRST VERTICAL LINE), TOGETHER WITH THE
DYNAMIC LUNG COMPLIANCE (CL,DYN). THE COLORED AREA COMPROMISES THE TOTAL PTP OF RESPIRATORY MUSCLE PRESSURE
(PMUS). THE RED AREA IS THE PTP ATTRIBUTED TO PEEPI, THE GRAY AREA REPRESENTS ELASTIC PTP AND THE BLUE AREA REPRESENTS
RESISTIVE PTP; (E) CAMPBELL DIAGRAM OF PES AND LUNG VOLUME. THE CCW AND CL,DYN INTERSECT AT FRC. THE RED AREA
REPRESENTS WOB ATTRIBUTED TO PEEPI, THE GRAY AREA REPRESENTS ELASTIC WOB AND THE BLUE AREA REPRESENT RESISTIVE
WOB. PEEP, POSITIVE END-EXPIRATORY PRESSURE; FRC, FUNCTIONAL RESIDUAL CAPACITY; VC, VITAL CAPACITY [20].
Another method for calculating effort is TTI, which takes the maximal inspiratory pressure that a patient can generate (Pmax) into account [20].
𝑇𝑇𝐼 =𝑃𝑃̅
𝑚𝑎𝑥⋅
𝑇𝑖
𝑇𝑡𝑜𝑡 (7)
where Ti is the inspiration time and Ttot the duration of one breath. TTI correlates well with oxygen consumption of the respiratory muscles. The advantage of TTI is that it partially corrects for reductions in muscle efficiency with the addition of Pmax. This is also the disadvantage, as Pmax is not easy to obtain in mechanically ventilated patients.
2.3.2.
T
RANSDIAPHRAGMATIC PRESSURETransdiaphragmatic pressure (Pdi) is a specific measurement of diaphragm activity and can be calculated as the difference between Pab and Ppl (equation 1) [12]. As these pressures cannot be easily measured, two surrogates are used: gastric (Pga) and esophageal pressure (Pes).
13 Pga and Pes are measured by pressure-conducting balloons attached to a nasogastric tube. The estimated Pdi is a promising parameter for monitoring the diaphragm in clinical practice. Unfortunately, the measurements of Pes and Pga mainly remain a research tool due to technical issues, such as proper placement of the esophageal catheter, the feasibility of obtaining accurate measurements, and the interpretation of measurements [12, 30].
The PTP of the diaphragm (PTPdi) can also be constructed as a specific measurement of diaphragm effort, as seen in figure 2-4C. PTPdi correlates well with oxygen expenditure of the diaphragm [31], and it can be used as an estimate of oxygen consumption of the respiratory muscles [32].
Both Pmus and Pdi have the disadvantage that a balloon catheter is needed to measure diaphragm effort. Furthermore, the interpretation of these pressures require extensive training and sufficient understanding of the respiratory physiology [12, 13]. These disadvantages limit the use of Pmus and Pdi to monitor diaphragm effort in clinical practice.
2.3.4.
E
LECTRICAL ACTIVITY OF THE DIAPHRAGMDiaphragm electromyography (EMG) could be a promising tool for monitoring diaphragm effort. The EMG of the diaphragm can be recorded by surface electrodes, or by an array of multiple electrodes fitted on a nasogastric tube. The electrodes on a tube are positioned near the crural diaphragm (see figure 2-1). Within this region, the electrodes record the spatiotemporal summation of action potentials from asynchronously firing motor units: the diaphragm EMG, or EMGdi [33].
[image:13.595.73.357.418.701.2]14 The usefulness of EMGdi depends on a signal of significant strength, which is sufficiently free of artefacts. The EMGdi signal can be of insufficient strength, as it gets filtered by e.g. the distance between the muscle and the recording electrodes, or the orientation of the electrodes with respect to the fiber direction [35]. Furthermore, the EMGdi is contaminated by noise, cross talk from muscles adjacent to the diaphragm (e.g. heart, esophagus), and electrode motion-induced artefacts.
Certain methods can be used to reduce the artefacts in EMGdi [36]. Esophageal peristalsis and electrode motion are both easy to deal with using a high-pass filter of approximately 20Hz [36]. The effects of different filtering of the diaphragm EMG, due to relative changes in position of the electrodes to the active region of the diaphragm, is reduced by the double-subtraction method [34]. They subtracted the EMGdi from electrode pairs directly caudal and cephalad to the center of the active region (EARdi), thereby subtracting noise but summing the EMGdi signal (see figure 2-5 for detailed description). One of the biggest challenges of artefact reduction from the EMGdi is removing the superimposed activity of the heart (ECG). Methods for eliminating ECG include deleting EMG and QRS complexes for approximately 0.4s around the QRS complex, zeroing the signal and replacing it with adjacent EMG activity, subtracting an ECG template, or using an adaptive wavelet-based filter [36-38]. The root mean square (RMS) of the clean EMGdi is calculated to obtain an EAdi signal. The RMS reflects the number and firing rate of the recruited motor units, and it has been demonstrated to be independent of change in lung volume and a reliable index for global diaphragm activation [17, 39, 40]. The EAdi signal is already used in clinical care, as a monitoring tool or as a control variable for NAVA [33].
2.3.4.1.
R
ELATIONSHIP BETWEENP
DI ANDEA
DIEAdi represents the neural respiratory drive, and not diaphragm effort. To fully understand how EAdi can be a tool for effort, we will discuss the essentials of the anatomy and physiology concerning motor units and the recording of their firing. A motor unit is comprised of a single motor neuron, its terminal branches and the muscle fibers it innervates [41]. The EMG signal is a representation of the electric potential field generated by the depolarization of a sarcolemma (outer muscle fiber membrane), and a spatiotemporal summation of muscle fiber action potentials. The amplitude of the EMG depends on the number of active motor units and their firing rates, and force production of a muscle is also regulated by these mechanisms. Thus it is expected muscle force may be estimated from the EMG signal. As pressure is defined as force per unit area, the Pdi may be predicted using EMG of the diaphragm.
15
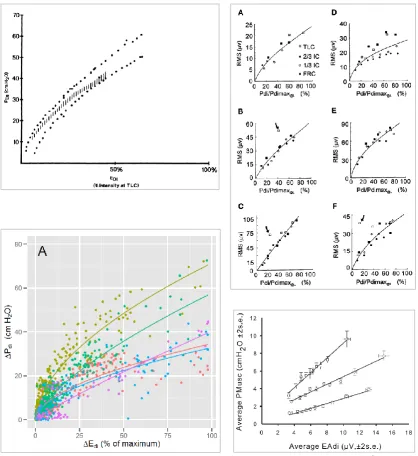
FIGURE 2-6. OVERVIEW OF ALREADY FOUND RELATIONSHIPS BETWEEN ELECTRICAL ACTIVITY OF THE DIAPHRAGM (EADI, EDI, OR RMS) AND TRANSDIAPHRAGMATIC PRESSURE (PDI) OR RESPIRATORY MUSCLE PRESSURE (PMUS). THE UPPERLEFT GRAPH SHOWS THE CURVILINEAR PDI-EADI RELATIONSHIP FOUND BY GOLDMAN ET AL. [42]. THE UPPER LEFT GRAPHS SHOW THE CURVILINEAR PDI-EADI RELATIONSHIP FOR EACH SUBJECT FOUND BY BECK ET AL. THE RELATIONSHIPS WERE DESCRIBED BY SECOND ORDER POLYNOMIALS THROUGH THE ORIGIN [17]. THE LOWER LEFT CORNER SHOWS THE CURVILINEAR PDI-EADI RELATIONSHIPS FOUND BY GOLIGHER ET AL. EACH COLOR REPRESENTS A DIFFERENT SUBJECT, AND THE RELATIONSHIPS WERE FITTED WITH PDI = A*EADIB [29]. THE LOWER RIGHT GRAPH SHOWS THE LINEAR PDI-EADI RELATIONSHIP FOUND BY BELLANI ET AL, OBTAINED IN A LOW AND SMALL RANGE OF BREATHING EFFORT [18].
16 described by Pdi = a*EAdib. They showed this relationship is influenced by diaphragmatic motion,
described as ∆Pga/∆Pdi, and inspiratory flow. These two variables are in agreement with what Grassino et al. found as described above [42, 43]. All the Pdi-EAdi relationships found by these studies are shown in figure 2-6.
One study, by Bellani et al., showed a tight linear relationship between Pmus and EAdi in mechanically ventilated patients in a small range of effort (Pmus ranged from 0 to 10 cmH2O, see figure 2-6) [18]. They showed the slope (Pmus/EAdi) is very heterogeneous between patients. This heterogeneity between subjects was also seen in the previously mentioned studies [17, 29, 42, 43]. Bellani et al. predicted the slope in the Pmus-EAdi relationship per patient using Pmo/EAdi during an occlusion, which enabled an EAdi-based estimate of Pmus [18]. The validity of using Pmo/EAdi is entirely based on a linear relationship between Pmus and EAdi, but most previous studies suggest there is a curvilinear relationship. Further research is required to demonstrate how the EAdi signal can be used to predict diaphragm effort.
17
C
HAPTER
3.
M
ETHODS
3.1.
S
TUDY DESIGN AND POPULATION
This physiological study was performed at the department of Intensive Care Adults of the Amsterdam UMC, location VUmc, Amsterdam, the Netherlands. 23 healthy subjects (≥ 18 years) participated in this study after given written informed consent in accordance with VU Medical Center Medical Ethical Committee. All participants were screened for presence of exclusion criteria via a short medical history questionnaire, a physical examination and an electrocardiogram. The exclusion criteria were a history of cardiac and/or pulmonary diseases, current cardiac/pulmonary symptoms, history of pneumothorax, and contra-indications for nasogastric tube placement and for magnetic stimulation.
3.2.
D
ATA ACQUISITION
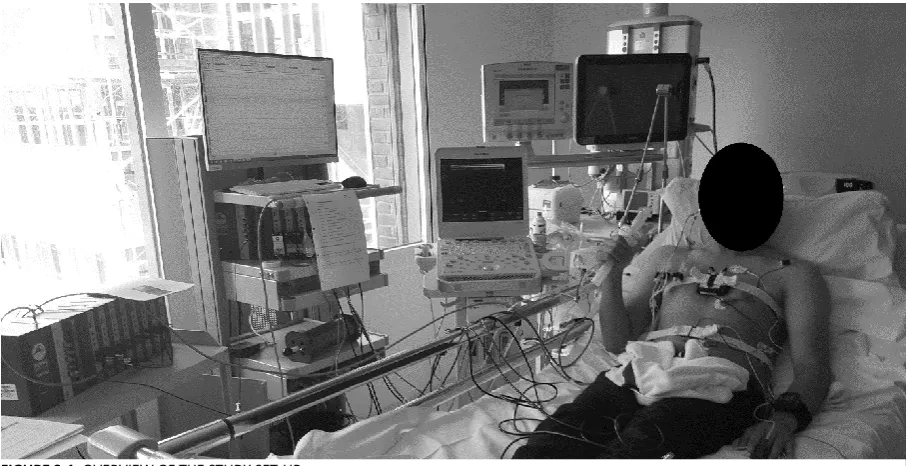
[image:17.595.71.526.519.752.2]Participants were instrumented with two nasogastric catheters to measure the esophageal and gastric pressure (Nutrivent, Sidam, Mirandola, Italy), and the electrical activity of the diaphragm (EAdi-catheter, Maquet Critical Care, Solna, Sweden). Both catheters were positioned according to clinical protocol [26]. Flow was measured with a pneumotachograph (Adult Flow Sensor, Hamilton Medical, Bonaduz, Switzerland) and mouth pressure (Pmo) was measured via a side port on the mouthpiece. EMG surface electrodes were placed on several accessory respiratory muscles: the left parasternalis muscle, rectus abdominis muscle, and external oblique muscle. Respiratory inductance plethysmography (RIP) belts were used to determine chest wall and abdominal displacement. All signals, except for RIP, were acquired using a CE-certified measurement set-up (BIOPAC MP160, BIOPAC Systems Inc., Goleta, California, USA) with a sampling frequency of 2000 Hz. Data was stored on the hard drive for offline analysis. An overview of the set-up is seen in figure 3-1.
18
3.3.
S
TUDY PROTOCOL
In all included subjects, EAdi and Pdi were measured in the entire physiological range of effort as follows. Initially, subjects were asked to breathe quietly through the pneumotachograph to establish a baseline measurement of their diaphragm effort. Magnetic bilateral anterolateral of the phrenic nerves was performed according to clinical protocol (ATS/ERS) using MagStim 2002 stimulators
(Magstim Co Ltd., Whitland, UK) to obtain an objective measurement of diaphragm strength. For determination of the entire physiological range of effort, maximal inspiratory transdiaphragmatic pressure (Pdi,max) was achieved using five different maneuvers: an inspiratory hold and a sniff at functional residual capacity (FRC) and residual volume (RV), and an inspiratory hold while contracting the abdominal muscles. Each maneuver was repeated three times, and the highest observed value was selected as Pdi,max.
Next, a threshold loading device (POWERbreathe Medic, POWERbreath Internation Ltd., Warwickshire, UK) was connected to the pneumotachograph. The threshold was adjusted to obtain multiple levels of diaphragm effort: 10%, 20%, 30%, 40%, 50%, 60%, and 80% of Pdi,max. At least 12 breaths per level were recorded. Subjects could rest between loaded breaths to prevent development of fatigue. After the loading protocol, magnetic stimulation was performed again to ensure no fatigue was developed. An overview of the entire study procedure is shown in figure 3-2.
[image:18.595.78.399.363.731.2]19
3.4.
D
ATA ANALYSIS
All data were analyzed offline using MatLab (version R2016b, MathWorks Inc., Natick, MA, USA). The pre-analysis of the signals included removing flow offset, selection of breaths, and EAdi signal processing. The signals of the surface EMG and RIP were not analyzed due to time limitation of the internship. The breaths were visually selected by excluding esophageal spasms or artifacts in the EAdi signal (see an example in supplement).
3.4.1.
EA
DI SIGNAL PROCESSINGAll EMGdi signals were band pass filtered from 30-400Hz. The double-subtraction method was used to enhance signal-to-noise ratio and to lower the influence of distance filtering [34]. To remove remaining ECG artifacts from EMGdi, an average template subtraction method was conducted, and afterwards the wavelet-based adaptive filter was applied [37, 38]. For detailed description of the ECG removal, read the supplement. Ultimately, the EAdi was calculated as the root mean square of EMGdi by rectifying the signal and applying a moving average filter with a window of 250ms.
3.4.2.
O
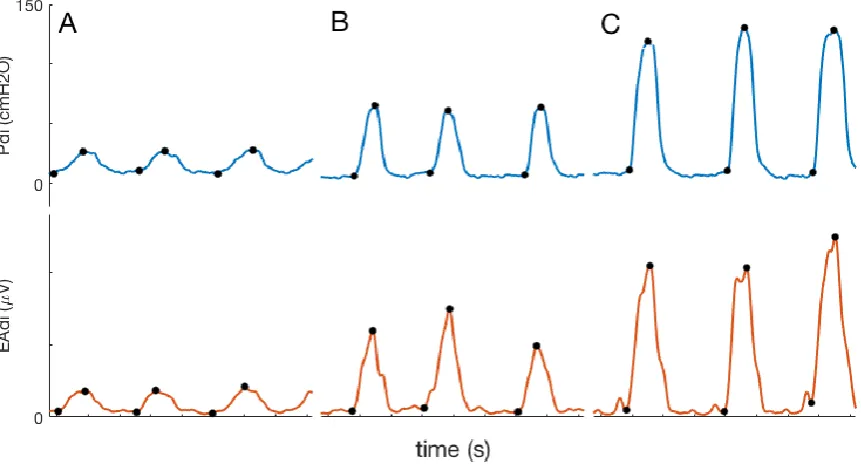
BTAINING VARIABLES [image:19.595.78.509.472.704.2]After the EAdi signal processing, the amplitudes in Pdi and in EAdi (∆Pdi, ∆EAdi) were calculated on a breath-by-breath basis using a software routine in MatLab. All signals were filtered using a low-pass second order Butterworth filter with a cutoff frequency of 10Hz, to remove high frequency noise. The peak and starting points were obtained to calculate the amplitude of both Pdi and EAdi, as seen in figure 3-3.
20
3.4.3.
R
ELATIONSHIP BETWEEN∆EA
DI AND∆P
DIThe relationship between ∆Pdi and ∆EAdi was assessed per subject, as we expected the relationship between EAdi and Pdi to be very heterogeneous among subjects [17, 18, 32, 42]. Both linear and curvilinear regression models were assessed per subject and the best fit was chosen using the following models:
Δ𝑃𝑑𝑖 = 𝑎 ∗ Δ𝐸𝐴𝑑𝑖 (8)
Δ𝑃𝑑𝑖 = 𝑎 ∗ Δ𝐸𝐴𝑑𝑖 + 𝑏 ∗ Δ𝐸𝐴𝑑𝑖2 (9)
The data of some subjects seem to show that the relationships between EAdi and Pdi appear linear up until a certain value of Pdi or EAdi (see e.g. S16 in figure 4-1). Therefore, a cutoff value for both EAdi and Pdi was determined using the following method. First, multiple cutoff values were determined ranging from 30% up to 100% of the signal in steps of 5 cmH2O or 5 µV. Linear regression was performed for every cutoff value, each time only including the breaths below the cutoff value. Finally, the cutoff value with the best fit was used as the cutoff value for Pdi or EAdi. As we want to predict Pdi by using EAdi, the slopes of the linear regression using a cutoff value of EAdi were considered to be true.
3.4.4.
P
REDICTING THE RELATIONSHIP USING A CONVERSION FACTORFor the prediction of Pdi without the use of balloon catheters, the slope derived from our linear regression model was predicted using other available variables. We calculated different conversion factors using the drop in Pmo during an occlusion, as it is already available on the ventilator, and it is used by Bellani et al. as a conversion factor [18]. The drop in Pmo (∆Pmo) was used as a surrogate for the rise in Pdi in the following conversion factors:
Median ∆Pmo/∆EAdi after magnetic stimulation (figure 3-4A)
Median ∆Pmo/∆EAdi during maximal inspiratory pressure maneuvers (figure 3-4B)
Median P0.1/EAdiP0.1 in 10% loading level (figure 3-4C)
Median P0.1/EAdi0.1 in 10% loading level (figure 3-4D)
Where P0.1 is the first 100ms drop of Pmo per breath, EAdiP0.1 is the rise in EAdi during the same time
21
3.5.
S
TATISTICS
Statistical analysis was performed in MatLab. Data are summarized as mean ± standard deviation unless otherwise specified. Statistical significance was indicated by a p value <0.05. As stated above, linear regression was used to assess the correlations. The F-test of overall significance was used to test if linear regression provides a better fit to the data than the mean of the data. Curvilinearity was determined by looking at the residual plots. A best fit, or the best correlation, was determined as the highest value of the coefficient of determination (r2). r2 above 0.7 was considered a strong correlation,
[image:21.595.107.484.116.390.2]between 0.5 and 0.7 a moderate correlation, and between 0.3 and 0.5 a weak correlation.
22
C
HAPTER
4.
R
ESULTS
[image:22.595.72.523.329.568.2]23 healthy subjects were recruited for this study. Three subjects were excluded due to the inability to position the nasogastric catheters. Four subjects were excluded due to a low signal to noise ratio of the EAdi signal, and in one subject data was not saved due to technical difficulties. The baseline characteristics of the remaining fifteen subjects are detailed in table 4-1. Subjects were mostly young adults with a normal BMI, and their Pdi,max is comparable to reference values [26]. In two subjects, the baseline of breathing was not recorded and in one subject no breaths were selected in the 10% loading level.
Table 4-1. Baseline characteristics of subjects.
Subject Age (yr) Gender BMI (kg/m2) Pdi,max (cmH2O) EAdi,max (µV)
S01 32 F 23.8 105 50
S02 32 F 24.8 105 243
S03 28 F 22.5 68 280
S08 27 F 20.3 119 70
S09 39 M 23.9 158 75
S11 25 M 20.9 59 131
S12 23 M 19.9 135 123
S13 24 M 24.1 180 140
S14 43 M 22.0 194 180
S16 31 F 21.1 165 210
S17 26 M 24.9 149 112
S20 26 F 22.1 60 75
S21 24 F 22.5 145 291
S22 28 F 20.4 69 100
S23 29 M 23.4 159 275
Mean±SD 29±5.6 F (8/15) 22.4±1.7 125±45 157±83
BMI = body mass index; EAdi,max = maximal electrical activity of the diaphragm obtained during measurements; F = female; M = male; Pdi,max = maximal transdiaphragmatic pressure; SD = standard deviation; yr = years
4.1.
R
ELATIONSHIP BETWEEN
∆EA
DI AND
∆P
DI
On average, a moderate linear correlation was found between EAdi and Pdi within each subject (r2 of
0.66±0.16), see table 4-2. Six out of fifteen subjects already had a strong correlation. Nine out of fifteen subjects had a moderate or even weak correlation suggesting a linear regression using all breaths is not the best fit. When using a second order polynomial, the value of r2 increased minimally but not
significantly (r2 of 0.68±0.17, p = 0.353; see supplement) suggesting a second order polynomial does
23 A curvilinear relationship between EAdi and Pdi was found in four subjects, e.g. S16 in figure 4-1 (for correlations and residual plots of other subjects, see supplement). S16 in figure 4-1 demonstrates that the relationship may be linear up until a certain Pdi value. Therefore, we examined if the correlation improved when a cutoff value of Pdi was used. In all subjects, except for two subjects, r2 significantly
improved when a cutoff value of Pdi was used (from r2 of 0.66±0.16 to 0.81±0.10, p < 0.05; see table
4-2). Only three out of fifteen subjects had a moderate correlation, and the rest showed a strong correlation. The linear regression with a Pdi cutoff on average took 69±22% of the number of breaths into account, and the value of Pdi cutoff was 59±21% of maximal obtained Pdi.
As the aim of this study was to predict diaphragm effort, or Pdi, by EAdi, we evaluated if a cutoff EAdi would improve the coefficient of determination. R2 increased in five out of fifteen subjects compared
to r2 without a cutoff value (see table 4-2). Overall r2 increased minimally and not significantly from
0.66±0.16 to 0.68±0.16 (p = 0.140). On average, the linear regression with an EAdi cutoff took 60±31% of the number of breaths into account, and the value of EAdi cutoff was 69±10% of maximal obtained EAdi. The slope of the linear correlations with the EAdi cutoff value is heterogeneous among subjects, ranging from 0.39 to 1.77 cmH2O/µV with a median of 0.80 cmH2O/µV. Three of these linear correlations in different subjects are shown in figure 4-1 (for correlations of other subjects, see supplement).
[image:23.595.90.489.88.412.2]24
4.2.
P
REDICTING THE RELATIONSHIP USING A CONVERSION FACTOR
The calculated conversion factors are not in agreement with the slope, as seen in the scatter around the line of identity in all the plots in figure 4-2 (r2<0.10, read caption for p values). This suggests the
[image:24.595.75.510.190.567.2]calculated conversion factors cannot predict the slope determined using an EAdi cutoff value.
25 Tab le 4 -2. A ll linear re gr e ss io n p er su b jec t. Wh en th e coef fi cie n t o f d ete rm in at ion d id n o t im p ro ve u sin g a cu to ff v alu e, n o v alu e s ar e s h o w n f o r th at s u b jec t in th e corres p o n d in g co lu m n . All cor re lat ion s h av e a p v alu
e < 0.
0 5. Al l br eat h s Cu to ff P d i Cu to ff EA di Su b jec t Sl o p e (c m H 2 O /µ V) r 2 n Sl o p e (c m H 2 O /µ V) r 2 Cu to ff P d i (c m H 2 O) n Sl o p e (c m H 2 O /µ V) r 2 Cu to ff EAd i (µ V) n S01 1. 61 0. 57 79 1. 43 0. 67 80 75 S02 0. 38 0. 51 79 0. 19 0. 73 40 30 0. 40 0. 54 1 50 32 S03 0. 39 0. 67 1 1 8 0. 32 0. 80 60 79 S08 1. 32 0. 5 1 84 1. 05 0. 58 55 64 S09 1. 77 0. 83 78 1. 39 0. 92 85 48 S11 0. 53 0. 66 88 0. 43 0. 87 50 61 0. 55 0. 84 85 32 S12 0. 87 0. 36 88 0. 54 0. 89 60 38 0. 99 0. 39 90 31 S13 1. 19 0. 69 67 S14 0. 98 0. 57 87 0. 65 0. 90 90 39 S16 0. 66 0. 50 1 3 1 0. 40 0. 94 45 49 S17 1. 16 0. 84 1 7 9 1. 22 0. 84 1 3 0 1 77 1. 28 0. 85 95 1 70 S20 0. 80 0. 71 1 3 2 0. 60 0. 79 30 91 S21 0. 67 0. 84 1 1 9 0. 71 0. 86 1 2 0 1 18 0. 77 0. 87 1 80 1 10 S22 0. 74 0. 77 1 5 0 0. 58 0. 83 30 1 04 S23 0. 50 0. 90 1 5 1 EAd
i = e
le ctri cal act iv ity o f t h e d iap h ra gm ; n = a m o u n t o f d at a p o in ts for linear re gr es sion ; r
2 =
P ear so n ’s co rre lat ion co e ff ici en t; P d
i = t
26
C
HAPTER
5.
D
ISCUSSION
The aim of this study was to quantify diaphragm effort using EAdi. This study shows that we are not yet able to quantify the entire physiological range of diaphragm effort using EAdi in healthy subjects. We found that the relationship between EAdi and Pdi in the entire physiological range of effort could be described as linear in seven out of fifteen subjects (r2 > 0.7) when using a cutoff value for EAdi. The
slopes of the relationship, using an EAdi cutoff or when the fit did not improve all breaths, were very heterogeneous among subjects (0.39-1.77 cmH2O/µV), but could not be predicted by the conversion factors we calculated using Pmo.
5.1.
R
ELATIONSHIP BETWEEN
∆EA
DI AND
∆P
DI
We found a linear relationship between EAdi and Pdi in most healthy subjects, but in four the relationship seemed curvilinear. We tried to find out by visually inspecting our data if subjects with a curvilinear relationship used a different breathing pattern than subjects with a linear relationship. As mentioned in section 2.2.1 and 2.3.4.1, the length of the diaphragm (force-length relationship) and velocity of shortening of the diaphragm (force-velocity relationship) determine how much Pdi a contraction generates at a given EAdi, which can be reflected by a different breathing pattern [42, 43]. The length of the diaphragm differs if the configuration of thorax and abdomen differs. We tried to find the differences in configuration by looking at the EMG of the accessory muscles, as these influence abdominothoracic configuration. No differences between accessory EMG activity in subjects with a clear linearity and in subjects with a clear curvilinearity were found (data not shown). A better approach would be to analyze RIP for changes in abdominothoracic configurations or to calculate diaphragmatic motion using the Gilbert index (∆Pga/∆Pdi) in a subject and between subjects to determine if the force-length relationship influences the shape of the Pdi-EAdi relationship. Both abdominothoracic configuration and the Gilbert index have already been linked to the Pdi-EAdi relationship in previous studies [29, 43].
The velocity of diaphragm shortening determines the amount of inspiratory flow. Goldman et al. showed that for a given EAdi, a high inspiratory flow results in a lower Pdi than a low inspiratory flow [42]. It could be that the subjects showing curvilinearity obtained a high inspiratory flow during low ranges of Pdi, and a low inspiratory flow in the higher ranges of Pdi. The high inspiratory flow would need the same EAdi to obtain a lower Pdi than the low inspiratory flow would need. A visual inspection of changes in peak flow also did not explain the linearity or curvilinearity of the Pdi-EAdi relationship (data not shown), but it could be further analysis with e.g. mean inspiratory flow per breath would provide more insight. The mean inspiratory flow has already been linked to the Pdi-EAdi relationship [29].
27 describe this curvilinearity by a second order polynomial, as this was substantiated theoretically and demonstrated by Beck et al., but this did not result in a better fit (see supplement, table S2-1) [17]. We have not tried other functions yet, e.g. a sigmoid or Pdi = a*EAdib. As the curvilinear relationships
between EAdi and Pdi mostly show a plateau of EAdi, we do not expect that these functions would result in a better fit.
An interesting finding is that in a smaller range of diaphragm effort, thus using a cutoff value of Pdi, the Pdi-EAdi relationship could be presumed linear in twelve out of fifteen subjects (r2 > 0.7, see table
4-2). This is in alignment with earlier studies where a linear relationship was found in a very small range of diaphragm effort [18, 44]. Bellani et al. even found similar mean and standard deviation of r2 for the
relationship between Pmus and EAdi. They suggested the slope of this relationship could be predicted by using Pmo/EAdi during an occlusion [18]. In our data, the slope of the smaller range of effort would predict only one value of Pdi, explained as follows. Looking at S16 in figure 4-2, an EAdi value of approximately 90 µV could result in a Pdi between 36 cmH2O and 120 cmH2O. If we tried to predict these values by using the slope determined with a Pdi cutoff value, only 36 cmH2O (90µV*0.40cmH2O/µV, table 4-2) would be found. This shows that Pdi cannot be estimated by only using EAdi and the slope found by a linear regression.
5.2.
C
ONVERSION FACTORS
Conversion factors using Pmo were calculated to estimate diaphragm effort, or Pdi, without the use of balloon catheters. The calculated conversion factors did not correlate with the slopes calculated using an EAdi cutoff. ∆Pmo/∆EAdi after magnetic stimulation seemed to be the most promising conversion factor with the highest coefficient of determination, but r2 was still very low and also insignificant.
Therefore, no conversion factors were used to calculate an EAdi-based estimate of Pdi.
A few reasons for the variation and the bad correlation between slope and conversion factors is explained below. ∆Pmo/∆EAdi after magnetic stimulation was not used, as the EAdi signal was probably influenced by the magnetic stimulation artefact (data not shown). During a maximal inspiratory pressure maneuver, accessory inspiratory muscles were recruited as well, which influenced the drop in Pmo but not the rise in Pdi. Therefore, most values of ∆Pmo/∆EAdi during maximal inspiratory pressure maneuvers were above the identity line in figure 4-2B. The variation in that conversion factor could probably be explained by the variation of accessory muscle recruitment between subjects. The conversion factor P0.1/EAdiP0.1 used an EAdi value at the same time points as
the drop in mouth pressure. EAdi rises earlier than Pmo would drop, and in some instances the EAdi value was taken around the maximum value of EAdi (data not shown). In P0.1/EAdi0.1 most values were above the identity line because EAdi rises slower than Pmo drops (figure 4-2D).
28
5.3.
S
TRENGTHS AND LIMITATIONS
One of the strengths of this study is that we calculated EAdi from EMGdi using our own analysis, which enables more complex analysis of the EAdi signal. If we would have used the EAdi signal provided by Servo-I ventilators, we could not determine where the waveform irregularities, that the EAdi signal sometime contains, would originate from [45]. Furthermore, if the EAdi signal we calculated contained any irregularities, we could check on the raw EMGdi to know if it originates from noise or ECG artefacts. Another strength is the fact that we could analyze the entire range of diaphragm effort, because we used healthy subjects instead of patients. Furthermore, we did not control abdominothoracic configuration, as mechanically ventilated patients are able to breath with different breathing patterns as well.
A limitation is that we tried to predict diaphragm effort by searching for the relationship between EAdi and Pdi. Diaphragm effort, or the oxygen consumption of the diaphragm, is better correlated with PTPdi [29]. It could be possible to calculate PTPdi from an EAdi-based estimate of Pdi (PdiEAdi), using
inspiratory time (Ti) in ½*PdiEAdi*Ti.
Another limitation is that we wanted to vary Pdi to get the entire range of diaphragm effort using inspiratory threshold loading. Inspiratory threshold loading is a device at the mouth opening, thus Pmo was varied instead of Pdi. In some subjects, this resulted in some missing values in the medium range of Pdi (see supplement).
5.4.
C
LINICAL IMPLICATIONS
At this moment, our study shows Pdi cannot be estimated simply using an EAdi amplitude and the drop in Pmo during an occlusion. The relationship between Pdi and EAdi is more complicated than linear regression, and the influences of the force-length and force-velocity relationships probably should be taken into account by looking at diaphragmatic motion (∆Pga/∆Pdi or RIP analysis) and inspiratory flow. However, if diaphragmatic motion and inspiratory flow remain the same in each breath, and the patient shows a low EAdi with no outward display of respiratory distress, the method of Bellani et al. may give a good EAdi-based estimate of Pmus.
5.5.
F
UTURE DIRECTIONS
29 Another future direction could be to correlate Pmus to EAdi. The Pmus-EAdi relationship may show similar coefficients of determination as the Pdi-EAdi relationship. An important benefit of using Pmus over Pdi, is that during an occlusion the drop in Pmo equals the amplitude of Pmus, which gives a better rationale for using our calculated conversion factors. Furthermore, Pmus reflects breathing effort, instead of only diaphragm effort (Pdi).
A simple model of the respiratory system can also be used to find variables that influence the Pdi-EAdi relationship. A series of papers from 1981 seemed to have already described a model for the relationship between respiratory neural and mechanical outputs [46-48]. The model is mainly dependent on volume and configuration (force-length relationship), and flow-related pressure losses (force-velocity relationship) during inspiratory activity. It was based on an extensive literature research and uncertainties were checked by performing their own experiments. They validated the model in 21 patients, and showed their model obtained good agreement between predicted and observed variables. The actual model predicted volume and flow from occlusion pressure waveforms, and assumed occlusion pressure is proportional to the inspiratory electrical activity. This study has showed that we cannot assume Pdi to be proportional to EAdi, so the mathematical model described above is not correct for our measurements. We have not yet found other mathematical models to describe the Pdi-EAdi relationship, so we should have to design our own model to find variables that influence the Pdi-EAdi relationship.
5.6.
C
ONCLUSION
30
R
EFERENCES
1. O. Benditt, J., Evaluation of Respiratory Muscles in the Intensive Care Unit. Vol. 2. 1995. 286-294.
2. Goligher, E.C., et al., Mechanical Ventilation-induced Diaphragm Atrophy Strongly Impacts Clinical
Outcomes. Am J Respir Crit Care Med, 2018. 197(2): p. 204-213.
3. Dres, M., et al., Critical illness-associated diaphragm weakness. Intensive Care Med, 2017. 43(10): p.
1441-1452.
4. Demoule, A., et al., Diaphragm dysfunction on admission to the intensive care unit. Prevalence, risk
factors, and prognostic impact-a prospective study. Am J Respir Crit Care Med, 2013. 188(2): p. 213-9.
5. Supinski, G.S. and L.A. Callahan, Diaphragm weakness in mechanically ventilated critically ill patients.
Critical care, 2013. 17(3): p. R120.
6. Levine, S., et al., Rapid disuse atrophy of diaphragm fibers in mechanically ventilated humans. New
England Journal of Medicine, 2008. 358(13): p. 1327-1335.
7. Jaber, S., et al., Rapidly progressive diaphragmatic weakness and injury during mechanical ventilation in
humans. Am J Respir Crit Care Med, 2011. 183(3): p. 364-71.
8. Goligher, E.C., et al., Evolution of Diaphragm Thickness during Mechanical Ventilation. Impact of
Inspiratory Effort. Am J Respir Crit Care Med, 2015. 192(9): p. 1080-8.
9. JIANG, T.-X., et al., Load dependence of secondary diaphragm inflammation and injury after acute
inspiratory loading. American journal of respiratory and critical care medicine, 1998. 157(1): p. 230-236.
10. Orozco-Levi, M., et al., Injury of the human diaphragm associated with exertion and chronic obstructive
pulmonary disease. American journal of respiratory and critical care medicine, 2001. 164(9): p. 1734-1739.
11. Doorduin, J., et al., Monitoring of the respiratory muscles in the critically ill. Am J Respir Crit Care Med,
2013. 187(1): p. 20-7.
12. Akoumianaki, E., et al., The application of esophageal pressure measurement in patients with respiratory
failure. Am J Respir Crit Care Med, 2014. 189(5): p. 520-31.
13. Mauri, T., et al., Esophageal and transpulmonary pressure in the clinical setting: meaning, usefulness
and perspectives. Intensive Care Med, 2016. 42(9): p. 1360-73.
14. Heunks, L.M., J. Doorduin, and J.G. van der Hoeven, Monitoring and preventing diaphragm injury. Curr
Opin Crit Care, 2015. 21(1): p. 34-41.
15. Bellani, G. and A. Pesenti, Assessing effort and work of breathing. Curr Opin Crit Care, 2014. 20(3): p.
352-8.
16. de Vries, H., et al., Assessing breathing effort in mechanical ventilation: physiology and clinical
implications. Annals of Translational Medicine, 2018.
17. Beck, J., et al., Effects of lung volume on diaphragm EMG signal strength during voluntary contractions.
Journal of Applied Physiology, 1998. 85(3): p. 1123-1134.
18. Bellani, G., et al., Estimation of patient's inspiratory effort from the electrical activity of the diaphragm.
Crit Care Med, 2013. 41(6): p. 1483-91.
19. Boron, W.F. and E.L. Boulpaep, Medical physiology : a cellular and molecular approach. 1st ed. ed. 2003,
Philadelphia, PA: W.B. Saunders.
20. de Vries, H., et al., Assessing breathing effort in mechanical ventilation: physiology and clinical
implications. Ann Transl Med, 2018. 6(19): p. 387.
21. Cook, M.S. and A.J. Weinhaus, Anatomy of the Thoracic Wall, Pulmonary Cavities, and Mediastinum, in
Handbook of Cardiac Anatomy, Physiology, and Devices, P.A. Iaizzo, Editor. 2015, Springer International Publishing: Cham. p. 35-60.
22. Braun, N., N.S. Arora, and D.F. Rochester, Force-length relationship of the normal human diaphragm.
Journal of Applied Physiology, 1982. 53(2): p. 405-412.
23. Kondili, E., et al., Estimation of inspiratory muscle pressure in critically ill patients. Intensive care
medicine, 2010. 36(4): p. 648-655.
24. Petrof, B.J., S. Jaber, and S. Matecki, Ventilator-induced diaphragmatic dysfunction. Curr Opin Crit Care,
2010. 16(1): p. 19-25.
25. Laghi, F., NAVA: brain over machine? Intensive Care Med, 2008. 34(11): p. 1966-8.
26. American Thoracic Society/European Respiratory, S., ATS/ERS Statement on respiratory muscle testing.
31
27. Tobin, M.J., Principles and Practice of Intensive Care Monitoring. 1998: McGraw-Hill, Health Professions
Division.
28. Collett, P., C. Perry, and L. Engel, Pressure-time product, flow, and oxygen cost of resistive breathing in
humans. Journal of Applied Physiology, 1985. 58(4): p. 1263-1272.
29. Goligher, E.C., Diaphragm Activity and Function During Mechanical Ventilation. 2016.
30. Brochard, L., A. Slutsky, and A. Pesenti, Mechanical Ventilation to Minimize Progression of Lung Injury
in Acute Respiratory Failure. Am J Respir Crit Care Med, 2017. 195(4): p. 438-442.
31. Soust, M., A. Walker, and P. Berger, Diaphragm VO2, diaphragm EMG, pressure-time product and
calculated ventilation in newborn lambs during hypercapnic hyperpnoea. Respiration physiology, 1989.
76(1): p. 107-117.
32. Fauroux, B., et al., Measurement of diaphragm loading during pressure support ventilation. Intensive
Care Med, 2003. 29(11): p. 1960-6.
33. Sinderby, C., et al., Neural control of mechanical ventilation in respiratory failure. Nat Med, 1999. 5(12):
p. 1433-6.
34. Sinderby, C.A., et al., Enhancement of signal quality in esophageal recordings of diaphragm EMG. Journal
of Applied Physiology, 1997. 82(4): p. 1370-1377.
35. Sinderby, C., L. Lindstrom, and A. Grassino, Automatic assessment of electromyogram quality. Journal
of Applied Physiology, 1995. 79(5): p. 1803-1815.
36. Luo, Y.M., J. Moxham, and M.I. Polkey, Diaphragm electromyography using an oesophageal catheter:
current concepts. Clin Sci (Lond), 2008. 115(8): p. 233-44.
37. Zhan, C., L.F. Yeung, and Z. Yang, A wavelet-based adaptive filter for removing ECG interference in EMGdi
signals. J Electromyogr Kinesiol, 2010. 20(3): p. 542-9.
38. Costa Junior, J.D., J.M. de Seixas, and A.M.F.L. Miranda de Sá, A template subtraction method for
reducing electrocardiographic artifacts in EMG signals of low intensity. Biomedical Signal Processing and
Control, 2019. 47: p. 380-386.
39. Beck, J., et al., Electrical activity of the diaphragm during pressure support ventilation in acute
respiratory failure. American Journal of Respiratory and Critical Care Medicine, 2001. 164(3): p. 419-424.
40. Sinderby, C., et al., Voluntary activation of the human diaphragm in health and disease. Journal of
Applied Physiology, 1998. 85(6): p. 2146-2158.
41. Farina, D., D.F. Stegeman, and R. Merletti, Biophysics of the Generation of EMG Signals, in Surface
Electromyography : Physiology, Engineering, and Applications.
42. Goldman, M., et al., Mechanics of the human diaphragm during voluntary contraction: dynamics. Journal
of Applied Physiology, 1978. 44(6): p. 840-848.
43. Grassino, A., et al., Mechanics of the human diaphragm during voluntary contraction: statics. Journal of
Applied Physiology, 1978. 44(6): p. 829-839.
44. Grasselli, G., et al., Assessment of patient–ventilator breath contribution during neurally adjusted
ventilatory assist. Intensive Care Medicine, 2012. 38(7): p. 1224-1232.
45. Jansen, D., et al., Estimation of the diaphragm neuromuscular efficiency index in mechanically ventilated
critically ill patients. Crit Care, 2018. 22(1): p. 238.
46. Younes, M. and W. Riddle, A model for the relation between respiratory neural and mechanical outputs.
I. Theory. Journal of Applied Physiology, 1981. 51(4): p. 963-978.
47. Riddle, W. and M. Younes, A model for the relation between respiratory neural and mechanical outputs.
II. Methods. Journal of Applied Physiology, 1981. 51(4): p. 979-989.
48. Younes, M., W. Riddle, and J. Polacheck, A model for the relation between respiratory neural and
32
S
UPPLEMENTS
S.1.
M
ETHODS
S.1.1.
E
XAMPLE OF BREATH SELECTIONBreaths were excluded when an esophageal spasm, an artifact in the EAdi signal, or an unexplained deviation from baseline was seen. An example of how the breaths were selected is seen in figure S1-2. Deviations from baseline in esophageal pressure and transdiaphragmatic pressure are clearly visible. The breaths with a deviation from baseline of >5 cmH2O were excluded from analysis by visual selection.
S.1.2.
A
VERAGE TEMPLATE SUBTRACTIONFor the average template subtraction method, a template of the contaminant ECG signal was estimated from the contaminated EMGdi signal [38]. First, the positions of all QRS complexes needed to be detected. EMGdi was bandpass filtered through a fourth-order Butterworth filter with a frequency band of 4-50Hz to emphasize the ECG. This signal was rectified and filtered with a moving average filter. A flexible cutoff value was used on the moving average filtered signal to find all the intervals of the QRS complexes. Too short or too long intervals were discarded, and the heart frequency was used to detect the intervals where a QRS complex was expected. Second, the R peaks positions were detected and a 0.16-second acquisition window around each peak was applied to form QRS segments. Third, the template was made by averaging all QRS segments. The amplitude of the template was adjusted to the original peak amplitude of the QRS complex from the Butterworth filtered signal. Lastly, the ECG template was subtracted from the contaminated EMGdi to obtain a cleaner EMGdi.
S.1.3.
W
AVELET-
BASED ADAPTIVE FILTER [image:32.595.71.438.689.743.2]Next to the average template subtraction, a wavelet-based adaptive filter was used for the removal of ECG from the EMGdi [37]. This filtering technique is based on the wavelet transform, which is similar to the Fourier transform with a completely different merit function. As the Fourier transform decomposes a signal into sines and cosines, or functions localized in the frequency domain, the wavelet transform decomposes a signal into wavelets that are localized in both the time and frequency domain. The wavelets handle the time domain by translation, and the frequency domain by dilation of the wavelet.
FIGURE S1-1. THE DAUBECHIES-4 WAVELET. THE WAVELET CAN BE TRANSLATED AND DILATED.
33 Only one wavelet, or mother wavelet, can be chosen to decompose the signal. We chose the Daubechies-4 wavelet as the mother wavelet for the wavelet-based adaptive filter (see figure S1-1). For the wavelet-based adaptive filter, the contaminated EMGdi was decomposed in five scales, which represent five different dilations of the wavelet. The resulting wavelet coefficients were then filtered using a thresholding technique adapted to the signal strength. Finally, the EMGdi signal was reconstructed from the filtered wavelet coefficients.
S.2.
R
ESULTS
S.2.1.
R
EGRESSION WITH SECOND ORDER POLYNOMIALOverall, the correlation improves slightly but not significantly when the coefficient of determination (r2) from the second order polynomial is compared with the r2 from a first order polynomial using all
breaths (see table S2-1). In one subject, the fit improves drastically, but in five others it worsens. Therefore we conclude a second order polynomial fit is not better than a first order polynomial fit. This conclusion is underlined by the fact that the fit using a second order polynomial worsens significantly or remains the same when using a Pdi or EAdi cutoff value, respectively.
Table S2-1. Coefficients of determination (r2) when using a second order polynomial. The differences are
calculated between r2 of a second order polynomial and r2 of the linear regressions shown in table 4-2.
Subject r2
Difference with r2
all breaths
Difference with r2
Pdi cutoff
Difference with r2
EAdi cutoff
S01 0.64 0.07 -0.03
S02 0.56 0.05 -0.17 0.03
S03 0.63 -0.04 -0.17
S08 0.74 0.23 0.17
S09 0.86 0.03 -0.05
S11 0.62 -0.04 -0.25 -0.22
S12 0.29 -0.07 -0.60 -0.10
S13 0.72 0.03
S14 0.57 0.00 -0.33
S16 0.44 -0.06 -0.5
S17 0.82 -0.01 -0.02 -0.03
S20 0.73 0.02 -0.06
S21 0.89 0.06 0.03 0.02
S22 0.77 0.00 -0.06
S23 0.92 0.02
Mean±SD 0.68±0.17 0.02±0.07* -0.13±0.21** 0.00±0.09***
EAdi = electrical activity of the diaphragm; Pdi = transdiaphragmatic pressure; SD = standard deviation;
[image:33.595.71.512.442.714.2]35
S.2.2.
A
LL CORRELATIONS PER SUBJECTAll the correlations of each subject are shown in figure S2-1 to S2-15, together with the linear regressions and the residual plots of the linear regression with EAdi cutoff or without. When the coefficient of determination improved using a cutoff value of Pdi or EAdi, the corresponding linear regression is shown as well.
Subject 09, 17, 20, 21, 22, and 23 all have a strong correlation when all breaths are used for linear regression (r2 > 0.7, see figures S2-5, S2-11 to S2-15). R2 of subject 01, 02, 03, 11, 12, 14, and 16
increases with 0.1 or more when a cutoff value for Pdi is used (see figures 1 to 3, 6, 7, S2-9, and S2-10). The correlation of the fits in these subjects, except for subject 01, become a strong one when using Pdi cutoff. S11 is the only subject who has an increase of more than 0.1 in r2 when a cutoff
36
FIGURE S2-1. RELATIONSHIP BETWEEN THE ELECTRICAL ACTIVITY OF THE DIAPHRAGM (EADI) AND THE TRANSDIAPHRAGMATIC PRESSURE (PDI) OF SUBJECT 01. LINEAR REGRESSION (LR) OF ALL BREATHS (BLACK LINE) RESULTS IN A MODERATE CORRELATION. THE COEFFICIENT OF DETERMINATION (R2) INCREASES USING A PDI CUTOFF (ORANGE LINE), BUT THE CORRELATION REMAINS MODERATE. NO EADI CUTOFF IS SHOWN AS R2 DID NOT IMPROVE COMPARED TO R2 OF THE LINEAR REGRESSION USING ALL BREATHS.