Strategic insight in the
Capacity & Efficiency with
Hospital data
“How can collected hospital data be used to give the board of directors strategic insight in the efficiency of the operational business capacity and volume of the academic hospital Radboudumc?”
University of Twente
Carina Seidel, s1131974
Master Business Administration – Information Management
Carina Seidel 13-11-2015 Page 3 of 97
Contents
Strategic insight in the Capacity & Efficiency with Hospital data ... 1
Contents ... 3
Preface ... 7
Abstract ... 8
Glossary and definition of used words (and Dutch translation) ... 9
1. Problem Identification and Motivation: Introduction ... 10
1.1. Research question and research objective ... 10
1.1.1. Research question: ... 10
1.1.2. Sub question: ... 10
1.1.3. Research objective ... 11
1.2. Research design ... 11
1.3. Literature Selection Method ... 12
1.4. Case selection ... 12
1.4.1. Case Selection for Validation ... 13
1.5. Data collection method, operationalisation and data analysis ... 13
1.5.1. Archival records ... 14
1.5.2. Observation: ... 14
1.5.3. Interviews ... 14
1.5.4. Usage of data to build construct ... 15
1.6. Expected results ... 15
1.7. Deliverables and Scope ... 15
1.7.1. Scope of the research ... 16
1.7.2. Validation of the Testable Concept... 16
2. Objective of the Solution: Literature study ... 18
2.1. Business capacity ... 18
2.2. Strategy and strategic alignment ... 19
2.1. Information Management in Health care ... 20
2.2. Management information systems in Health Care ... 21
2.3. Balanced Scorecard (BSC) ... 23
2.3.1. Balanced Scorecard in Healthcare ... 25
2.3.2. BSC implemented in Hospitals ... 27
2.3.3. Ideal Balanced Scorecard for the internal process ... 29
3. Design & Development: Design Construct & Testable construct ... 32
3.1. Radboudumc... 32
Carina Seidel 13-11-2015 Page 4 of 97
3.2. Design Construct ... 34
3.2.1. BSC Radboudumc ... 34
3.2.2. Development of the Design Construct ... 35
3.3. Testable Construct ... 37
3.3.1. Fishbone Radboudumc ... 37
3.3.2. Development of the Testable Construct ... 37
3.3.3. Validation of the testable Construct ... 39
3.3.4. Ideal vs. available indicators ... 39
3.3.5. Available vs. former indicators ... 40
3.3.6. Validation of the indicators ... 41
4. Demonstration: Prototype ... 43
4.1.1. Data source used for the prototype (available data) ... 43
4.1.2. Tool selection for the development phase ... 44
4.1.2.1. Development phase... 44
4.1.3. Screenshots final version ... 44
4.1.3.1. Main overview ... 45
4.1.3.2. Clinic overview ... 45
4.1.3.1. Outpatient overview ... 47
4.1.3.2. OR overview... 48
4.1.4. Validations of the prototype ... 48
5. Reliability & Validation ... 49
5.1. Reliability ... 49
5.2. Validation of the Research ... 50
6. Analysis ... 50
7. Recommendation ... 53
8. Discussion and Limitations ... 54
9. Conclusion ... 54
Appendix A Literature study – the selection process ... 56
Appendix B S.T.R.O.B.E test (Venkatraman, 1989) ... 59
Appendix C Outcome of the S.T.R.O.B.E test of the Radboudumc ... 60
Appendix D Radboudumc organogram – stakeholder of the research ... 62
Appendix E Interviews for gathering information (dutch) ... 63
Appendix F Ideal indicators and available indicators ... 64
Appendix G Ideal indicators and current used indicators ... 66
Appendix H Indicators from the Interviewees... 67
Carina Seidel 13-11-2015 Page 5 of 97
Appendix J Improvements Indicators from the interviews (Dutch) ... 70
Appendix K Dutch healthcare system ... 75
Appendix L BSC indicators from literature ... 77
Appendix M Underling Screenshoots ... 91
Appendix N Guideline to use this research for other perspectives ... 94
10. References ... 95
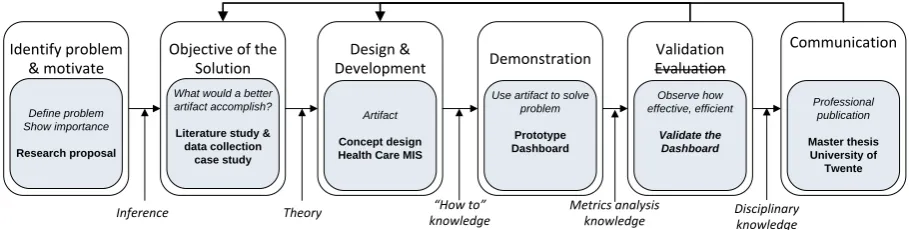
List of Figures Figure 1 – DSRM based on Pfeffers et al. (2007) ... 11
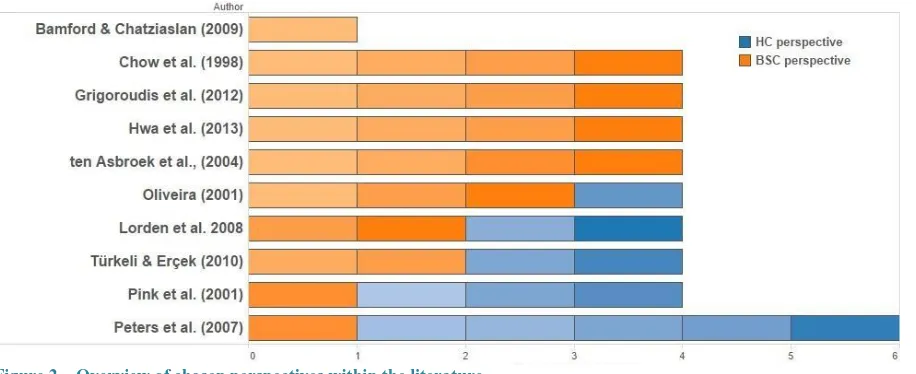
Figure 2 – Overview of chosen perspectives within the literature ... 27
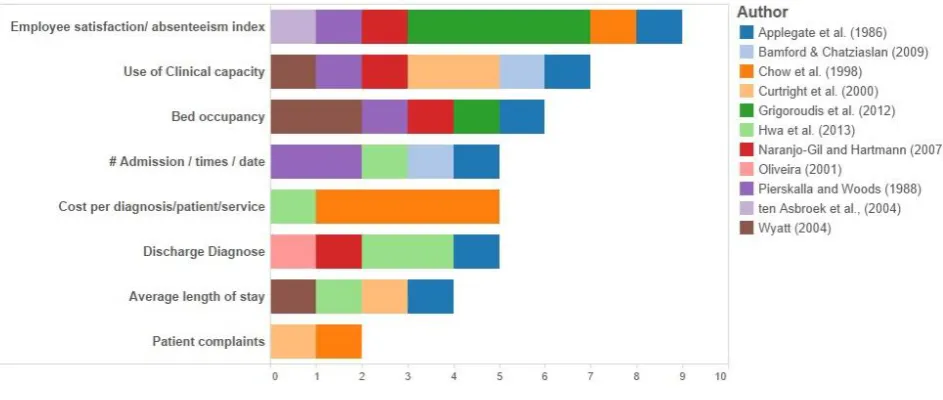
Figure 3 – Perspectives and the amount of Indicators ... 29
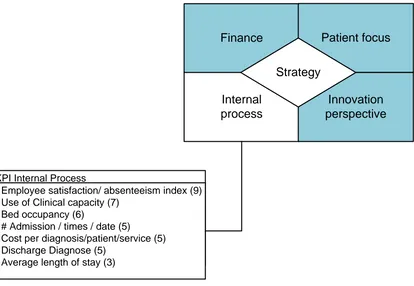
Figure 4 – Ideal KPI’s according to the literature ... 30
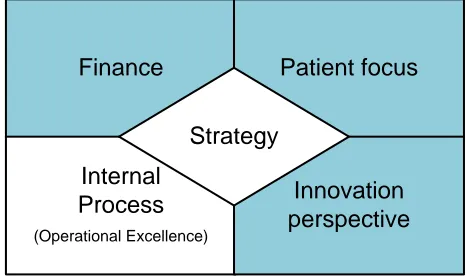
Figure 5 – Ideal BSC and ideal Internal Process KPI’s ... 31
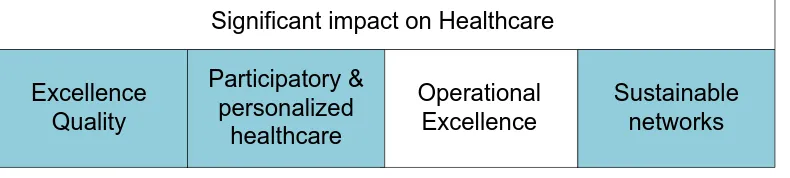
Figure 6 – Strategy of the Radboudumc ... 32
Figure 7 – The information structure of the Radboudumc ... 33
Figure 8 – BSC Radboudumc ... 34
Figure 9 – Simplified model of the patients pathway by B. van Acker (2015) ... 35
Figure 10 – Step 1 Patient care process ... 35
Figure 11 – Design Construct model step 2 ... 36
Figure 12 – Testable Construct ... 37
Figure 13 – Outcome and Performance Drivers available ... 39
Figure 14 – Available indicators in Clinic, OR and Outpatient Clinic ... 40
Figure 15 – Indicators from the Interviewees ... 41
Figure 16 – Radboudumc organogram- Stakeholder of the research ... 62
Figure 17 – Dutch Healthcare system ... 75
List of Illustration Illustration 1 - Main overview about business capacity and volume ... 45
Illustration 2 - Clinic overview ... 46
Illustration 3 - Outpatient clinic overview ... 47
List of tables Table 1 – Glossary and definition of used words... 9
Table 2 – Definition of capacity ... 18
Table 3 – Pink et al. 2001 BSC in HC ... 27
Table 4 – Tool Selection for the prototype ... 44
Table 5 – Interviews for gathering information ... 63
Table 6 – Ideal indicators and available indicators ... 65
Table 7 – Ideal indicators and current used indicators ... 66
Table 8 – Indicators from Interviewees ... 67
Carina Seidel 13-11-2015 Page 6 of 97
Carina Seidel 13-11-2015 Page 7 of 97
Preface
This document is the final project of my study Business Administration Information Management. The Master thesis is the final product to conduct the Master Degree of Business Administration. In
collaboration with the Radboudumc and University of Twente this research was conducted.
This research had therefore two mentors from the University of Twente and one mentor and one business case owner from the Radboudumc.
The academic guideline and support I got from Ton Spil, was just was I needed to keep the balance between the academic aspect and the business case. I am also thankful for the feedback Henk Kroon provided me to complete the thesis.
I am thankful for the support and possibilities handed to me by my the department PVI and the Radboudumc. Also I want to acknowledge my supervisor Bart van Acker, which helped me to understand the complexity and challenging data environment of an hospital. My practically second supervisor who started as the business case owner of the project Marnix Nillissen, was able to help me understand the strategic needs of an hospital.
Last but not least I would like to thank Stefan Jansen, who supported me in the final phase of finishing this document.
Carina Seidel
Carina Seidel 13-11-2015 Page 8 of 97
Abstract
This research focuses on the strategic insight of operational business capacity and volume of the patient care process. The reason for this research was to generate new insights on how to monitor, report and measure the operational business capacity and volume of a hospital. The approach is problem oriented and conducted at the Radboudumc in the Netherlands.
The design science research methodology from Pfeffers, Tuunanen, Rothenberger, and Chatterjee (2007)was used. This is an approach which focuses on the development of information systems. The objective of the solution is to gather information from the hospital systems to give insight in the operational business capacity. In the literature there was no solution found which deals with the same problem. Therefore literature study about strategy, management information systems, Balanced Scorecard, business capacity were conducted to create a theoretical concept. This results in an ideal BSC for the healthcare and indicators for the perspective; internal process.
In the design and development phase the design construct was created, which represents the
development from the organisation strategy to the internal process perspective. Based on the design construct the testable construct is developed which includes the measures. The indicators within the testable construct are based on the literature. Therefore interviews have been hold to gather
information. The testable construct emphasises the outcome and performance drivers according to Kaplan and Norton (1996). For the demonstration of the testable construct a prototype in Tableau was developed, which visually presents the indicator with hospital data.
The validation was conducted in two phases. The first phase was to transform the desired abstract; the testable construct, to the actual abstract; the prototype. In this phase the availability of the data was checked and the current reports were considered. The second phase was the iteration process which was used to develop the prototype. There were eleven interviews hold with ten internal experts and one external on the topic of operational business capacity and volume.
During the first phase the availability of the data was a concern. There is only one performance driver available of a total of nine. The performance drivers are crucial to the construct. They report the measures and give the critical insight to determine the efficiency of the patientcare process. In the second phase the interviewees agreed that the current report holds insufficient information about the operational business capacity and volume. The experts confirmed that the testable construct identified the information which is needed to monitor the operational business capacity and volume. The performance drivers are identified by the experts as relevant. The prototype cannot provide strategic insight, due to the lack of data about performance drivers and that the strategic goals cannot (current formulation) not be direct related to the operational business capacity and volume. Yet the prototype was seen as an improvement, which gave them more information and new insights.
Carina Seidel 13-11-2015 Page 9 of 97
Glossary and definition of used words (and Dutch translation)
Table 1 – Glossary and definition of used wordsEnglish word Dutch translation Definition
BI BI Business Intelligence
Board of directors Raad van Bestuur The Management of the Academic Hospital
BSC BSC Balance Scorecard
Business capacity Werkdrukte/ gebruikte middelen
The volume of available resources. Like hospital beds, operation room usage.
Clinic Kliniek If the patient is hospitalized
Day Treatment Dagopname If a patient does not stay the night
DSRM DSRM Design Science Research Method
HC Zorg Health care
HIMSS HIMSS Healthcare Information and Management
Systems Society
Hospital Data Ziekenhuis data vanuit Epic Data which is generate and collected within the hospital (no external values)
KPI Kritieke prestatie-indicator key performance indicator
MIS MIS Management information system
operational business capacity and volume
Bedrijfsdrukte The volume of the hospital of business activities which are available and used
OR OK Operationroom
Outpatient Clinic Polikliniek The part of the clinic where patient visit for a appointment
S.T.R.O.B.E. strategische oriëntatie van ondernemingen
strategic orientation of business enterprises
The efficiency of the operational business capacity and volume
Carina Seidel 13-11-2015 Page 10 of 97
1.
Problem Identification and Motivation: Introduction
This research is conducted in a collaboration with the Radboudumc to explore the need for strategic insight in the hospital data. This is done with an Design Science Research Method (Pfeffers et al. 2007). The first chapter defines the specific research problem and justifies the value of the solution according to Pfeffers et al. (2007)
The DSRM steps are defined:
Problem Identification and Motivation: lack of concept to developed information system to monitor efficiency of the operational business capacity and volume
Objective of the Solution: Literature study about Strategy, management information systems, balanced scorecard
Design & Development: Objectify the literature for the case of the Radboudumc Demonstration: Incorporate the indicators in a Dashboard for monitoring Validation: Verifying the indicators and the need of the Dashboard
Communication: Documentation of the conducted research (this document)
The research provides a guideline to fill in the internal process perspectives for the BSC for a hospital. This is described in the design and development process. It also demonstrates possibilities for
presentation of the measures, a tool option and interaction and levels for a Dashboard.
1.1.
Research question and research objective
The aim of this research is to design a construct to support the strategic level of an hospital to gather strategic insight in the efficiency of the operational business capacity and volume .
The capacity and volume needs to be defined and also what the efficiency of the operational business capacity and volume is. Also the strategy objective on the topic business capacity has to be identified to design a construct. This will be conducted with literature study and a design science approach at a academic hospital.
1.1.1.Research question:
“How can collected hospital data be used to give the board of directors strategic insight in the efficiency of the operational business capacity and volume of the academic hospital Radboudumc?”
1.1.2.Sub question:
1. What is the operational business capacity and volume? 2. What is strategic insight and how to identify it?
3. What strategic insights are needed and useful for the board of directors?
4. How to identify the strategy which is related to the efficiency of business capacity? 5. How to measure the efficiency of operational business capacity and volume?
6. Can collected hospital data give enough insight in the efficiency of the business capacity?
Carina Seidel 13-11-2015 Page 11 of 97
and registration have impact of the quality of hospital data, but for this research it is assume that this happens correctly.
1.1.3.Research objective
This research aims to understand the development of indicators, how to identify relevant values to give strategic insight in the operational business capacity and volume. This will be qualitative assessed. The identified information will be used to build a management information system in a form of a
dashboard.
1.2.
Research design
To answer the research question a Design Science Research Method is chosen. (Pfeffers et al. 2007)
Objective of the Solution
What would a better artifact accomplish?
Literature study & data collection case study Design & Development Artifact Concept design Health Care MIS
Communication Professional publication Master thesis University of Twente Identify problem & motivate Define problem Show importance Research proposal
Inference Theory Disciplinary
knowledge Process iteration
Metrics analysis knowledge
Demonstration
[image:11.595.70.525.259.374.2]Use artifact to solve problem Prototype Dashboard Validation Evaluation Observe how effective, efficient Validate the Dashboard “How to” knowledge
Figure 1 – DSRM based on Pfeffers et al. (2007)
The figure 1 DSRM Process Model is based on the model from Pfeffers et al.(2007) this model has one alterations. According to Wieringa (2010) the DSRM empirical research can be used to validate or evaluate the artefact. In the validation step the artefact will be verified with the user and the evaluation controls after implementation if the user is satisfied. Due to time limitations this research will validate the artefact in the finale stage instead of the evaluation process.
Problem Identification and Motivation The motivation to conduct this research is, that there is not yet a concept developed of how a board of directors can have a strategically insight in the efficiency of the operational business capacity and volume. There is research about how to design MIS and how to monitor the process, but those use a bottom up approach or only focused on separate departments. This research aims to design a construct for the overall insight of efficiency of business capacity of an academic hospital. Also it will contribute on how to construct measurements to monitor business capacity. The measurements will be designed in a real life setting of a case study.
Carina Seidel 13-11-2015 Page 12 of 97
business capacity and volume.
Design & Development The construct will be designed with existing theories about management information, strategic alignment and balance score card. This will be combined with theories about health care improvement and lean implementations within the health care sector. The construct will be developed to a testable construct and also a prototype of a MIS will be built.
Demonstration & Validation In this research demonstration and evaluation is combined and further referred to as the validation step. In that step the construct will be tested and validated with a prototype with real hospital data. This prototype is the real world test of the
construct.
Communication This research, the construct and the validation will be part of this master thesis report. The hospital own data will not be used, therefore mock-up data will be generated to present the prototype in the thesis.
Limitations of this research design are the external validity. The validation happens within only one academic hospital within the Netherlands. Therefore the artefact can be valid in this environment but could be not applicable in another academic hospital in the Netherlands.
1.3.
Literature Selection Method
To find the right literature the approach of Wolfswinkel, Furtmueller, and Wilderom (2013)is used. The steps in his method are define, search, select, analyse and present.
The first step is define the criteria for inclusion or exclusion. The research problem concerns different topics. Therefore different articles and theories concerning those topics are gathered. Those three main topics are, Management information system in Hospitals, Strategic alignment, Balanced Scorecard in Healthcare, Business capacity in Healthcare. The distinct and extended elaboration can be found in the Appendix A.
1.4.
Case selection
In this section the case selection is defined. The Radboudumc in Nijmegen, is an academic hospital. The departments are independent from each other but there are interrelated by the same information systems and their work in an network structure together. Every department is obligated to report about their business activities to the Board of directors.
Carina Seidel 13-11-2015 Page 13 of 97
displacing all (medical) paper records in the hospital, Continuity of Care standards to exchange data; Data Warehouse used as basis for clinical and business analytics.“
The current identified situation is that the board of directions of the Radboudumc would like to have better understanding about the efficiency of business capacity. At this moment there is a reporting procedure to provide them with the needed data, but this is limited. Thus this issue identified within the literature and in a real world setting.
Radboudumc is due to their enhanced usage of EMR an interesting case. They have stored two years of hospital data from their EMR and can access the data with Business Intelligence tools (for example) SAP Business Objects. The implementing of lean thinking and the explicit need for more information creates an accessible research environment.
1.4.1.Case Selection for Validation
There was a design construct and a testable construct built to develop a prototype. Those construct were built from the literature and archival records of the Radboudumc. To validate the prototype there were ten people interviewed, which are experts on the topic within Radboudumc. There is one person interviewed which is at that point extern but is a former employee of the Radboudumc. The people which are selected and why there are selected is described below.
A member of the board of the directors, who is involved with the monitoring of the business capacity strategy of the operational Excellence. He is also the main stakeholder of this research topic. Then a manager of the Service department Process Improvement and Innovation(PVI), who has projects and experiences on the topic operational excellence. Also two consultant of the service department PVI, which generate reports for departments about specific questions about the efficiency of the operational excellence. Another manager from the service department Business Intelligence and Analytics(BIA), this department develops the report, data models to communicate hospital information. There is also an information analyst interviewed of the department BIA, because she is involved in building the data models for the monthly report of operational excellence. The business manager of the Urology
department is interviewed, because she is focused on the operational excellence in her department. Business analyst of the Anaesthesiology is interviewed because of her knowledge about the operation room. The manager of the financial - strategy and control department (Concernstaf - Finance) is interviewed, because she has a strategic view on the Radboudumc. Also a Senior advisor of the same department are interviewed. They Senior advisor supervises the project to build a monthly report to inform the board of directors about the operational excellence. The last person is the external advisor who worked for the department strategy and control - finance.
The selected people are experts within Radboudumc on the topic operational excellence and how to gain insight in the data. The internal validation it strong because of those diverse experts. But this validation step is weakens the external validation. It was chosen to only validate with internal experts because of the privacy of the data. Also a validation with dummy data would not have the effect on recognition of the data.
1.5.
Data collection method, operationalisation and data analysis
Carina Seidel 13-11-2015 Page 14 of 97
concerned about the reporting function for the board of directors. This will be the departments: Process Improvement and Innovation(PVI), Business Intelligence & Analytics(BIA) and also the department which advises the board of directors and the board of directors.
Also normal business activities of the medical departments will be observed and existing
documentation about procedures within the Radboudumc will be studied. One argument from Robert K. Yin (2013) to improve the validation of case studies is to use triangulation. Within this research the methodological triangulation will be used. R. K. Yin (1981)explained that evidence used in case studies can come from different methods like, fieldwork, archival records, verbal reports, observations, or any combination of these.
The main three used methods will be: Analysing archival records and reports within the case (Radboudumc). Observations of the involved employees and the stakeholders. Interviews involved employees and the stakeholders
1.5.1.Archival records
The Radboudumc, like other organisations documents about their strategy’s, their vision and mission. These document go further into detail about how to implement those vision and strategies. The documented information will be analysed and used for recent and historically information collection. Mason, McKenney, and Copeland (1997) stated is that history reminds humans of the broad degree of complexity, intricacy and unpredictability that surrounds any real circumstance. History events and documented information cannot be observed anymore, but can give useful insights in the case.
1.5.2.Observation:
The observation will be reported with field notes and will be collected by accompany an internal advisor. This will be individual meeting with department members or group meetings. Those will be reported directly and some of them will occur only once and other will occur monthly. Baker (2006) defined observation as a systematic recording of observable phenomena or behaviour in natural setting. The filled role of the research in this case will be the moderate/ peripheral membership(Baker (2006). This means keeping the level of involvement in balance met the outsider role. The outsider role is needed to have an objective view and judgement of the behaviour.
1.5.3.Interviews
The interviews will be hold as semi-structured interviews. The selection of the interviewees are people who are employed or formally employed by Radboudumc. The describtion of the selection can be found in the Case Selection for Validation. Goal of an interview is that the interviewee share as much as much information as possible, unselfconsciously and in his or her own words (DiCicco-Bloom & Crabtree, 2006).
An interview guide of written list of questions and topics according to Bernard (2006) will be used. The goal of the interview guide is to create an environment where the respondent feels free to share their knowledge and also that the interviewer will be objective in the questioning. The semi-structured interview will involve a set of open-ended questions that make it possible for an in-depth reaction. (Baumbusch, 2010)
Carina Seidel 13-11-2015 Page 15 of 97
The observations and interviews can have a researcher bias, which is a threat for the validity. Baker (2006) mentioned three types to minimize the threat. Face validity is a logical examination if the observation is plausible or make sense. The second is the criterion validity, which is covered by using the methodological triangulation. Lastly is if the observation fit in the existing research and theories, it is the construct validity. The construct validity will be ensured by the literature review.
Another threat can be the reliability of the data, this will be ensured by repeating the observations and interviews. The archival documents will also be used to make the collected data more reliable. Yet the research has a strict and tight time frame, there it will not be possible to repeat every interview or observation.
1.5.4.Usage of data to build construct
To build the construct secondary data from literature will be used. The construct will be tested with the quantitative data of the hospital, but the validation will be performed with the qualitative measurement of evaluating the prototype. This will be validate with the users, which are the departments PVI, BIA and Advisers of board of directors and de board.
The validation measured if the prototype of the construct of an MIS can give the insight the Board of directors and involved employees need to monitor the efficiency of business capacity. This will give a answer if the construct can give insight in the efficiency of business capacity of the academic hospital Radboudumc. This limited the result to one hospital within the Netherlands. Thus is the external validity of this research is weak. Also the internal reliability is at risk, because it will be observed by only one person and the internal staff members will be supervising this research. Yet the prototype will be also compared to the literature construct with the purpose to strengthen the internal reliability and also the external validity. Also like Robert K. Yin (2013) states that the analytic generalization should aim to apply to other concrete situations. Thus in this research this would be other academic hospitals in the Netherlands.
1.6.
Expected results
The expected results of this research are to give a construct of how to design indicators for a
management information system. The indicators should represent the efficiency of business capacity . Those indicators should be aligned with the organizational strategy of internal process and monitor departments. To use the strategy developed by the managers this approach assumes the involvement of the management. The results should also support the hypothesis, which states that the transformed hospital data can give enough insight in the business capacity.
This will add more knowledge to the literature about management information systems for health care and hospitals. This will be hopefully generate opportunities for different academic hospitals to monitor their efficiency of business capacity.
1.7.
Deliverables and Scope
The Deliverables of the research:1. Problem identification
1.1. The definition and requirements of the research formulated in a clear problem statement. (Research question and objective)
Carina Seidel 13-11-2015 Page 16 of 97
2.1. A literature selection and study about cases, models and theories concerning the problem with an objective of the solution
3. Design and Development 3.1. Design construct
3.1.1.A theoretical construct of existing theories how to build and generate an information system for an academic hospital
3.2. Testable construct
3.2.1.A construct which includes measurable and dimension which should be monitored to achieve/ maintain the efficiency of the operational business capacity and volume 4. Demonstration: Prototype of the testable construct
4.1. A prototype with Tableau will be generated, this means that an interactive dashboard can be tested. This will be built on the data sources from the Radboudumc therefore it can be implemented in their own
5. Validation of the testable construct
5.1. A realisation validation which test if the data and information are available for the prototype 5.2. A second validation will be held with experts on the topic, in the topic the strategic insight
will be measured. This last step will be done in a iteration, therefore the prototype will be used to test the data model with the experts. Therefore it will be happening at the same moment than the step 4 “Prototype of the testable construct”
1.7.1.Scope of the research
The research considered only internal process values of the departments which can be compared between the most department. Therefore the following sub-departments are included: Outpatient Clinic, OR and Clinic (Day Treatment).
Furthermore this research excluded the financial situation of a hospital in the design of the construct and also in the development phase of the construct and the dashboard. For this approach was chosen, because the financial information cannot be directly related to the internal process information. (The financial flows can be delayed from three to six months, which makes a direct comparison almost impossible.) This is an insufficiency of different variables like the data model and also the complexity of the financial path of healthcare procedures.
Another difficult factor is the satisfaction of the patient, this is one of the strategic values of the Radboudumc, yet this is difficult to monitor frequently. And yet there is not yet an option developed by Radboudumc to measure the patient satisfaction in a quantitative ways which can be translated to a direct process, sub department. (The hospital is using patient information to monitor the satisfaction)
At this moment the learning and growth of the employees are also hard to directly monitor. Also the learning and growth concerning research and education is not yet measured in a weekly or monthly frequency. (This finds place in a more abstract way)
Therefore the focus is on only the operational excellence of the capacity of rooms, capacity of beds, amount of patients and visits.
1.7.2.Validation of the Testable Concept
Carina Seidel 13-11-2015 Page 17 of 97
The second step will be to conduct semi structured interviews with experts on the topic “strategic insight in the efficiency of the operational business capacity and volume of an academic hospital” These experts are identified in cooperation with the owner of the business case and a consultant of the internal consultancy PVI.
The Design science approach of Pfeffers et al.(2007) is chosen for this research. Yet the evaluation phase was abandoned and the validation phase of Wieringra (2009) was used. Therefore further his approach of the validation is used.
According to Wieringra (2009) to solve practical problems the goals of the stakeholders needs to be investigated and the development of solutions should involve the stakeholder criteria’s. In his design science approach he also used a cycle to develop solutions which is similar to the Pfeffers et al.(2007) DSRM process model.
Wieringa (2009)defines three questions which should be answered in design validation. He defines those questions as knowledge questions. These are: according to him:
V1.“Internal validity. Would this design, implemented in this problem context, satisfy the criteria identified in the problem investigation? This contains two sub questions.
E1 Causal question: In problem domain D, would solution S have expects E? E2 Value question: Do E satisfy stakeholder criteria C?
V2.Trade-offs. How would slightly different designs, implemented in this context, satisfy the criteria?
V3.External validity (a.k.a. sensitivity analysis). Would this design, implemented in slightly different contexts, also satisfy the criteria?”(p. 4-5, Wieringra, 2009)
About question 1 this research problem is a value question and not a casual question. There the question would be: “Do E satisfy stakeholder criteria C?” In the problem definition it was stated that the “E” needs to be identified which is the indicators within the artefact or prototype. Although the criteria “C” is a perception value, which therefore will be qualitative assessed. The first four open question were formulated to answer the question. “Do E satisfy stakeholder criteria C?” . The open questions are formulated to gain insight in their perception of the “operational business capacity of the volume and the efficiency”, the importance of the additions to the monitoring process and also which values the interviewed experts is missing. During the presentation the interviewee, can give direct feedback over the indicators in the prototype and give answer if those values are informative. After this there are two questions asked about the prototype. The questions want to identify if there are new, added information insights. This question is asked to investigated of they see an added value in such a monitoring tool. The last question is asked about information they are missing. In that context it is stated that this is not related to the current registration, or available measures. This is a question for values they are desired. The last question was to use the “V2” of Wieringra (2009) . In this approach the interview could create or state their own trade-off by describing their ideal version.
These Experts which will be interviewed are business manager within the Radboudumc, Consultants of the department PVI, Manager of the Department BIA, Manager of the Department PVI, Information Analyst, Business analyst of the Anaesthesia, Director Finance, a the external advisor, member of the board of the directors at the Radboudumc. This is more detailed described in the section “case selection of the validation”.
Carina Seidel 13-11-2015 Page 18 of 97
2.
Objective of the Solution: Literature study
The objective of the solution according to Pfeffers et al. (2007) searched literature for feasible and possible solutions and for similar situation. In the literature selection method the criteria’s for this part are explained. In the problem identification the need for a “system” which can provide the board of directors of the hospital with the information about the efficiency of the operational business capacity and volume is described. This problem is quite distinct. Also is in the literature search it is chosen to start with a broad search to explore the background about similar topics and information’s. First the business capacity will be defined, which is expected to be a difficult task. Then business capacity and volume will be defined and the options how to measure the efficiency of it.
After this it the literature study will give an answer to the first sub question about strategic insight. Then the management information systems in hospitals will be researched to give answers to the second question and develop into a solution or approach to identify strategy to operational procedures. This information will be used to develop the design construct.
2.1.
Business capacity
The search for information about business capacity was a difficult task because this term may be too specific. Yet there was information found about the business capacity in hospitals.
It was included in the problem statement of this research. The business capacity which was meant in the problem statement is, that the business capacity is the amount the hospital can hold concerning the primary patient care process. Amount describes the duration, the available space, staff, methods, tools and other resources related to the primary patient care process. It was only literature found which does not focus on business capacity but used it for different approaches or capacity planning.
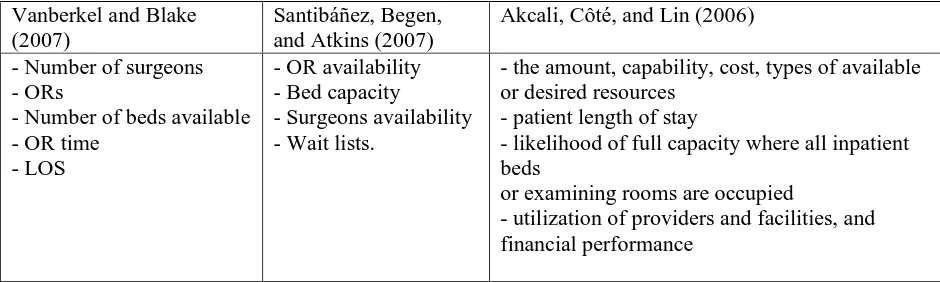
Vanberkel and Blake (2007) developed a model to reduce the waiting time. This is achieved with a proper resource allocation and sound capacity planning. It is stated that the generalized capacity planning model is often assumed that the current resources are achieving maximum capacity. They define capacity as the ,number of surgeons, ORs, number of beds available, OR time and LOS. They simulation had an interesting outcome: “The simulation showed that long wait times are more
[image:18.595.67.537.556.697.2]dependent on beds than available OR time. This conclusion provided direction to focus on alternatives that free beds to reduce the effect of the bottleneck.(pp. 384 Vanberkel and Blake,2007)
Table 2 – Definition of capacity
Vanberkel and Blake (2007)
Santibáñez, Begen, and Atkins (2007)
Akcali, Côté, and Lin (2006)
- Number of surgeons - ORs
- Number of beds available - OR time
- LOS
- OR availability - Bed capacity
- Surgeons availability - Wait lists.
- the amount, capability, cost, types of available or desired resources
- patient length of stay
- likelihood of full capacity where all inpatient beds
or examining rooms are occupied
- utilization of providers and facilities, and financial performance
Carina Seidel 13-11-2015 Page 19 of 97
capacity of the OR is described as the OR room availability, surgeons availability, the block capacity and the number of surgeons. Their model is developed to reduce the waiting lists, they advise doing so by open op more blocks within the OR’s.
Akcali et al. (2006) describes that a successful health care capacity planning must address, the duration of the planning horizon like operational, tactical and strategic. Also the level of care is an important factors, which is differentiate between primary, secondary and tertiary and if the patient is inpatient or an outpatient. For the network flow approach to optimize bed capacity planning they used the
information about bed capacity and facility performance and budget constraints.
Within the literature there was not an overall definition found of the business capacity of hospitals. Nevertheless the definitions about capacity are similar. Vanberkel and Blake (2007, Santibáñez et al. (2007) and Akcali et al. (2006) mention all the capacity of beds and two mentioned length of stay. It is in some cases described with the capacity planning which is only described for the Operating room or to the bed planning of an hospital. Therefore the definition of the Radboudumc is used. This definition is there is a differentiation established of the potential capacity, available capacity, useable capacity, used capacity and the productive capacity. (personal communication, L. Berrevoets, 24-8-2015)
Also in the interviews with the eight internal experts and the one external experts it was coherent answered that the efficiency of the business capacity and volume is: “To use in an efficiency way the available time, materials, room, people to achieve the right outcome.” The meaning of this is clear within the hospital. This definition will be further, when it is referred to the business capacity and volume and the fourth sub question is answered (What is the operational business capacity and volume?)
The first sub question was : “What is the operational business capacity and volume?” The operational business capacity and volume describes the values are generated in the primary process of the
patientcare of the Radboudumc. The volume describes the amount of patients, visits, operations, day treatment, inpatient days et cetera, which are parts of the patientcare process. The operational business capacity describes the available capacity and the realised capacity of the materials and resources of the process. Those are the doctors, medical staff, rooms, OR rooms, beds.
2.2.
Strategy and strategic alignment
The strategy of a company is the plan for the future direction and intended goals and how to achieve the direction and goals. The next step is to link the strategy to the business structure and in the business operations. To find out if the strategy is implemented there are theories about identifying the strategic alignment. Mintzberg (1978) defines strategy as a deliberate conscious set of guidelines that determines decisions in the future. He addresses that it is important to differentiate between the intended and realized strategy. With the theories about strategic alignment, is will be investigated if the intended strategy is according to the realised strategy. Also this research acknowledges that the strategy is not a fixed plan where the changed can be systematically be planned (Mintzberg 1978)
Carina Seidel 13-11-2015 Page 20 of 97
structure. So the IT strategy and IT structure should be also aligned with the strategy to support the structural fit.
Venkatraman (1989)developed a set of 29 operational indicators to measuring the difference along a set of characteristics that collectively describe the strategy construct. The list of indicators is called strategic orientation of business enterprises (S.T.R.O.B.E). Bergeron et al 2004 used the same list to find ideal patterns between the Business strategy, Business structure, IT strategy, IT structure. They developed construct to identify the Business structure, IT strategy, IT structure. Their assumption was that if the Business structure, Business strategy, IT strategy and IT structure are not aligned the financial and non-financial performance would be lower than if there are aligned.
Avison, Jones, Powell, and Wilson (2004)describes four different types of strategic alignment, those are fit, integration, bridge, harmony, fusion and linkage. This research focuses on the linkage. In their (Avison et al., 2004) literature review they found out that IT is often treated as an expense rather than as an enabler of business value. In their study their researched the completed projects, IT and Business strategy documents and project prioritisation to identify the strategic alignment. This approach is not relevant for this research because the focus is to identify the current state of the academic hospital. It is desirable to enhance the IT technology usage but it is not the focus.
The purpose to identify the alignment is to measure the current situation at the academic hospital. If there is a strong alignment the academic hospital realised strategy is according to their indented strategy. Therefore the focus of the used BSC will be on maintaining that alignment. If the alignment is weak it would be desirable to use the BSC to improve the alignment.
What is strategic insight and how to identify it? First there are differences between the realised strategy and the indented strategy. The indented strategy should be defined by the company in their vision and mission. The S.T.R.O.B.E test will be used if the indented strategy is realised and how this is achieved and communicated. Also later on in the results of the dashboard it should be seen in the data that the indented strategy is realised.
This part answers the second subquestion. “What is strategic insight and how to identify it?”
Mintzberg and McHugh (1985) described the strategy as a set of guidelines that determines decision in the future. The method of Venkatraman (1989) was used to identify the strategy alignment in the Radboudumc.
The hospital has a strategy communicated through the company. This strategy gives each health care department freedom and independence to choose their own path. They have only guidelines about the 4 pillars and the three primary process streams as education, research and patientcare. (this is
described in detail in the chapter 3.1 Radboudumc)
2.1.
Information Management in Health care
The first observed challenge about information management in health care were technical problems with dealing with information. These technical problems were old equipment’s, poor program
performance, the lack of access and also poor management of applications (Tsay & Stackhouse, 1991). Back then the use of management information systems where required, yet Tsay & Stackhouse (1991) did not go into detail about the importance. In time different challenges occurred to Osama, Nassif, Capretz (2013). They stated that hospitals collecting huge volume of data and that the new challenge is how to deal with the raw data and how to transform it to meaningful information. Meaningful
Carina Seidel 13-11-2015 Page 21 of 97
them insights on what is going on now and how to predict what will happen in the near future (Osama et al, 2013). Chaudhry et al. (2007)reviewed literature about information technologies within health care. They conclude that the benefits of health information technology in theory are clear yet there is lack of data about implementing the technologies within health care.
Finally there is a paper of Ramani (2004)which describes how to design a MIS within government hospitals in India. He designs performance indicators which he concluded are useful to plan and monitor the efficiency and effectiveness of the hospitals in India.
The discussed studies are consistent that information technologies can be used to support health care in efficient and effective ways. Notwithstanding the research of Ramani (2004) is limited to only a set of performance indicators. The develop systems is concentrated on reducing cost and does not support a clear management style or strategy.
The identified research gap is how to design a management information system for the efficiency of business capacity in health care which is aligned with the organizational strategy and monitors all departments and ensures the involvement of the management. 1
2.2.
Management information systems in Health Care
Management information systems (MIS) have an almost self-explanatory name. The purpose of such a system is to provide the management or the governing body with the information they need to manage or control a company. Within the problem definition of the research the was a need identified for a “system” which gives strategic insight in the operational business capacity and volume.
Therefore there was a literature study done on the topic of MIS in hospitals. The intention was to find out which methods, systems, tools or information are used in a MIS for hospitals. An ideal MIS provides information about the whole company or in this case hospital. Therefore information systems which are generated for specific departments, medical specialty, one medical condition are not
relevant for this problem statement.
Applegate, Mason, and Thorpe (1986) wrote an article about the need for hospitals to have
information systems which can cope with internal and external information and have an emphasis on strategic hospital planning. They identified in their observations of planners that here is need for three models a decision component a model component and a data component. The decision component has three sub categories organizational performance analysis, expansion of existing service or new venture analysis. They identified the need for additional systems and developed a strategic planning
framework: “Hospitals must attempt to provide the most attractive package of services at the least cost. And the current state of technology in most hospital information systems designs are needed to cope with the changes in the economic structure of the health care industry and its effects on hospital information needs”(p. 88, Applegate, et al., 1986)
Carina Seidel 13-11-2015 Page 22 of 97
Administration systems were the first to be instituted in the hospital (financial focus) the greatest all around information systems and DSS growth in the 1970 and 80 are the patient care systems.
Forgionne and Kohli (1996) find out that Management support system can improve decision making outcomes in comparison with Decision support system. The MSS is a synthesis of the standalone systems within the hospital .By deploying the systems effectively support the segment for the hospital decision making process
Curtright, Stolp-Smith, and Edell (2000) did research for the outpatient at the Mayo clinic. They faced the challenge of creating a healthcare system which measures performance in an environment which has an increase in complexity. The system should align organizational strategies and core principles with performance measurement and management indicators. In their search for developing a measurement framework they used the balanced scorecard of Kaplan and Norton to access
performance across both financial and operational indicators. They developed a list which was mainly based on the BSC but also on other literature. Those are:
Customer satisfaction: internal and external customers Internal business processes: efficiency of operations Quality of service or products
Continuous improvement efforts
Public responsibility and social commitment Financial performance
Bose (2003) develops the outlines of a systems which integrate clinical, administrative and financial processes in health care. This is designed with a common technical architecture. The emphasis of this design it that the clinical and administrative information is needed for decision making. The
interesting requirements for this systems are the interface of the MIS integration of system data, personalisation of contents, content management, search for navigation, classify access to the resources and BI tools for turning the business knowledge into an advantage. Yet there is no clear information if that could be benefit to the strategic management decision.
Andersson, Hallberg, Eriksson, and Timpka (2004) their research focused on how to develop a conceptual model of a management information system for process oriented organizations. In their approach and development they used the BSC, TQM for the quality management and a PDCA cycle for the patient focus. They identified that the hospital management needed a system that support both models as TQM and BSC. The MIS system should also include the medical information, nursing care of patient, the patient flow and the use of human and material resources. One of their findings include that little attention had been paid to the integration of systems. Therefore in the current case study’s they find out that the administrative, financial and clinical systems were not optimal configured.
The article of Wyatt (2004) suggested that the BSC should be supported with an visual dashboard to monitor the performance values. Also these visual dashboards should be accessed within the
Carina Seidel 13-11-2015 Page 23 of 97
Naranjo-Gil and Hartmann (2007) their research focus on the background of the CEO and their decision making. This objective is not explicit relevant to our research topic. Yet they used an management information system in their research. Their findings showed that an CEO’s with
predominant clinical background focuses on non-financial information and prefer an interactive style of using a MIS. CEO’s with a predominant administrative background use the MIS in an diagnostic way and focuses on cost reduction strategy. It was then expected that they use of the MIS would be influences the implementation of the strategic goal.
Bose (2003), Pierskalla and Woods (1988) and Forgionne and Kohli (1996) found out that information systems have barriers because the systems are “stand-alone” therefore are syntheis of the system would be optimal for analysing the information(clinical and administrativ) of an hospital. Applegate et al. (1986) lies also emphasis on the need for more insights but lies the focus even outside the hospital. Curtright et al. (2000) also stated that external information is needed to manage a hospital.
Curtright et al. (2000) and Andersson et al. (2004) describe both the development of a management information system which could cope with the different aspects of an hospital an choose therefore on the BSC but added the needed perspective of healthcare in to that framework. And also Wyatt (2004) describes a case were the hospital used the BSC to cope with the need for performance data and adjusted it to the hospital needs. Naranjo-Gil and Hartmann (2007) lay emphasis on how the MIS will be used and which strategic goal it will support.
In this phase of the literature study it was not searched for indicators or KPIs for the development of the BSC and framework. Yet some article had some indicators which were relevant for the further steps. The whole list can be found in the Appendix J. Those are 49 different indicators mentioned by the authors Applegate et al. (1986), Curtright et al. (2000), Naranjo-Gil and Hartmann (2007),
Pierskalla and Woods (1988), Wyatt (2004) and Curtright et al. (2000) which should be included in an MIS. This gives an indication how complex the process of selection of KPI’s is. They also do not agree on the amount of indicators. The variation lies between six and 16.
2.3.
Balanced Scorecard (BSC)
The requirements for this research problem were to develop an construct which gives a strategic insight in the efficiency of the operational business capacity and volume. In the literature about MIS in Healthcare two articles described the use of the BSC for they MIS. (Curtright et al., 2000, Andersson et al.,2004). Therefore it was analysed if the BSC would be a fit for this research objective. In the first phase the literature about the development of the BSC will be discussed.
The BSC (Kaplan& Norton 1996) has the focus on related the strategy to their performance measures and outcome. Kaplan and Norton (1992)defines four perspectives to keep the balance of the scorecard. These differentiation focus on financial and non-financial performances. The strength of this model according to Kaplan & Norton 1996 is that short term, long term objectives, soft and hard objective measures will be taken into account. The four perspective are Financial perspective, the customer perspective, the internal Business process and learning & growth.
Carina Seidel 13-11-2015 Page 24 of 97
describe the importance to have the diagnostic measures that monitor if the organisations stays in control, but have also the strategic measures that describe the strategy designed from the company to achieve competitive excellence.
In 1996 Norton and Kaplan describe it as a cause and effect hypotheses among objectives and the business can test if they try to achieve with their performance drivers the desired outcomes described in their strategy. If there is no clear linkage between the driver and the outcomes it can be assumed that their do not achieve what their designed in their strategy. The BSC is a strategic tool therefore it is not a replacement for the day to day measurement system, but also it does not provide indication about whether the strategy is being implemented successfully.
Furthermore the BSC was implemented and critical accessed by other authors. Otley states that the determination on how to map necessary patterns in the balanced scorecard perspectives is a complex and time consuming task. Also is the Balanced scorecard more an stakeholder approach, which is an advantage of the tool but also has limitations. The chain of events that Kaplan and Norton uses in their BSC defines Otley as a simplification of the reality. He mentioned that in which approach are the trade-offs defined between the different used measures. Therefore the question rises in how balanced is the scorecard. Otley (1999) argues that only the organizational relevant indicators can be found in the BSC. The BSC has as on advantage the dynamic of the tool. It has to be changed when the strategy changed. Otley (1999) values that on the tool, yet he states that the double loop learning is not specific included in the model. This would help to verify if the model is working. The BSC is not an isolated tool it should be supported by the traditional used systems of an organization.
Nørreklit (2000) and Otley (1999) agree on the lack of external values. (Nørreklit, 2000) states that the monitoring of the completion or technologic development is important for a company to stay
competitive. Nørreklit (2000) states” The crux of the balanced scorecard is the linking together of the measures of the four areas in a causal chain which passes through all four perspectives. (p.67)”
The BSC of Kaplan and Norton state that financial measures represent the pats and non-financial measures drive the future. This is an assumption according to Nørreklit (2000) which is based on that the cause and effect relationship exist between the perspectives and the measures. Their state also that empirical observation is not enough for a company the accounting calculus is crucial, but the BSC is also only support for strategic tool not a replacement for accounting methods.
One important fact Nørreklit (2000) state is the time lag between cause and effect. The values are presented in the scorecard have time differenced . (it was involved in this model a time dimension) They also identified that the causality between quality and financial results is lacking and that the relationship is instead logical. And is develops not only in one direction but the reasoning is circulate and the relationship of the four perspectives are interdependence. Nørreklit (2000) also concluded that the model is a top-down structured and therefore hard to be rooted in a dynamic environment.
Carina Seidel 13-11-2015 Page 25 of 97
The limitations that the BSC is not a replacement for the accounting calculus like Nørreklit
(2000)stated is not applicable for this research, because the BSC is used for additional information. Also this research is not considered to evaluate the implementation of the strategy with this tool.
The most concerning limitations are the trade-off of the measures with Otley (1999) mentioned, the external values and last the time lag. The trade-off of the measures will be controlled by
communicating with the stakeholders. The time lag of the variables, will be considered in the model. External values should be taken in account.
In consideration of the limitations and advantages of the BSC method it complies with the overall need for information contribution and estimation of relevance information. Yet it cannot completely be decided if it fits and support the organisational structure needed within the healthcare approaches. Therefore it will be discussed in a healthcare approach in the next part.
2.3.1.Balanced Scorecard in Healthcare
This part evaluates the research findings about the BSC in health care. The main articles about the BSC were selected and in the last part the indicators of the BSC will be discussed.
Chow, Ganulin, and Haddad (1998) describe the BSC as a customer based planning at focusing and driving an organizations change process. In their results they found out internal business perspective goal is cost control, which led to the logical conclusion that one measurement can relate to multiple goals. In their result they also lay emphasis on guidelines and the unique set of circumstances that makes the BSC should be developed with the unique circumstances.
“Guideline I: The performance measures(s) selected should be positively related to degree of attainment of the related goal; as the latter increases, the former also should increase.[…] Guideline II: Not all the performance measures should be focused on outcomes. Performance drivers also need to be included to serve as leading indicators of outcomes. […]
Guideline III: The number of performance measures should be kept low so as not to diffuse attention and create confusion. […]”(p.7, Chow et al.,1998)
Zelman, Pink, and Matthias (2003) describes the BSC as a useful tool for health care. They stated in the article from 2003 that the found about 142 articles on the BSC in period from 1999 to 2001 (This search was refreshed in a comprehensive way with the search database Scopus, which found about 2730 articles, and the peak was in 2011 with 293 and from the year 2001 it is steady growing to about more than 150 articles). They concluded that the concept of the BSC is relevant to health care, but need modification to reflect the industry. The perspectives they find commonly added is the quality of care outcome.
Peters et al. (2007) have developed an BSC for their own purpose, they have identified six domains: patient perspectives, staff perspectives, capacity for service provision (structural inputs), service provision (technical quality), financial systems. They found out that the BSC has a contribution to the increasing transparency in health sector and enable manager to identify and address of Areas of weakness.
Carina Seidel 13-11-2015 Page 26 of 97
research of Grigoroudis et al. (2012) they found within each perspective two important value for that one hospital. (Development of the KPIs supports the alignment of individual departments or
employees, because they are known were to focus on to achieve the most important improvements)
- Financial:
o current ratio (30.92% importance)
o inventory turnover (33.92 % Importance) - Customer perspective
o patient satisfaction index 23.92%
o average duration of hospitalisation 39.35% - Internal Business perspective
o the surplus inventory (62.40%)
o bed occupancy ratio (19.79%) - Learning & Growth perspective
o resource allocation to information technology/capital (64.45%),
-ten Asbroek et al. (2004) researched how the BSC could be useful for an National healthcare approach in the Netherlands. The linked the BSC to the Lalondes health model thus that the relationship
between population health and health system management can be made. The need for such a
framework was identified by the Ministry of Health, Welfare and Sport to monitor the health system performance in the Nederlands on a national level.
Oliveira (2001) discussed the importance of system data to fill the BSC. Also he argues that the financial indicators which are the main values in the system, give only information about past
performance and allowed only a sort term view of the strategy. The Kaplan and Norton (1996) values outcome (lagging) and driver (leading) were used in his model. The emphasise on the driver indicator is in the approach and creating of the BSC specific distinct, because according to Oliveira (2001) this is the option to build capabilities to improve performance. The concludion remark is that the the BSC helps to integrate hospital performance on a strategic and tactival level.
Above al researchers agree on that the BSC is a usefull tool for the healthcare sector. Zelman et al. (2003), Peters et al. (2007) and ten Asbroek et al. (2004) agreed on that the original version of the BSC should be changed to an health care vision. They used different approaches, where ten Asbroek et al. (2004) used another model to include external values and did not changed the main BSC
Carina Seidel 13-11-2015 Page 27 of 97
Figure 2 – Overview of chosen perspectives within the literature
Pink et al. (2001) changes the definition of three of the perspectives to fit it more to the hospital needs. Lorden et al. 2008 and Pink et al. (2001) all three changed the Internal Process and Learning and growth perspective. Türkeli & Erçek (2010) changes the Internal process perspective to clinical focus and Oliveira (2001) changes the learning and growth perspective. Therefore the customer perspective is most often changed, and four times the internal process and learning and growth is adjusted. The financial perspective is used by al authors and not changed. The selection and description of the ideal balanced scorecard based on this information can be found in the ideal balanced scorecard part.
Chow et al. (1998) and Oliveira (2001) both have more emphazise on the importance of drivers within the BSC. But Oliveira (2001) destinked describes the relationship between the KPI’s.
2.3.2.BSC implemented in Hospitals
In this section case studies and action studies are described which implemented the BSC or an approach based on the BSC in an Hospital or an Hospital group. The experiences an methods are compared and evaluated.
Pink et al. (2001) used the original version of the BSC from Kaplan & Norton 1993 and adjusted it to fit the health sector to use it for 89 hospitals in Ontario in Canada. They chose to change the original four perspectives into four new one. The precise change can be viewed in “Tabel 3”.
Table 3 – Pink et al. 2001 BSC in HC
The four balanced scorecard perspectives of Kaplan and Norton
As adapted for use in a publicly funded health service setting
Financial Financial Performance & Condition
Customer Patient Satisfaction
Innovation and Learning System Integration and Change Internal Business Process Clinical Utilization and Outcome The implementation process is only described for the financial perspective. They divided the
implementation process in four steps and used the knowledge of a Financial advisory panel of experts which was related to the project volunteered to support the implementation.
Carina Seidel 13-11-2015 Page 28 of 97
the perspectives in for their purpose. Each implementation of the BSC is different in their
enforcement. They used a step approach, or implemented the BSC partly or built own frameworks of them. The involvement of experts, or users or departments (stakeholders) in each implementation were a relevant aspect. Nonetheless two studies had issues with keeping the stakeholders involved and interested. Türkeli & Erçek (2010) had resistance with their implementation due to involving and identifying needs of the users (top management, hospital staff). Lorde et al. (2008) had to struggles with the management transparency and the lack of leadership to support their implementation.
In the literature about the implemented case an action study’s it is noticeable that the motivation of the implementation of the BSC by implementation in a hospital are driven by financial factors. (Lorde et al.,2008, Bamford & Chatziaslan, 2009, Türkeli & Erçek, 2010)Other motivations are that the BSC is a useful tool for hospitals because of the complex organisation structure of a hospital and that
therefore performance should be measured with more than a single measure (Pink et al., 2001) The motivation of the academic hospital groups is that they should excel in multiple domains (Hwa et al., 2013)
To support the importance of transparency in the studies of Lorde et al. (2008), Bamford & Chatziaslan (2009), Hwa et al. (2013) there used web-based information services or in Pink et al. (2001) situation a yearly report which was shared under the hospital. In the case of B&C their systems appeared to: “increase the confidence of the clinicians in performance information, improve the
transparency and form the basis for common understanding” (Bamford & Chatziaslan, 2009, p. 732)
between the organisational levels. The system was only implemented partly but the hospital identified the need to implement the whole (strategic) BSC.
In the case study of Lorde et al.,(2008), they could achieve the increase in the patient satisfaction which was the developed perspective of the BSC. Unfortunately this could not help the hospital from their financial failure and it had to be closed.
Pink et al. (2001) did find essential guidelines to create and report measurements. Those are the quality of data and the definition and meaning of information. The experts in their financial advisory panel had more priorities on relevant indicators than commonly known indicators. Also the
information is political and cannot be easily shared, also are hospital not simple to compare because they allocated the resources different. If the comparison of information can be achieved it is valuable indication. In view on the quality of data, Pink et al. (2001) did find out that presenting data is important as data itself, that linkages between them are hard to build and that lack of data, the correctness and the credibility is a concern.
In the research of Hwa et al. (2013) they achieved to developed 16 key indicators which gave them a broad view of their performance of the hospital group. This indicates ensured that the group uses the data to guide strategic decisions and also translate this strategy to the division. After the
implementation they observed that the their divisions had a shared vison. Also each faculty could now see that their individual effort can influence the performance of the whole group. Hwa et al. (2013) stated that the discomfort to share data should be handled carefully and that this issue should be anticipated and discussed. They plans for the future are to “choose metrics that will not simply measure performance but drive it”(Hwa et al, 2013, p. 153)