1
“DEVELOPING A UNIFIED QUALITY MODEL
FOR MIDDLE SIZED COMPANIES”
Master Thesis Business Administration
Author
R.P.J. Kenkhuis
Student number
S1500902
Faculty
Behavioural,
Management and
Social sciences (BMS)
Date
12-7-2016
First supervisor
Dr. R.P.A. Loohuis
2
“
DEVELOPING A UNIFIED QUALITY MODEL FOR MIDDLE SIZED
COMPANIES”
MANAGEMENT SUMMARY
There are different theoretical models for organizations to manage their continuity and structuring their business. All models have their own pro’s and con’s and all organizations live in a specific internal and external environment. The central problem in this thesis is that all these models contain shortcomings. This thesis outlines a review from the EFQM-model, the Six Sigma model and the Balanced Scorecard. By examining the different models carefully, a ‘unified model’ is developed, The unified model takes all the strong points of the different models together. In this research the preference goes through a model with three main blocks as the base. The first block, the ‘Firm’ discusses the ‘what to achieve’ question in organizations. The second block describes the ‘Processes’ by explaining ‘how to achieve’ this. Finally, the first two blocks will be measured in the third block, named as the ‘results. By adding the Six Sigma theory, a continuous improving perspective is adopted and completes the unified model. By validating the model to the selected company, the generalizability of the model is examined. In the heart, this paper designed a model with a wide acceptances to formulate the quality policy of organizations. The unified model can be used as the starting point to, for example, formulate businesses and making strategical choices. The model will benefit most by taking a continuously learning perspective. This research only takes the three models just mentioned in consideration and executes other quality models. The model is validated inside one organization, the model can be developed further by implementing it into other organizations.
Focal company : Aqua + Sprinklersystems B.V.
Address : Molenstraat 61a
Zip code : 7470 AB Goor
Company supervisor : R. Lindenberg
E-mail : [email protected]
University : University of Twente
Address : Drienerlolaan 5
Zip code : 7522 NB Enschede
Academy : Behavioural, management and social sciences
Programme : Business Administration
First supervisor : dr. R.P.A. Loohuis
E-mail : [email protected]
Second supervisor : dr. P. Bliek
E-mail : [email protected]
Author : R.P.J. Kenkhuis
3
PREFACE
In august 2015 I started to get the master’s degree of Business Administration at the University of Twente. Now, nearly 12 months later the final test has almost come to an end. Writing the master thesis was a challenging test for me, combining the different practices from the courses to one paper is not only a difficult process, but also a good measure to check if the right knowledge level is present. After five years of my HBO bachelor in Construction Management, the pre master at the University of Groningen, and the final Master Business Administration at the University of Twente, I can say with satisfaction that all the necessary competences and knowledge havebeen achieved. From this point I am convinced to be well prepared into the working field.
I developed my master thesis within the company Aqua+, where also my second stage of the HBO period took place. It is a medium sized organization and gives the perfect conditions to execute this thesis. In the first place I like to thank Rob Lindenberg and Erwin Zwierink as my external supervisors, and also the sales department team. Finally I am pleased to enter Aqua+ permanently from the 29th of August as a Trainee WO.
Finally, I would thank my internal supervisors, Raymond Loohuis and Patrick Bliek. With their help and advice, I was constantly on the right track when executing this thesis.
Goor, July 2016
4
TABLE OF CONTENTS
Management summary ... 2
Preface ... 3
1. Introduction ... 5
1.1. Contribution to the literature ... 6
1.2. Research question ... 7
1.3. Framework ... 7
2. Literature review ... 8
2.1. Process ... 8
2.2. EFQM-model ... 9
2.2.1. Challenges and limitations from different perspectives ...11
2.2.2. Brief conclusion ...12
2.3. Six Sigma model ...13
2.3.1. Challenges and limitations from different perspectives ...14
2.3.2. Brief conclusion ...15
2.4. Balanced Scorecard ...15
2.4.1. Challenges and limitations from different perspectives ...16
2.4.2. Brief conclusion ...17
2.5. Conclusion ...17
3. Methodology ...19
4. Design ...21
4.1. Heart of the model ...21
4.1.1. Firm ...21
4.1.2. Processes ...21
4.1.3. Results ...22
4.2. Brief conclusion ...22
4.3. Continuous improvement...22
4.4. Brief conclusion ...23
5. Validation ...24
5.1. Selection and context ...24
5.2. Validation by organizational documents ...24
5.3. Face validity ...25
6. Conclusion ...27
6.1. Practical implications ...27
6.2. Limitations ...27
7. References ...28
8. Appendix ...35
5
1.
INTRODUCTION
Rapid development, application of technology and the internet made several significant changes in market environments and, consequently, in business management(Gates,1999; Yang, 2004). These unforeseeable external changes have become more common, which leads to a more complex business environment and an economic situation with ups and downs. All kind of such aspects create a poor predictability of the future, which increases the difficulty to the continuity of businesses(Taipale-Erävala, Heilmann & Lampela, 2014). Consequently, organizations increasingly rely on so-called quality models to sustain business and reduce uncertainty.
There are different theoretical models for organizations to manage and sustain this continuity. To reach this advantage, organizations can’t simply think about quality as a punctual act, it is a whole group of activities that organizations should develop in order to succeed in offering their services of quality (Reyes, 1997). This group of activities can be structured and outlined by setting up a Total Quality Management system (TQM). TQM is crucial to the process of satisfying customers’ needs and generating business profits(Chaudary, Zafar & Salman, 2015). Since the 1980s, total quality management(TQM) has become one of the most used management system(Yong & Wilkinson, 2001). The beginning of TQM can be traced back to the US statistician, W.A. Shewhart, he introduced TQM in the 1920s(Yong & Wilkinson, 1999). Huczynski (1993) defined TQM as “a unified set of principles which can guide them through numerous choices or might even make choosing unnecessary”. Raiborn & Payne(1996) define TQM that it has been driven by the desire to increase profits in the highly competitive business world and that TQM techniques are designed to improve performance. TQM is crucial in the process of satisfying customers’ needs and generating business profits(Chaudary et al., 2015). The last years a significant grow in organizations that begun working toward TQM is visible and it is clear that it contributes to the performance of a company (Jaeger & Adair, 2016). Researchers distinguish different factors which influence the benefits of TQM. To begin, the research from Antony, Leung, Knowles and Gosh (2002) results in seven benefits as output from a factor-analysis. They mentioned the improvement of employee (1)involvement, (2)communication, (3)quality, (4)customer satisfaction and (5)competitive advantage. Also the (6)increased productivity and (7)reducing costs of poor quality are benefits from TQM. Siddiqui and Rahman (2007) agree with Antony et al., (2002) that improved quality, customer satisfaction and increased productivity are benefits from the system. In addition of this, they complete their results by saying that also cost cutting, the quality of services, shorter production times and optimization of HRM activities are strong points of TQM. Sun, Li, Ho & Gertsen (2004) made the shift to more financial and competitiveness aspects, saying that benefits like the ‘improvement of business performance in terms of cost, productivity, quality, customer satisfaction, delivery and market share’. Also Talib, Rahman & Qureshi (2011) see TQM as leading aspect for a greater business performance which finally results in competitive advantage. The above statements underpinned why organizations focuses on TQM and stated different benefits for companies. Nevertheless, there is also another side of the medal, TQM contains also several obstacles.
Jaeger & Aidar (2016) developed a review where obstacles for TQM are presented. They take the five obstacles from Bhat and Rajashekhar (2009) as categories. This contains the lack of (1) customer focus, (2) planning, (3) employee involvement, (4) management commitment and finally the lack of (5) resources. In combination with the research of them, Talib et al. (2011), Sebastianelly and Tamimi (2003) and also Hill (2008) confirm this by agreeing with the categories.
In the above general benefits and obstacles are discussed and this helps to get the basic knowledge/theory and assumptions from the different quality models. These quality models helpfoun organizations to deal with the listed obstacles and create the benefits.
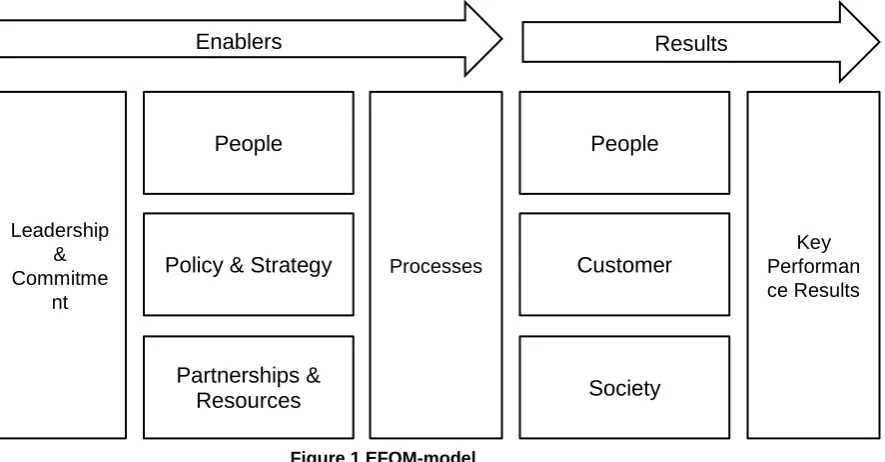
6 system. This model establishes the organization’s strategy and allows the managers to understand the cause-effect relationships which exist between what the organization does, and the results it achieves(Calvo-Mora, Navarro-Garcia & Perianez-Cristobal, 2015). The model focuses on different enablers and results.
The second model is the Six Sigma model, a strategy using statistical method to provide, measure, analyse, renovate and control business processes. The in 1986 developed model’s most important function is to minimize the variables in the production process(Erdogan & Canatan, 2015).
Third model in the TQM atmosphere is the Malcolm Baldrige National Quality Award(MBNQA) model. The model was created by the United States Department of Commerce in 1987 for the evaluation of best practices and businesses(Bell & Keys, 1998). Pannirselvam, Siferd & Ruch (1998) demonstrated it as a framework which is consistent with the principles of TQM by comparing seven key dimensions that explain the processes, procedures, and outcomes associated with an organization(Sun, 2011).
Fourth model is the Balanced Scorecard(BSC). It presents performance measurement approaches for management control by evaluating stakeholders on a scoreboard (Kaplan & Norton, 1992). The BSC combines important practices and concepts from various disciplines and theories into a single performance measurement framework to help improve performance in four ways; financial, customer, processes and competences(Lin, Hu, Tseng, Chiu & Linc, 2016). Implementation of such models in different firms has not only improved the quality, it also enhanced market share, the customer satisfaction, profit and business processes (Cauchick Miguel, Morini & Pires., 2004).
To summarize, the benefits of TQM are the higher business performance, which makes them a distinctive player in the highly competitive environment. Factors like employee involvement, communication, quality and so on are aspects that can affect the benefits of TQM. The models mentioned above are most used in TQM, one model will be excluded from this research. The EFQM is based on the MBNQA and they are both quality award models. Because the EFQM model is more extensive than the MBNQA model, this MBNQA model will be excused from this research(Lee & Lee, 2013). In addition, the Six Sigma will be examined because of its focus on processes and the BSC, though the long term vision of the model.
1.1.
Contribution to the literature
The central problem in this research is that these models have never been systematically compared to each other to examine shortcomings. This is because all models have their own pro’s and con’s and all organizations live in a specific internal and external environment. There is no “best model” that fits for each and every organization, but the model should be adapted to the specific product- and service activities (Piskar & Dolinsek, 2006). Also Yang (2009) describes that, for example, a EFQM model can be used to improve the quality of products and services, the Six Sigma can raise the level of customer satisfaction and process performance and the implementation of the BSC can improve strategy planning and long-term profitability. All the models are involved with the organizations vision and strategy. Gutiérrez, Torres & Molina (2010) stated in their research that implementation of the EFQM- and Six Sigma model are highly complex and need further development. The variety and equalities between the models are causes in the decision-making for quality models from organizations.
7 shows the linkages among the financial performance and strategy, by measuring the performance and see how this influences future results.
This thesis moves beyond the existing literature by evaluating the appropriateness of different quality models. Must they be used separately, be integrated or complemented.
1.2.
Research question
In order to investigate the research problem, the following research question and sub questions are given.
RQ: How does a unified quality model look like, based on different quality models
regarding TQM and validated by design research in middle sized companies?
SQ1: What are the main theoretical assumptions of the different models?
SQ2: What are the strengths and weaknesses for the models from different literature perspectives?
SQ3: Which elements from the different models are crucial to develop the unified quality model?
SQ4: How does a unified model look like by comparing the different models?
SQ5: How is this model evaluated by practioners and what are the key implications for implementation?
1.3.
Framework
8
2.
LITERATURE REVIEW
2.1.
Process
To develop the unified model, a literature review is be executed. This facilitates theory developments of the different models and it creates advancing knowledge(Webster & Watson, 2002). This review is built from peer-reviewed articles, presented from 2000 till present. The papers are searched from different quality management journals like the ‘Total Quality Management & Business Excellence’ and ‘Quality and Reliability Management’. By searching through databases like Elsevier, Sciencedirect and GoogleScholar, five articles from each model are taken. From this point, in total fifteen articles are the base of this review and this section elaborates on this base. In table 1 the list of the articles is presented.
Author(s) Title Journal Reason(s) for its selection
Gómez Gómez, Martínez Costa, & Martínez Lorente (2011)
A critical evaluation of the EFQM model Quality & Reliability Management
Research of 68 organization s, focus on the 2003 version of EFQM-model.
Sadeh, Arumugam & Malarvizhi (2013)
Integration of EFQM framework and quality information systems
Total Quality Management & Business Excellence
Study on the different dimensions between the enablers/results. Doeleman, ten Have & Ahaus
(2014)
Empirical evidence on applying the EFQM Model, a literature review
Total Quality Management & Business Excellence
Literature review based on 24 research studies about the EFQM-model. Kim, Kumar & Murphy (2010) EFQM Model: An integrative review and
research agenda
International Journal of Quality & Reliability Management
Literature review based on 25 papers, which means large-scale data. Bou-Llusar,
Escrig-Tena,Roca-Puig & Beltra´ n-Martı´n (2009)
An empirical assessment of the EFQM Excellence Model:
Evaluation as a TQM framework relative to the MBNQA Model
Journal of Operations Management
Test if the EFQM model captures most main assumptions of TQM concept.
Antony & Banuelas, (2002a) Key ingredients for the effective implementation of Six Sigma program
Measuring Business Excellence
Ingredients generated from a pilot survey UK manufacturing and service organization s.
Kwak & Anbari, (2006) Benefits, obstacles, and future of six sigma approach
Technovation Examining the evolution, benefits, and challenges. Results in key factors for successful implementation. Antony, Jiju Antony, Kumar &
Rae Cho (2007)
Six sigma in service organization s: Benefits, challenges and difficulties, common myths, empirical observations and success factors
Quality & Reliablitiy Management.
Results of a six sigma pilot survey in UK service organization s.
Montgomery & Woodall (2008) An overview of six sigma International Statistical Review Review of the process design and improvement principles.
Brady, J. E., & Allen, T. T. (2006)
Six Sigma literature: a review and agenda for future research
Quality and Reliability Engineering
Trends sources and findings, also relationship with TQM.
Hansen & Schaltegger (2014) The Sustainability Balanced Scorecard: A Systematic Review
Journal of Business Ethics Aims at the balance of finance and non-finance aspect as well the short and long-term measures. Dror (2008) The Balanced Scorecard versus quality
award models as strategic frameworks
Total Quality Management & Business Excellence
Comparison between the BSC and EFQM/MBNQA. Andersen, Lawrie & Savic
(2004)
Effective quality management through third-generation balanced scorecard
International Journal of productivity and Performance Management
9 Atkinson (2006) Strategy implementation: a role for the
balanced scorecard?
Management Decision Review for successful strategy implementation. Hendricks, Hora, Menor &
Wiedman (2012)
Adoption of the Balanced Scorecard: A Contingency Variables Analysis
Administrative Sciences BSC as a strategic planning system.
Table 1 Selected papers for literature review
The literature review starts in each section with a brief description of the model, in this section the research question : SQ3 “What are the main theoretical assumptions of the
different models?” will be answered. Hereafter the model will be elaborated in limitations and
challenges to address the fourth research question: SQ4 “What are the strengths and
weaknesses for the models from different literature perspectives”. Each outline of the model
will end with a brief conclusion to sum up the critical factors and answering SQ5 “Which
elements from the different models are crucial to develop the unified quality model?”.
In order to give a global conclusion about the different models, a schematic overview will be created. This research prefer the multi-criteria analysis of Papaioannou, Vasiliades & Loukas (2015). In this process the first action is the creation of measures. This criteria will be collected from mainly the literature review of the different models, presented in table 2.
Criteria Source
Impact on organization (implementation) Measure from Doelemen, ten Have & Ahaus (2014), zooming on how the model works in practice. Strategical focus One of the measurements (targets and performance measures) of organizational performance
management frameworks from Otley (1999).
Operational focus Core enabler (steering and controlling processes) of the research from Dijkstra (1997).
Long/short term based Another measurement (long-term programs) of organizational performance management frameworks from Otley (1999).
Stakeholder approach The last TQM practice from Yang (2009), zooming on relationship management with suppliers and the belonging culture.
Improving or organizing Second core enabler (involvement in work improvement) of the research from Dijkstra (1997). Table 2 Measure criteria's
The different criteria will be measured by three levels; (1) low, (2) average and (3) high. Finally, the conclusion of the literature review ends with a two dimensional map, where the operational versus strategical aspects and small versus large scope in terms of impact on the organization will be outlined. This final conclusion, together with the review, will be the input for next phase, the design.
2.2.
EFQM-model
10 The first enabler domain is leadership & commitment, where all managers and the executive team inspire and drive the quality as the organization’s fundamental process for continuous improvement of the organization(Dijkstra, 1997). Leaders can organize and synergy people’s activities to achieve the common goal of the organization and besides this, they should create an atmosphere where employees are fully involved in obtaining organizational objectives (Lewis, Pun & Lalla, 2006; Sadeh, Chettiar Arumugam & Malarvizhi, 2013).
People or employees are the second enabler in the model. These employees perform the processes and they are the factors that are able to strengthen the quality of organizations by continuously improving the processes(Tari, Molina & Castejo, 2007). Typical for excellent organizations is the high performance of their employees on the individual, team-based and organizational level, by managing, developing and releasing the full potential of their people( Bou-Llussar et al., 2009).
The creation of partnerships, establishing process measurement and modifying organizational structures are all aspects of implementing effective strategies(Lobo & Ramanathan, 2005), which brings us to the third enabler, policy and strategy. In general, this enabler translate the mission and vision of the organization in policies, plans, objectives and processes, which are aimed to establish this mission/vision.
The quality policy and strategy enabler depends on the way how the management of internal resources and the involvement of suppliers is managed in the organizations(Calvo-Mora, Leal, & Roldan, 2006). These aspects belongs to our fourth enabler, partnerships and resources. When these issues are in control and well managed, it will create a positive effect on the operation of processes.
Finally the processes link the enablers mentioned above to the results of the EFQM-model. Bou-Llussar et al. (2009) underpinned that good organizations design, manage and improve their processes to guarantee high customer- and stakeholders value. To get this high level of value, process management should be a continuous effort, because this is related to several critical aspects, like speed, accuracy and courtesy for the customer(Sit, Ooi, Lin & Chong, 2009).
Where the enablers presenting the way organizations operate, results are focusing on achievements related to organizational stakeholders(EFQM, 2003). First is the people results, were the measurement and the achievement with regard to the people of organizations took place. The research from Chang, Chiub & Chen, (2010) shows evidence that there is a positive link between the employee satisfaction and customer satisfaction. To enhance the performance of employees and create more worker satisfaction, key ideas are intrinsic motivation and collaboration between organizational work units(Au & Choi, 1999).
Leadership & Commitme
nt
Processes
Key Performan ce Results
People
Partnerships & Resources Policy & Strategy
People
Society Customer
[image:10.595.75.518.73.304.2]Enablers Results
11 The second result focusses on the customers results. Madan (2010) relates this to the achievements of an organization in satisfying its external customers, based on the customers’ satisfaction. This satisfaction has long been recognized as one of the critical success factors in today’s competitive business environment as it affects companies’ results(Zakuan, Yusof & Laosirihongthong, 2010).
Society results reflect the achievements of an organization, in relation with the community in meeting its needs or expectations(Madan, 2010). According to Sadeh et al.(2013), good results with respect to community and environment improve the perceptions of the society, which finally creates good results for the organization.
The last results are the key performance results, Sadeh and Arumugam (2010) stated that organizations attempt to achieve excellent performance in terms of key items of polices and strategies.
Finally, the EFQM-model states that the enablers direct and drive the results, in other words, an organization with well-developed enablers will have excellent results(Nabitz, Klazinga & Walburg, 2000). These well-developed enablers can be created by measure the performance periodically and focus on improve the relevant enablers(Kim et al, 2009).
2.2.1. Challenges and limitations from different perspectives
The EFQM model has the assumption that successful organizations, whatever its sector, size, structure etc. must have a good management system(Gómez Gómez et al., 2011). Several studies in the past report positive effects of implementing the model on an organization ’s achievements(Bou-Llusar et al., 2009).
Boulter, Bendell & Dahlgaard (2013) compared organizations (85 European and 35 non-European businesses) who won quality prizes and awards in a period of 11 years. This research showed that companies with awards significantly have better results than those who have not. A notion on the research was that organizations needed a considerable length of time to fully realize the advantages of implementation.
Both literature studies of Davies, Douglas & Douglas (2007) and Davies (2008) focused on the degree of integration of the model. They found that this aspect had an effect on the effectiveness of the model’s implementation. The research describes the multilevel use, its use in strategic planning and the involvement of employees as crucial factors for a successful implementation. Finally, they found that the model only applied as it was meant to be in organizations when it was systematically used over the period of three years, by focusing on the aspects mentioned before, strategic planning etc.
A shift to the causal relations and consistently of the criteria of the model, Prabhu, Appleby, Yarrow & Mitchell (2000) executes a review to evaluate possible associations between a company’s willingness to implement TQM related to the company’s performance. The outcomes of the research demonstrated three linkages in the model. Positive relations exist between: (a) people and people results; (b) leadership and customer results; (c) people related issues on key performance results.
Calvo-Mora, Leal & Roldán (2005); (2006) examined studies about the causal structure of the model. The first study, using questionnaires from 119 senior staff members of various Spanish universities, show different relationships. In the study of 2005 ‘Leadership & Commitment’ has a strong significant positive influence on ‘Policy & Strategy’ and ‘People’. Against this, they found a weak positive impact on ‘Partnerships & Resources’. The three enablers ‘People’, ‘Policy’ and ‘Partnerships & Resources’ together have a positive influence on the ‘Processes’. A notable finding was that there was no causal relationship between the ‘Processes’ and the ‘Customer’ results. Also Reiner (2002) confirms this, a big outcome of his research was that there was no direct relationship between ‘Processes’ and ‘Customer’ results.
12 ‘Policy & Strategy’ on ‘People’ , ‘Partnerships & Resources’ and ‘Processes’. The third and last finding was that the two enablers ‘People’ and ‘Partnerships & Resources’ both have a positive effect on ‘Processes’.
To make the finding’s of the studies more clear, in figure 2 the relations are clarified. The two most mentionable points are the strong relationship between the ‘People’, ‘Policy & Strategy’ and ‘Partnerships & Resources’ enablers on ‘Processes’. Furthermore there is no relation between ‘Leadership & Commitment’ and ‘Partnerships & Resources’.
The case study of Osseo-Assare & Longbottom (2002) illustrated and explained the relevance of the EFQM methodology. Hereby they identify different limitations of the model. First, the model is considered as too prescriptive in philosophy, not in methods and techniques. Second, it requires the right resources and also it is too time consuming. As third aspect, they also prefer a well-defined and deliberate strategy for a successful implementation, in line with the studies of Davies (2008); Davies et al. (2007).
+
+
+
-
+
+
+
+
+
+
+
-
+
+
-
-+
-
+
+
+
Prabhu et al. (2000) Reiner (2002) Calvo-Mora et al. (2005) Calvo-Mora et al. (2006)
A second study of Osseo-Assare et al (2005) focusses on the ‘Leadership’ aspect. Clear communication of the organization’s mission, vision and core values and the implementation of organizational processes based on the support of employees and knowledge are crucial elements for effective leadership. The study suggest a framework which integrates leadership in mission, communication, empowerment and social support .
Bou-Llusar et al (2009) presented a paper analyzing the extent to which the model captures the main assumptions involved In the TQM concept, the technical and social issues. The findings confirm that social and technical elements are embedded in the model, also the interrelationships between them and their influence on results are important aspects to create a TQM framework. Second finding was that the results explain more than 70% of the variation in results, in line with the papers from Reiner (2002) and Calvo-Mora et al. (2005).
The research of Gómez Gómez et al. (2011) offers a more accurate evaluation of the functioning of the model. One of the outcomes was that manufacturing companies are more suitable for the model than public/educational organizations. Second output of the research was the notable sentence that managers should not follow the model to improve results.
2.2.2. Brief conclusion
To answer the sub question: “Which elements from the different models are crucial to
develop the unified quality model”, with regard to the EFQM-model, in this section a brief
conclusion is outlined. By summarizing the points mentioned in the previous part, an overview of the different critical aspects of the model will be created. Some aspects will be the input for the analysis.
Leadership & Commitment
Processes
Key Performance
Results People
Partnerships & Resources
Policy & Strategy
People
Society Customer
13
Author(s) Critical aspect
Boulter, Bendell & Dahlgaard (2013) Organizations needed a considerable length of time to fully realise the advantages of implementation from the model.
Davies (2008); Davies, Douglas & Douglas (2007)
Level of integration is important, its use in strategic planning and the involvement of employees as crucial factors for a successful implementation. The model only applied as it was meant to be in organizations when it was systematically used over the period of three years.
Prabhu, Appleby, Yarrow & Mitchell (2000)
Calvo-Mora, Leal & Roldán (2005); (2006) Reiner (2002)
Strong relationship between the ‘People’, ‘Policy & Strategy’ and ‘Partnerships & Resources’ enablers on ‘Processes’. There is no relation between ‘Leadership & Commitment’ and ‘Partnerships & Resources’
Osseo-Assare & Longbottom (2002) Model is too prescriptive in philosophy, it requires the right resources and too time consuming.
Osseo-Assare et al. (2005) Effective leadership relies on clearly communicating of mission, vision and core values. Also handsome processes with support of employees and knowledge are important.
Bou-Llusar et al. (2009) The results explain more than 70% of the variation in results, good consistency.
Gómez Gómez et al. (2011) Manufacturing companies are more handsome for the model than public/educational organizations.
Table 3 Critical aspects EFQM model
2.3.
Six Sigma model
The Six Sigma model was developed by Motorola. Bill Smith, designed the program in 1986 responding the necessity for improving quality and reducing defects in their products. They established the model as an objective for the corporation and besides this, as an end point for process and product quality improvement efforts(Montgomery and Woodall, 2008). The basic concept of Six Sigma is a specific, disciplined and quantitative approach for improvements, based on defined metrics in manufacturing, service or financial processes(Kukreja, Ricks & Meyer 2009). In 1997, The Financial Times defines the initiative as “a program aimed at the near elimination of defects from every product, process and transaction.”
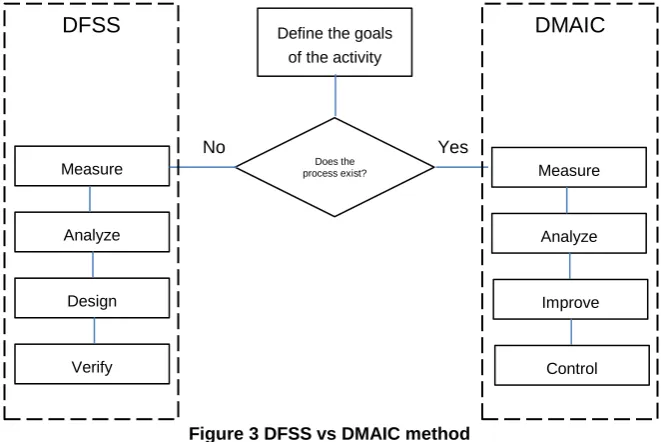
Six sigma projects follow a disciplined process though four macro phases: Measure, Analyze, Improve, and Control (MAIC). In some cases the define phase will be added. This relates to an appropriate selection of projects, problem definition and defining the metrics(Hahn, Hill, Hoerl & Zinkgraf, 1999). Hereafter, in the measure phase the appropriate responses to improve will be select. Measuring the process to satisfy customer’s needs and developing a data collection plan are the next events and it ends with the collection of data to determine issues and shortfalls (Kwak & Anbari, 2006).
In the next phase, the ‘analyze’ phase, causes of defects and the sources will be discussed by developing a document current performance. Next, the different opportunities and impacts will be mentioned to improve processes (Hahn et al., 1999).
The fourth step is the improvement of the processes and the elimination of variations. Besides this, developing new alternatives and the implementation of an enhanced plan are key elements of this step. Last step is the controlling of the improved process by making a defined strategy to monitor and control the process.
Another concept of the Six Sigma theory is the ‘Design for Six Sixma’(DFSS) process. The major objective here is to “design things right the first time”(Sokovic, Pavletic & Pipan, 2010). DFSS requires the rigorous use of tools and best practices to fulfil customer requirements and brings financial benefits by satisfying customer requirements(Mesec, 2005). De Feo & Bar-El (2002) explain this by focusing on creating new or modified designs that have higher levels of performance. The relationship with the classical DMAIC process are the define and developing phase. In figure 3 the relationship is clarified.
14 Finally, Montgomery & Woodall (2008) also mentioned lean manufacturing as an element of Six Sigma. These systems are designed to eliminate waste (Womack & Jones, 1996).
In this sense, waste means that product cycles are too long, rework what must be done and other aspects that created failure costs. The process cycle efficiency, process cycle time, work-in-process and throughput rate are important metrics in lean and organizations can greatly benefit by using simulation models based on these metrics (Zahra & George, 2002).
In conclusion, Six Sigma gives tools and techniques for product and process improvement methodology that identifies and improves efficiency and quality in everything an organization does throughout its operations worldwide(De Feo & Bar-El, 2002). Also knowledge about variation, what causes it, and how to reduce it by identifying cause and effect relationships are fundamental aspects of the Six Sigma thinking(Montgomery & Woodall, 2008).
2.3.1. Challenges and limitations from different perspectives
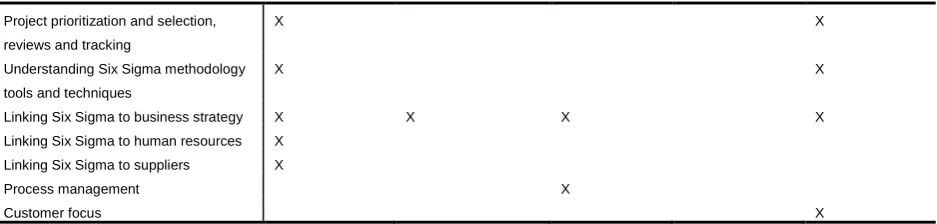
In the past, different researchers executed literature reviews and discussions to elaborate on the Six Sigma theory and found different critical aspects when using this theory. In this section, first the factors for a successful implementation from the model inside organizations will be outlined. These factors are collected from six different literature reviews from 2002 till 2007 which are peer-reviewed articles. Anthony & Bannelas (2002a); (2002b) distinguish eleven different factors which are leading in this review, see table 4. First notable finding is that the factor ‘project management and leadership skills’ returns in all the six reviews as critical success factor. Other frequently returning factors are the ‘training’ from the employees and also the ‘linking of Six Sigma to business strategy’. Last remarkable critical factor is the ‘management involvement and commitment’.
Critical success factors Anthony & Bannelas (2002a); Anthony & Bannelas (2002b)
Johnson & Swisher (2003)
Starbird (2002) Kwak & Ambiri (2006)
Anthony, Anthony & Kumar (2007)
Management involvement and commitment
X X X X
Cultural change X X X
Organization/ financial infrastructure X X
Training X X X X
Project management and leadership skills
X X X X X
Define the goals of the activity
Measure process exist? Does the
Analyze
Design
Verify
Measure
Analyze
Improve
Control DMAIC DFSS
[image:14.595.123.454.70.291.2]No Yes
15 Project prioritization and selection,
reviews and tracking
X X
Understanding Six Sigma methodology tools and techniques
X X
Linking Six Sigma to business strategy X X X X
Linking Six Sigma to human resources X Linking Six Sigma to suppliers X
Process management X
[image:15.595.69.538.70.182.2]Customer focus X
Table 4 Factors for successful Six Sigma implementation
Focusing on the factor of ‘linking Six Sigma to business strategy’ there is also a challenge. Hammer & Goding (2001) argued that the model is the input for criticism and controversy in the quality community and Catherwood (2002) underpinned this by saying that Six Sigma is nothing new and simply repackages traditional principles and techniques related to quality. Another limitation, mentioned by Lindsen (2016) of the Six Sigma methodology is that it doesn’t make the link between strategic goals and process optimization. To create this synergistically effect, aspects like strategical control must be added. The success of the improvement is based on the customer satisfaction and this can only be reached by having a ‘long breath’ to handle complex and long-term projects(Tennant, 2002; Schurr, 2002).
2.3.2. Brief conclusion
By answering the sub question: “Which elements from the different models are crucial to develop the unified quality model”, focusing on the Six Sigma model, different critical aspects of the model are summarized.
Author(s): Critical aspect:
Anthony & Bannelas (2002a); Antony & Bannelas (2002b); Johnson & Swisher (2003) Starbird (2002); Kwak & Ambiri (2006); Anthony, Anthony & Kumar (2007)
Project management and leadership skills are important aspects for effective implementation, in other words the training from employees will be beneficial.
Anthony & Bannelas (2002); Bannelas, Coronado & Antony (2002); Johnson & Swisher (2003) Starbird (2002); Anthony, Anthony & Kumar (2007); Pande, Neuman & Cavanagh (2000)
Linking of Six Sigma to business strategy. It must be clear how Six Sigma projects and other activities link to the customers, processes and competiveness.
Catherwood (2002) Six Sigma is nothing new and simply repackages traditional principles and techniques related to quality.
Lindsen (2016) It doesn’t make the link between strategic goals and process optimization.
Tennant (2002), Schurr (2002) Succes can only be reached by having a ‘long breath’ to handle complex and long-term projects.
Table 5 Critical aspects Six Sigma model
2.4.
Balanced Scorecard
16 Scorecard is, in addition to the financial results of organizations, to measure those dimensions which influence the future financial results (Dror, 2008). Organizations who measure the three suggested perspectives, customer, processes and innovation and adopts this approach are not required to stick to these perspectives (Wongrasssamee et al., 2003). By determining the cause-and-effect change from the perspectives it creates financial success in companies(Hansen & Schaltegger, 2014).
From its origin, the Balanced Scorecard focuses on individuals and groups of performance indicators to measure and manage implementation of strategic objectives (Kaplan and Norton, 1992). Later on, the focus made the shift to the description of strategy using these cause-and-effect chains between objectives, which illustrates the second-generation approach of the balanced scorecard (Neely, Marr, Roos, Pike & Gupta, 2003; Cobbold and Lawrie, 2002).
For this second generation approach Kaplan & Norton (2004) introduced ‘strategy maps’ , diagrams that describes how an enterprise creates value by connecting strategic objectives with each other in explicit cause-and-effect relationships in combination with the Balanced Scorecard. The effort of this second generation is the more comprehensive view of organizational performance, the performance measurement and performance management(Hansen & Schaltegger, 2014).
Different researchers developed the third generation of the Balanced Scorecard. Andersen, Lawrie & Savic (2004) suggest that there are four elements which are all components for a framework like this third-generation. First, a better strategical context where quality initiatives are leading and take care for huge organizational advantages are important. Next, a process which elaborates the strategic direction and goals into lower-level goals and concrete activities must be created and an evaluation of TQM initiatives with focus on the defined strategic priorities must be done. Finally mechanism for monitoring and two-way feedback which will take care for downward communication must be added to the second generation approach. (Andersen, Lawrie & Savic, 2004).
Also Hansen & Schaltegger, (2014) propose a new generation of this quality method, the Sustainability Balanced Scorecard. The first benefit is it allows managers to address goals in three dimensions, by integrating economic, environmental and social issues. Secondly the version of Hansen & Schaltegger (2014) integrates these three dimensions in a single integrated management system.
2.4.1. Challenges and limitations from different perspectives
To distinguish the challenges and limitations of the Balanced Scorecard, this section begins with a critical point about the first generation of the model. According to Hudson, Smart & Bourne (2001) it provides no system to build and maintain the relevance of defined measures like good coverage of performance measure dimensions. Atkinson, Waterhouse & Wells (1997) mentioned that it does not fit to the stakeholder approach and performance management. Because of this, it often fails to effectively address problems in relation with employee and supplier contribution, its more biased towards stakeholders(Neely, 2002; Neely, Adams & Kennerly, 2002; Smith, 2005). Another potential problem from Gering and Mntambo (2002) is the risk that the Balanced Scorecard results in a series of four independent and uncoordinated ‘lists’ of measures.
Next difficulty is that organizations perceive problems when they integrate the Balanced Scorecard with other quality models, Ahn (2001) the scorecard prefers to be replaced than to be complement with other systems.
The study from Hendricks et al. (2012) mentioned that the BSC incorporates both nonfinancial and future-oriented information and they suggest that a strategic planning system would be particularly useful for firms where environmental uncertainty is high. The BSC will help to get a better management understanding of the linkages in the organization and the strategic goals. Factors which can affect the effectivity of the BSC are the firm size and environmental uncertainty.
17 the concept is not interpreted too rigidly but more seen as a tool for sustainability-oriented organizational development.
Dror (2008) made an extensive analysis from the BSC, versus quality award models, like the EFQM-model, and stated some essential limitations. He mentioned that the BSC is too much focusing on learning as the only source for causality, a lack of basic guidelines for selecting performance measures and also the complex feedback from the financial perspective to the customer and the processes perspectives.
2.4.2. Brief conclusion
In this chapter a range of literature has been reviewed to understand the different models and understanding several critical factors. This section of the chapter will give insights for the BSC by summing up all these factors.
Author(s): Critical aspect:
Hudson, Smart & Bourne (2001) Short term vision, reason for creation of SBSC, sustainable Balanced Scorecard.
Atkinson et al. (1997) No stakeholder approach, a more extensive approach captures the link with strategic issues.
Gering & Mntambo (2002) Risk of uncoordinated list of measures, diversity of organizations is leading here. Every organization is different and needs a specific model.
Ahn (2001) Prefer replacing above completion in combination with other quality models
Table 6 Critical aspects BSC
2.5.
Conclusion
This section summarizes the research literature by giving a global conclusion. This conclusion contains in the first place a multi-criteria analysis resulting in a two dimensional model of different aspects. Based on the sections before, the multi-criteria analysis is developed in table 7.
Beginning with the EFQM-model, it scores high, on the impact on organization and the strategical- and operational focus. because of the multi-level use mentioned by Davies (2008); Davies et al., (2007). The Six Sigma model is more focused on processes and aims at improving, also it affects a smaller scope, regarding to table 4 (project management and leadership skills) of the organization than the EFQM-model. The Six Sigma asks for a more operational focus, instead of the more strategical focus from the BSC(Kaplan & Norton, 1997).
Looking to the ‘long term based’ criteria, Six Sigma is most beneficial though the constantly improving way of the model. The BSC is a more measurement method, where EFQM-model is more a management tool, what implies the lower score on this criteria. The stakeholders are only involved in the EFQM-model, focusing on the ‘partnerships & resources’ enabler. The BSC and Six Sigma, to make a concluding note, are more focused
Criteria: EFQM-model Six Sigma model Balanced
Scorecard
Impact on organization (implementation)
3 2 1
Strategical focus 3 1 3
Operational focus 3 3 1
Long term based 2 3 1
Stakeholder approach 2 1 1
Improving 2 3 3
Total 15 13 10
18 on the improving of organizations and processes, where the EFQM-model focusses more on the quality of management.
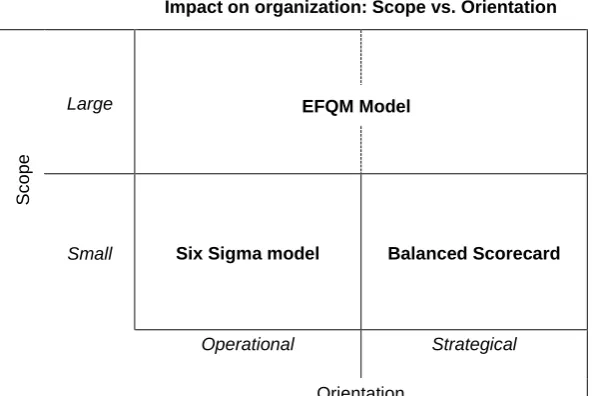
To make the above information more visible and clear a two dimensional model is built, see table 8. This model explains on the x-axis the orientation in forms of operational and strategical vs. the large or small scope on the y-axis. The EFQM model focuses has both operational and strategical focus and integrates in a large scope of the organization. The BSC has a more strategical view against the Six Sigma’s operational view, both with a small scope in terms of impact on the organization.
Impact on organization: Scope vs. Orientation
Sc
o
p
e
Large
Small Six Sigma model Balanced Scorecard
Operational Strategical
[image:18.595.151.449.196.394.2]Orientation
19
3.
METHODOLOGY
In order to design and test the “unified model”, a sophisticated process must be adopted. Iivari (2007) underpinned in his article that no concerted method exist to provide the required guidance and rigor to design and improve artifacts, his definition of models. This paper prefers the Action Design Research(ADR) method of Sein, Henfridsson, Purao, Rossi & Lindgren (2011). They see the model, just like Iivari (2007) as an artifact and the designing of such kind of systems, involves dimensions beyond the technological, saying that it is a result from the interaction of design efforts and contextual factors throughout the design process(Gregor and Jones, 2007). ADR is a research method for generating design knowledge through building and evaluating ensemble artifact in an organizational setting(Sein et al., 2011). The method involves four stages, the problem formulation, the building, intervention & evaluation, the reflection & learning and finally the formalization of learning.
Beginning with the first stage, the problem formulation, different tasks involves this stage. These tasks are already formed in the previous chapter, focusing on, for example, the research questions and identifying and conceptualization research opportunities. Sein et al. (2011) distinguish between two principles, a practice-inspired research artifact and a theory-ingrained artifact. Where the practice-inspired research emphasizes on field problems, the theory-ingrained artifacts is built from several theories. As shown in the previous chapter, this model is based on different theories, mentioned in the literature review. So in this case we are building from a theory-ingrained artifact.
Now we enter the design phase, we are in line with the second stage from Sein et al. (2011), where building, intervention and evaluation (BIE) are the central issues. The output from the first stage provides a solid base to create a unified model. Sein et al. (2011) defines three principles for this stage. In the first place the ‘reciprocal shaping’, which emphasizes the inseparable influences from the IT-dominant artifact against the organization-dominant artifact. This research prefers the form of organization-dominant BIE, where the primary source of innovation is organizational intervention. By building the model from different theories and validate it into the selected company, these influences will be examined.
The next principle of Sein et al. (2011) are the ‘mutually influential roles’. This principle zooms on the importance of the learning adjustment from the project participants. Where action design researchers extract their knowledge from different theories, practioners base their knowledge on practical experience. Switching to the research of this paper, we adopt the role of the action design researchers and took practitioners from the selected company to counter the theory to practice link.
The fifth principle is the ‘authentic and concurrent evaluation’ principle. Sein et al. (2011) underpinned that this is not a separate phase of the process, but follows up the building of the model. In their research, they adopt evaluation cycles by distinguishing between alpha and beta versions. These cycles are the fundamental method from ADR, where a continuously improving cycle will be created. In this research only one cycle will be executed from the ADR method.
The last two principles involve the final stages, the reflection & learning and formalization of learning. Focusing on the reflection & learning stage, Sein et al. (2011) place this separate to the first two stages. This stage takes care for a continuously reflection on the formulated problem and the belonging theories. It has been driven by one principle, ‘guided emergence’. This principle explains that an artifact reflect not only the preliminary design, but also built from different other perspectives and organizational use.
20 Figure 4 ADR-method
This research will only execute the ADR-cycle of Sein et al. (2011) one time. To make this more clear, in table 9 the method is mirrored to this research. The different stages are now linked to the chapters, beginning with the design phase in the next chapter.
Stage: Principle: Chapter:
Problem Formulation Theory-Ingrained artifact 2. Literature review Building, Intervention and Evaluation Reciprocal Shaping
Mutually Influential Roles
4. Design 5. Validation
Reflection & Learning Guided Emergence 6. Conclusion
Formalization of Learning Generalized outcomes 7. Managerial implications
[image:20.595.91.503.444.544.2]21 FIRM
Internal External
Leadership CSR Policy & Strategy Customer
Core value’s Market People
Product
PROCESSES
Primary
Inbound logistics Operations Marketing Sales Marketing & Sales Outbound logistics
Secondary
HRM ICT
R&D BIM
rocurement
Figure 6 Processes
4.
DESIGN
The design starts with developing the heart of the unified model. Second, the focus is on the improvement of organizations in line with the model. This chapter elaborates on ‘How
does a unified model look like by comparing the different models?’.From the literature review
we can conclude that it’s possible to combine different aspects of the different models to establish a unified model. The model will be explained by going through the different aspects. This research proposes a quality model with three ‘building blocks’ as main topics.
By starting with a focus on the EFQM-model, the model will be simplified into the three building blocks. The first block is the ‘Firm’, second the ‘Process’ and third the ‘Result’. The blocks will now be discussed one by one.
4.1.
Heart of the model
4.1.1. Firm
“Firm resources include all assets, capabilities, organizational processes, firm attributes, information, knowledge, etc. controlled by a firm that enable the firm to conceive of and implement strategies that improve its performance”, listening the definition of Daft (2012). Otherwise, the ‘firm’ has a wide range of definitions involving many different concepts. This is directly the argument why this research suggested ‘firm’ as the first building block. Organizations have to define aspects like policy & strategy, the organization and core value’s about the internal organization, which emphasizes the first focus of this block. Next part of firm component is the external view of the organization, where points like Corporate Social Responsibility(CSR), customer-, market- and product view are be mentioned. Organizations defines always define goals and a mission/vision etc. with a view on the internal aspect. These internal aspects are based on the external analysis, targeting the market/product/consumer aspects. This research takes the idea that the ‘firm’ block answers the ‘what’? question in organizations to achieve. The mix of internal and external aspects, give organizations the space to fully integrate their business idea in the organization. This brings us to the second block of the model, explaining the process.
4.1.2. Processes
The process discusses how the organization tries to achieve these aspects from the leadership topic by explaining their processes. This involves the primary processes and the secondary processes. The primary activities typifies the physical creation of the product and its sale and transfer to the buyer as well the service afterwards(Porter, 2001). In this case, we talk about, for example the inbound logistics, operations, outbound logistics, marketing sales and services. For all organizations this can differ in sequence and quantity of activities. To perform these primary activites, support activities can be created to improve the performance of the primary activities. We call this the secondary activities. Examples of such kind of activities are a human resourche department (HRM), technology department (R&D) and also
the procurement are supporting aspects to the perfomance rate of a bussiness. Where the first block explaines the ‘what’ question, this block zooms on the question ‘how’ organizations achieve their defined mission/ vision. Important aspect in this case is that the ‘proces’ is in
22 Figure 8 Consistency of the
model
line with the ‘firm’, by making interrelated connections between them and by measure both blocks. The measurement of the blocks, brings us to the final block, the ‘results’.
4.1.3. Results
In the result area the defined goals from the firm and processes are listed and measured. The perspectives from the BSC are taken to measure. On this hand, goals will be viewed from a financial, consumer, employees and innovation perspective. To counter the note from Gering & Mntambo (2002), mentioning the risk of uncoordinated list of measures, we take the first two blocks as fundamental part of the results, on this way, quality managers are able to make relations between the blocks and translate their goals in measurable aspects. The original BSC includes also the processes aspect. In this research we replace this aspects for employees. Not only because we defined processes as a building block but also we counter the finding of Atkinson et al. (1997), they noticed that the BSC adopts a no-stakeholder approach.
4.2.
Brief conclusion
By making a compact model, it’s easy to apply the model on different organizations. This research prefer more freedom in the definition of firm and process aspects. It ensures a model that adopts the fundamental activities of the organization and it creates higher diversity between models from companies. By doing this, shorter length of times to realize the advantages of implementation of the model will be created, to handle the finding of Boulter et al., 2013). Besides this, also the level of integration is easier to strengthen by linking the internal and external aspects (Davies et al., 2007; Davies, 2008). The results are based on the
‘firm’ and ‘processes’ blocks and it’s the third complementing block. If we collect the three blocks and place them into a model, the design of the heart of the model is complete, figure 8 shows the model and its consistency by colors.
4.3.
Continuous improvement
The next step is to make the quality model a model that adopts a continuous improvement vision. As mentioned in the literature review, the Six Sigma model is a more operational model with a small scope and thus ideal to use to improve organizations. A throwback to this model brings us to the DMAIC process and this process will be leading in the suggested model to improve organizations. The define phase involves the elaboration on ‘businesses’ and ‘processes’. We measure and analyze this in the ‘results’ block, resulting
RESULTS
Firm Processes
Internal External Primary Secondary
Financial Consumer Employees Innovation
[image:22.595.361.520.609.745.2]23 in an overview (BSC) with the improvement points based on the ‘business’ and ‘process’ from different perspectives.
These three steps, measuring, analyzing and improving will be summarized in the business plan of the organization and is the input for continuously improving organizations. Hereafter, the whole quality of the organization and also the business plan will be ‘controlled’ by the TQM system of the organization.
Define
As we described in the chapter before, the ‘firm’ and ‘process’ illustrates the ‘what’ and ‘how’ question inside organizations. In the define phase of this model, different descriptions and goals of the firm will be outlined. Taking an internal/external view for the firm and thereafter a focus on the primary and secondary processes a broad scope will be examined. Important aspect here is to make connections between the business strategy, customers, processes and competiveness (Anthony & Bannelas, 2002; Bannelas, et al., 2002; Johnson & Swisher, 2003; Starbird, 2002; Anthony, et al., 2007; Pande, et al., 2000). These connections counter the aspect of Lindsen (2016), mentioning that Six Sigma does not make the link between strategic goals and process optimization.
Measure
This step involves the search for process defects/problems. Through the execution from audits, summarized in monthly reports, a defined manner for the measure phase is developed. Notable thing in this step is to create a specific and coordinated list of measures, in line with the defined aspects in the ‘firm’ and ‘processes’ steps. In this case the finding of Gering & Mntambo (2009), the risk to get a list with uncoordinated measures will be solved.
Analyze
The analysis of the total organization must be done by setting up a business plan. This plan involves the ‘results’ step and mirrors the defined goals in relation with the real output from these goals. Kwak & Anbari (2006) summarize this phase as the search to causes of problems and the belonged sources, ending in opportunities for future improvements.
Improve
This phase is the last step where the possible solutions will be planned to improve the organization. The final chapter of the business plan summarizes these aspects.
4.4.
Brief conclusion
This examination has chosen to start in first place with a small model, based on three building blocks. By doing this, organizations have to take a more explorative position in the formulation of their business. Such a position requests a more outside-in view, rather than an inside-out view. By doing this, organizations are not dependent from, for example, the enablers and results from the EFQM-model, but can choose the ‘stones’ needed to create a well-defined and organization specific model. To create a consistent model and counter the possibility for a uncoordinated list of measurement, the ‘firm’ and ‘process’ block are the base of the ‘result’ block. This last block mirrors the defined goals to the four perspectives.
As mentioned before, the completion of the Six Sigma model, excluding the control phase, takes care for a continuous improving model. These phases are linked to the different blocks to avoid uncertainties.
24
5.
VALIDATION
As mentioned in the theoretical framework, this chapter zooms on the usability of the model inside organizations. This chapter elaborates on the question “How is the this model evaluated by practitioners and what are the key implications for implementation?”. This will be done by mirroring it to the selected company. The first part of this validation section focusses on the current quality system, where organizational documents gives us insights. The second part is based on an extensive workshop with different managers, where the model is applied to the organization and discussed in different perspectives. By doing this, the model will be tested though practical experience (Sein et al., 2011).
5.1.
Selection and context
The focal company in this research is Aqua+ Sprinklersystemen B.V. In 1895 the director starts with a small installation company and in 1977 they made the shift to sprinkler systems and associated extinguishing systems. Nowadays, the organization employs 200 employees divided over 4 locations with its headquarter in Goor. The company is selected, because its medium size. For them, TQM is an essential element of good organizational performance. Besides this, they work in a variated market with all kind of new and existing construction projects. Also the maintenance of installed systems is coordinated from the service department (Aqua, 2016).
The size, variated market and considerable service department makes this organization an attractive and interesting focal company for this research. Furthermore, Aqua+ wants to know the optimality of their current business model based on future trends. By validating the unified model into the organization of Aqua+, it will be tested and prepared for future trends.
5.2.
Validation by organizational documents
Aqua+ is from the beginning of the nineties century owner of the ISO 9001 quality system, where also the occupational health safety and environmental performance are integrated. On this way, stakeholders are ensured for a high level of the quality of the delivered products and services. Goals are planned at enterprise level as well on department level. These goals and relevant policy aspects were communicated with permanent consolations. Besides this, there is diversity in informal meetings, middle management meetings, newsletters, interim bonus rapports where employees be informed about trends and results of the goals.
The quality system of Aqua+ is in the first place build as part of the daily course of events, integrated in the whole organization from the highest – to lowest level. They see the content of the business plan as the
[image:24.595.70.534.204.757.2]fundamental base for the quality policy. In this business plan the goals and results are mentioned from current and future years. This business plan is based on the EFQM-model, where the society block is replaced for corporate social responsibility. In this business plan the evaluation and goals are discussed at organizational level. The main goals for future years will be communicated and executed through detailed department plans. All heads of departments make their own plan in line with the business plan and all thee department plans together creates the underlying base of the business plan. These department plans will be reported each quarter and the output will be the input for future improvements and recommendations. Finally this is being taken to the new year business plan and then the improvement cycle is complete. Aqua+ formulates this improvement cycle as the PDCA-cycle, based on plan, do, check and act.