Avoiding Denial of Service via Stress Testing
∗Saeed Abu-Nimeh, Suku Nair, and Marco Marchetti
HACNet Lab
Southern Methodist University
Dallas, TX 75275
{
sabunime, nair, marco
}
@engr.smu.edu
Abstract
Stress-testing has been widely used by businesses, gov-ernments, and other organizations to evaluate the strength of their web applications against various attacks. How-ever, the quality of these tests is under constant scrutiny to determine their effectiveness. The present study compares four stress-testing tools, by performing the tests on two ma-jor web-based applications. All of the tools used are open source, and run on Win32 platform. The test scenarios are recorded from server log files to make the tests more real-istic. Lastly, we discuss how to use stress-testing tools as a measure to avoid Denial of Service attacks on web servers and web applications.
Keywords
Denial of Service, Stress-testing, Ramp-up time, Think time, Response time, TTFB, TTLB, Bandwidth throttle.
1. Introduction
Web-based applications have been used ubiquitously ei-ther for internal (intranet) or external (internet) use because of the fact that they are user friendly, portable, and reliable [20]. When the web application is deployed on the server, it becomes hard to predict its behavior due to external fac-tors, which affects it, such as: number of users browsing the application, available bandwidth, or network congestion [18]. Therefore, it is important to test the application and the server before the deployment stage to get more reliable system and better performance [22].
There are several techniques that can be used for testing web applications, such as: performance testing [21], functional-ity testing, regression testing, stress-testing, or load-testing
∗This work was completed on an internship at Dallas Semiconductor Dallas, TX.
[11]. In this paper we concentrate on two testing techniques: stress and load testing. Sometimes stress-testing and load-testing are used in conjunction with each other. They both simulate multiple concurrent virtual web users to place a load on a server or application, however they are really two different techniques.
Stress-testing as in [17] is used to force programs to oper-ate under limited resource conditions. The goal is to push the upper functional limits of a program to ensure that it can function correctly and handle error conditions grace-fully. On the other hand, load-testing shows how a program handles large amounts of data, excessive calculations, and excessive processing. In this case, we do not necessarily have to push or exceed upper functional limits.
According to [13] there are several circumstances which call for load-testing, such as: Determining the response time of the application if the load on the application is increased, measuring the effect on response time when a new func-tionality is added to a web application, or performing IT infrastructure changes.
Denial of Service (DoS) is one of the security threats that cause businesses, governments, and organizations a lot of revenue losses. In February 2000, eBay, Yahoo, Amazon, Buy.com, and others suffered from and a deadly DoS that caused a total loss of $1.2 billion [23]. Another attack in January 2001 on Microsoft caused a lot of damage and af-fected the company’s reputation. The Computer Emergency Response Team (CERT) was also targeted in successful Dis-tributed DoS (DDoS) attacks in March 2001.
Stress-testing web applications can be useful as avoidance against DoS. By measuring how the server performs under stress, operators can predict how that server will perform in the real world. Accordingly, they will be able to approxi-mate the amount of traffic or the number of concurrent users the application or the server can handle in order to avoid DoS. In this study, we use stress-testing to determine the breaking point of web-based applications and to see how these applications respond when put under stress.
related and previous work. Section 3 presents systems, ap-plications, and tools used in performing stress tests. Section 4 summarizes the experimental results. In section 5 we dis-cuss the results and comment on using web stress-testing to avoid DoS. Finally, we draw conclusions and discuss future work in section 6.
2. Related Work
Many researchers have considered the problem of ana-lyzing and studying the performance of web servers and web-based applications. Load generators have been used to measure performance by generating synthetic load of HTTP requests for the server. These load generators pro-vide performance statistics, such as throughput in HTTP operations/second, the count of request methods, response codes, URL popularity, and transfer size distributions. By measuring how the server performs in a controlled environ-ment, operators will hopefully have a reasonably good no-tion of how that server will perform in the real world [15]. WebStone [2], which was released in 1995, is one of the oldest workload generators. It did only simple request gen-eration for 5 unique files, ranging from 500 bytes to 5 MB. In 1996, SPECweb96 [3] was released to be the first SPEC’s workload generator. Later on, Banga and Druschel [9] pro-posed measuring web servers with tools that can generate and sustain overload, which is equivalent to simulating an infinite user base. To be able to generate such loads, they presented a tool called s-clients. In addition, they intro-duced the notion of open-loop workload generation. Most workload generators are tightly coupled to the server they are measuring so they are considered as closed-loop where they wait to generate a new request only after a response has been received.
Barford and Crovella [10] proposed the first workload gen-erator SURGE that reproduced server workload character-istics such as: document popularity, embedded references, and transfer size. Mosberger and Jin [14] proposed a quan-titative performance analysis tool httperf that is capable of generating and sustaining overload of web servers. The tool can readily be used to perform various kinds of web-server related measurements. It also includes the open-loop model used by s-client. Nahum et al. [16] proposed WaspClient a hybrid workload generator to evaluate server performance in wide-area networks. They used SURGE’s workload model with the request generation engine from s-client.
SPECweb99 [4] is one of the standard workload generators used in the computer industry for performance evaluation, robustness testing, and evaluating server optimizations. It measures the maximum number of simultaneous connec-tions requesting the predefined benchmark workload that a web server is able to support while still meeting specific
throughput and error rate requirements. The connections are made and sustained at a specified maximum bit rate with a maximum segment size intended to more realistically model conditions. To ensure that connections are conform-ing, SPECweb99 monitors the bandwidth available to each connection and enforces both an upper and lower bound on that bandwidth [15].
On the other hand, there has been work in testing and an-alyzing the contents of web applications. Wu and Offutt [24] defined a generic analysis model that covers both sta-tic and dynamic aspects of web-based applications. Their technique identifies atomic elements of dynamic web pages that have static structure and dynamic contents. Kung et al. [12] proposed testing web applications using Object Ori-ented model. Ricca and Tonella [19] used the UML model to analyze and test web applications. Apparently, most of the work is done in testing contents, design, performance, or load of web-based applications. However, there has not been much work in stress-testing these applications.
3. Methodology and Evaluation Approach
3.1. Description of systems and applications
We used four open source stress-testing tools. All of them run on Win32 platforms. We tested two web-based intranet applications: ScheduleA and eZGoals.
ScheduleA: is a web-based intranet application, developed at Dallas Semiconductor [1]. It is a product sales man-agement system for new and existing customer-based in-formation. It tracks all budget forecasting of certain prod-uct lines between business units and field sales offices. It manages, tracks, and profiles emerging customers through the approval stage after negotiation process between the two entities. The application uses connection pooling to speed up response time. Table 1 shows the system platform and database system specifications. Figure 1 shows the structure of ScheduleA.
Figure 1. Structure of ScheduleA.
eZGoals: is another web-based intranet application, developed at Dallas Semiconductor. It is used to track, manage and report test engineering quarterly goals. The application has over 500 users ranging in title from ”test engineer” to ”executive vice president”. eZGoals is de-veloped in JAVA utilizing JSP, servlets, and JAVA beans
Table 1. ScheduleA specifications.
System Platform Operating System Sun Solaris 9 Application Server Oracle 9iAS Programming Environment J2EE application
Database System Operating System Sun Solaris 9
DBMS Oracle 9i
JDBC Connections J2SEE 1.4 complaint, Oracle JDBC API sup-plied with JDeveloper 4.0
with a front-controller design pattern. An Oracle database stores the data and an oracle thin client drivers are used to communicate from JAVA beans. A connection pool is also implemented to speed up response time. eZGoals has the same specifications (Table 1) as ScheduleA; however, it has Tomcat 4.1 Application Server. Figure 2 shows the structure of eZGoals.
Figure 2. Structure of eZGoals.
All experiments were performed using a single client PC running Windows 2000 (service pack 4), with Pentium III processor, 966 MHz, 512 MB of RAM, and 20 GB H.D.D. The client hardware has 33 MHz PCI 32-bit buses and one 10/100 MB Ethernet adapter.
When we performed the experiments, we used different number of concurrent users: 5, 15, and 30. We simulated the concurrent users using a single client discribed above. After studying the production server log files, we found that the average number of concurrent users using ScheduleA application is 7 users ranging from 5 to 9 users. However, the average number of concurrent users using eZGoals is 10 users ranging from 5 to 15 users. In order to gradually increase the load on the server, we started testing with 5 users, which is the minumum number of concurrent users using both applications. Then, we tested using 15 users, which is the maximum number of concurrent users in both applications. In order to push or exceed upper functional limits for both applications, we doubled the amount of max-imum concurrent users, so we tested using 30 users. Since all of the users will not start using the application on the same time, we wanted the system to wait before adding a
new user after the test begins, thus we set the ramp-up pe-riod to 3 seconds. We performed the tests for one time, so we set the loop count to 0 iterations. We set the delay between consecutive requests to 100 ms. We took the mea-sures immediately after the tests were launched and stopped taking them after the tests finished, thus the warm-up time and cool-down time were set to 0 seconds. In order to use the maximum amount of bandwith available we discarded the bandwidth throttle. The average number of redirects per page is 10 ranging from 5 to 15 redirects. Hence, we set HTTP redirects to 15 redirects per page. Since the users of the application are intermediate users (not beginners nor experts), they know how to navigate through the system, hence most of them take less than one second to perform a key stroke or a mouse click, therefore we set the think time to 750 milliseconds. When we looked into the server log files, we found that the maximum duration for a user to ac-cess the applications was 2.5 minutes. In order to generate more loads on the application we doubled the test duration and set it to 300 seconds. Finally, cookies were enabled to allow caching and avoid network congestion.
In the next section we discuss each testing tool in details; we give an introduction about the tool, how to install it, and how to run it.
3.1.1. JMeter. JMeter [6] is a JAVA open source load-testing tool. It is used to performance test both static and dynamic web applications. Also, it can be used to perform FTP, JDBC, Servlets, Perl scripts performance tests. JMe-ter requires JDK1.4 or higher. It runs on Both Win32 and UNIX platforms. To install JMeter, one needs to download the zip file from JMeter website, and then extract the .zip file in a folder and run jmeter.bat under bin directory.
3.1.2. Web Application Stress Tool. Web Application Stress Tool (WAS) [5] is a free1 tool from Microsoft. It is used to simulate multiple browsers requesting pages from a web site. It can also be used to gather performance and stability information about a web application. It requires a WinNT platform with service pack 4.0 or higher. To in-stall WAS one needs to download and inin-stall .exe file from Microsoft website. Then follow installation instructions. It will be installed under windows program files.
3.1.3. OpenSTA. Open System Testing Architecture (OpenSTA) [8] is designed around CORBA; it was origi-nally developed to be commercial software by CYRANO. It has the capability of performing scripted HTTP and HTTPS heavy load tests with performance measurements from Win32 platforms. It requires Win NT 4.0 Service pack 5.0 or higher. To install the tool one needs to download the
1The source code of WAS is not provided by Microsoft, so one might
.msi file from their website. Then follow installation in-structions. It will be installed under windows program files.
3.1.4. TestMaker. TestMaker [7] is developed in JAVA. It is capable of testing: HTTP, HTTPS, SOAP, XML-RPC, and Mails (SMTP, POP3 and IMAP). It also can be used in building test agents. It requires JDK1.4 or later. To install the tool, one needs to download TestMaker zip file from their website. Then, unzip in a folder and run TestMaker.bat file.
3.2. Evaluation Approach
In order to get realistic testing scenarios, we used the in-tranet server log files to obtain sequence of derivation [24] between the user and the server, and a realistic flow path of user interactions with the application.
We recorded the test scenario for testing ScheduleA as the following: The user logged in using a ”Business Manager” role. Then, the user started a new challenge. The user checked the details of the challenge. Then, the user added a new account. Finally, the user updated the new account and logged out.
The test scenario for testing eZGoals was recorded as fol-lows: The user logged in using an employee role. The user created a profile to the employee. Then, the user created a new goal for that employee. A manager evaluated and re-viewed the goal. Then, the user checked all goals timeline. Finally, the user generated a report for all goals and logged out.
After recording test scenarios, we used the load genera-tor, which is built in the stress-testing tools, to mimic the browser’s behavior and replay the requests to the server us-ing multiple concurrent users.
Our study relied on evaluation metrics. These evaluation metrics determine the input variables used to plug to the testing tools. The input variables were used interchangeably to obtain different output deliverables. Most of the testing tools use similar input variables, however they are different in their output deliverables. Table 2 represents some eval-uation metrics for input variables with their description. In Table 3 we discuss some of the output deliverables provided by the stress tools.
4. Experimental Results
In this section, we compare the output deliverables of each tool for ScheduleA and eZGoals. We test the same application using four tools and compare the results. The goal of these experiments is to see whether different stress tools provide similar results if the input is the same. We use fixed input variables as discussed in section 3.1.
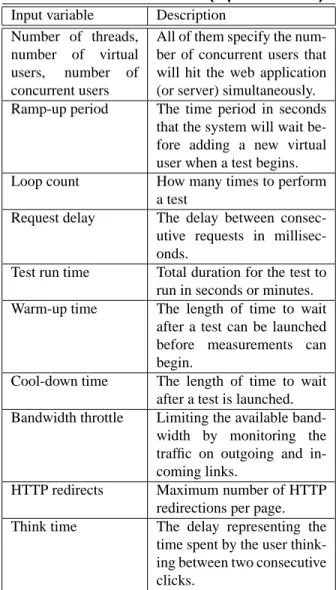
Table 2. Evaluation metrics (Input variables)
Input variable Description Number of threads,
number of virtual users, number of concurrent users
All of them specify the num-ber of concurrent users that will hit the web application (or server) simultaneously. Ramp-up period The time period in seconds
that the system will wait be-fore adding a new virtual user when a test begins. Loop count How many times to perform
a test
Request delay The delay between consec-utive requests in millisec-onds.
Test run time Total duration for the test to run in seconds or minutes. Warm-up time The length of time to wait
after a test can be launched before measurements can begin.
Cool-down time The length of time to wait after a test is launched. Bandwidth throttle Limiting the available
band-width by monitoring the traffic on outgoing and in-coming links.
HTTP redirects Maximum number of HTTP redirections per page. Think time The delay representing the
time spent by the user think-ing between two consecutive clicks.
4.1. ScheduleA Results
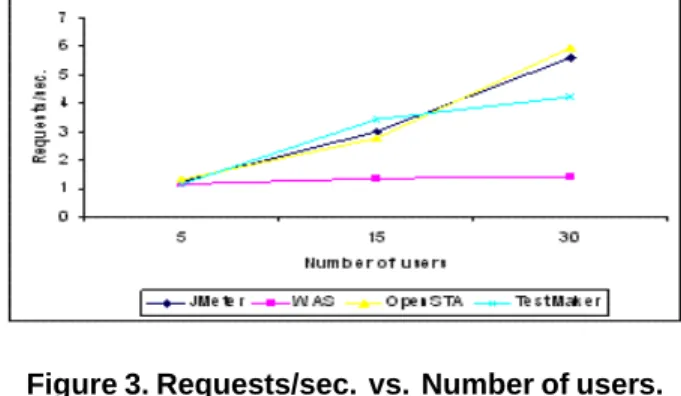
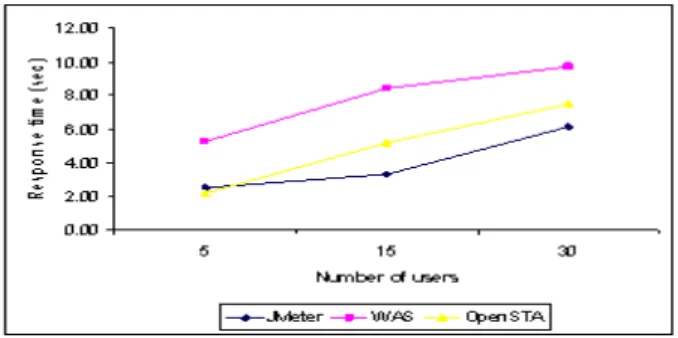
In Figure 3, we show that the request rate increases when the number of concurrent users increases. Due to the in-crease in number of users, the number of requests inin-creases correspondingly. According to the increase in number of requests, the server reply rate increases as shown in Fig-ure 4. When the number of requests increases, the number of server responses increases. Therefore, the reply rate in-creases. When the number of users increases, the server delay increases. The increase in number of users causes an increase in number of requests. Consequently, the response time increases as illustrated in Figure 5. If the test attempts to access a link that is broken or requests a page that re-turns an HTTP response other than 200 (OK), this is con-sidered an error. As shown in Figure 6 although the num-ber of users increases, the error rate remains almost
con-Table 3. Evaluation metrics (Output deliver-ables)
Output deliverable Description
Server throughput The actual number of re-quests per second the server can handle.
Requests count The number of requests the server responded to the client.
Response time Time between receiving a stimulus and delivering an appropriate response or re-action (in milliseconds). TTFB Average Time To First Byte:
Time in milliseconds for the client to get the first byte. TTLB Average Time to Last Byte:
Time in milliseconds for the client to get the last byte. Error rate Number of errors occurred
per second. The error can be anything other than HTTP 200 response.
stant. Some dynamic pages retrieve information from the server, so they take more time than pages, which display static contents. ”Customer information” is a servlet that re-trieves customer’s information from the Database. Figure 7 shows how the response time for dynamic pages increases when the number of users increases.
4.2. eZGoals Results
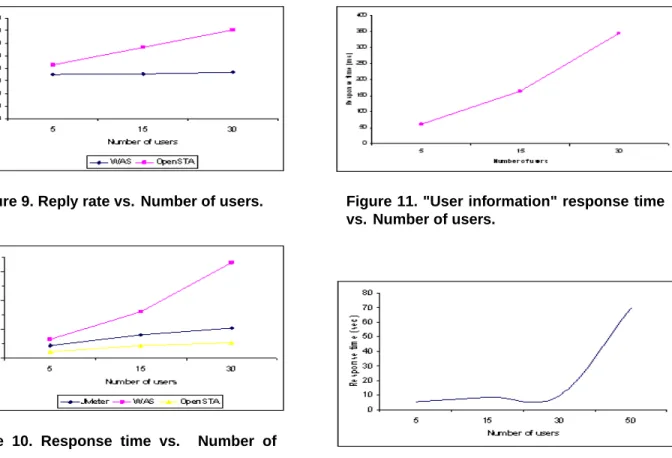
We get similar observations for testing the second ap-plication, however the figures are different. In Figure 8, we show that the request rate increases when the number of users increases. Consequently, the server reply rate will increase as shown in Figure 9.
The increase in number of requests causes more delay in the server. Therefore, the response time increases. This is shown in Figure 10. The error rate for the second applica-tion is 0%. All the pages respond with 200 HTTP responses and no links are broken. In Figure 11, we show how the re-sponse time for ”User information” page increases when the number of users increases. ”User information” is a servlet that retrieves user information from the Database.
Figure 3. Requests/sec. vs. Number of users.
Figure 4. Reply rate vs. Number of users.
5. Discussion
The previous experiments provide an initial exploration into the diversity of output deliverables provided by the stress tools. The results show that different outputs are ob-tained even though the test scenarios are the same and the input variables are fixed. The results in Figure 3, Figure 5, Figure 9 and Figure 10 show that although the input vari-ables are fixed (number of concurrent users, test duration, etc.), the response time and the reply rate are different. This is due to external factors affecting the network during the test duration, such as: available bandwidth, traffic in the network, number of users logged into the network, and oth-ers. All of these factors affect the test and result in differ-ent outcomes. These factors affect response time, reply rate (See Figure 3, Figure 6, and Figure 8), however they don’t have effect on error rate or request rate. Error rate and num-ber of requests are not affected with the network traffic. On the other hand, the error rate and number of requests can be affected by the way the tests are initiated. Some tools use different testing techniques than others. For instance, when simulating multiple users JMeter deals with each test as a block of instructions, however WAS and OpenSTA in-terleave the tests. This results in a different error rate and different request rate depending on the test duration.
Figure 5. Response time vs. Number of users.
Figure 6. Error rate vs. Number of users.
5.1. Avoiding DoS
In Figure 5 and Figure 10, the response time increases when the number of users increases. This is true till the server reaches the maximum capacity of users it can han-dle. The same thing happens for the server throughput. As the number of users increases, the number of requests per second increases till the server reaches the maximum ca-pacity of users it can handle.
ScheduleA is designed to support connection pooling. Con-nection pooling means that conCon-nections are reused rather than created each time a connection is requested. To facili-tate connection reuse, a memory cache of database connec-tions, called a connection pool, is maintained. Connection pooling is designed to provide improvement to performance by reusing connections. However, if it is not used correctly, it can kill the performance of the application or the server. We did an experiment with ScheduleA where we increased the number of concurrent users to 50. By this increase, we reached to the application break point and the server was down. We tested the application using the same conditions mentioned in section 3.1, except that the number of users was increased. After looking into the server logs and the ap-plication design, we found that connections were still alive even after the tests were terminated. Therefore, the
num-Figure 7. "Customer information" response time vs. Number of users.
Figure 8. Requests/sec. vs. Number of users.
ber of active connections increased exponentially as they are not dying, which in return denied new connections from being established due to memory limitations. Correspond-ingly, this caused DoS.
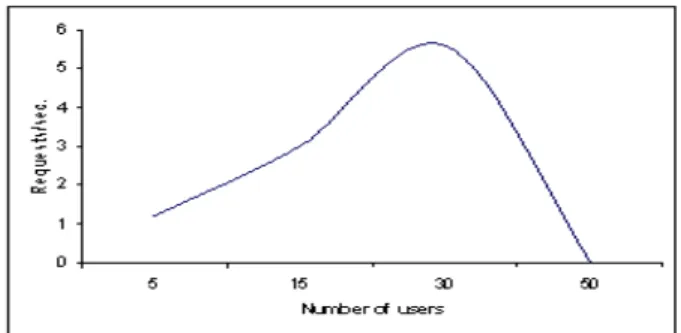
Figure 12 shows how the response time increases gradu-ally, when the number of users increases. When DoS hap-pens the response time starts increasing exponentially, till it reaches a point where the server does not respond. Simi-larly, the server throughput increases as the number of users increases. Figure 13 shows, how the throughput increases till the server reaches the maximum capacity. When this happens, the throughput decreases till it reaches 0. This is where the server is down and there is DoS. By studying both the server throughput and the response time, we could de-termine the application break point and see that there is a potential DoS if the number of concurrent users exceeds 30. The previous experiment showed that there are two inter-nal factors that can cause DoS to web-based applications: First, hardware infrastructure, such as: application-server’s memory, router’s speed that controls available bandwidth. If the hardware infrastructure is limited, the number of users that want to use a web application will be limited. Second, application infrastructure and the application design which
Figure 9. Reply rate vs. Number of users.
Figure 10. Response time vs. Number of users.
affects the number of users using the application. The pre-vious experiment showed how inappropriate use of connec-tion pooling caused DoS to the applicaconnec-tion.
6. Conclusion
The paper presented a study of web application stress-testing tools. The purpose of these tools was to measure the performance of web applications, see how they react when put under stress, and find their breaking point. We tested two web-based applications developed at Dallas Semicon-ductor. The applications used servlets and JSPs to commu-nicate with a database server. Our particular workload was derived from a realistic sequence of interactions between the user, the application, and the web server. We used the load generator that is built-in each of the testing tools to mimic the web browser’s behavior and replay the requests to the web server.
The results showed that performing similar test scenarios would provide different results depending on network state. External factors affecting the network during the test dura-tion, such as: available bandwidth, traffic in the network, number of users logged into the network, would affect the results of the tests. In addition, the structure of the tool,
Figure 11. "User information" response time vs. Number of users.
Figure 12. DoS effect on response time.
and the testing strategy the tool uses might affect the re-sults. For instance, JMeter simulates concurrent users as a whole block, i.e. user 1 will finish testing before user 2. However, WAS and OpenSTA interleave the tests, i.e. user 10 might be simulated before user 3. As a result, different error rates and different request rates might occur depend-ing on the test duration. Moreover, the results showed that there are two factors that affect the quality of web-based ap-plications: First, hardware infrastructure, such as: memory size on the server, routers’ speed, and available bandwidth. Limited hardware infrastructure degrades the performance of servers, which consequently degrades the performance of web applications. Second, application infrastructure or the design of the application, such as: using connection pool-ing. Similarly, this affects the quality of the application, consequently affecting the performance of the application and the server. In addition, the study showed that the tools share input variables such as: number of concurrent users and test duration. Also, they share output deliverables such as: response time, and server throughput. However, there is no tool, which provides all output deliverables that the tester expects. Hence, testers need to use a combination of stress-testing tools to achieve more extensive results. In addition, we found that using web application
stress-Figure 13. DoS effect on throughput.
testing tools can be used as an early alarm against DoS. In order for companies and businesses to avoid DoS, they need to stress-test their web applications before deploying them on the production server. Therefore, they will be able to determine the maximum number of concurrent users the server can handle, the maximum server throughput, the sponse delay, the maximum server utilization, and the re-sponse time during earlier stages of the design phase. These figures help in identifying the week points of the application or hardware limitations that might cause DoS and need im-provement.
The results motivate future work to develop new tools that provide more comprehensive deliverables to help testers in evaluating the quality of web-based applications. Future work will explore the need for new metrics to enhance the evaluation process, help companies and businesses avoid DoS, and protect their assets and services. Future work will focus on stress-testing as a tool to avoid DoS.
Acknowledgement
This work was completed on an internship at Dallas Semiconductor, Dallas, TX. We thank the team in the MIS department for this opportunity. Also, we would like to thank Stacey Elliott from SMU for his help and comments.
References
[1] Dallas Semiconductor - Maxim.
http://www.maxim-ic.com/.
[2] Web-Stone: The Benchmark for Web Servers. Mindcraft Inc., 1995. http://www.mindcraft.com/webstone/.
[3] Specweb96. The Standard Performance Evaluation Corpo-ration, 1996. http://www.spec.org/osg/web96.
[4] Specweb99. The Standard Performance Evaluation Corpo-ration, 1999. http://www.spec.org/osg/web99.
[5] Microsoft Web Application Stress Tool
1.0. Microsoft Corporation, December 2002.
http://www.microsoft.com/downloads/details.aspx?
FamilyID=e2c0585a-062a-439e-a67d-75a89aa36495&displaylang=en.
[6] Apache JMeter 2.0.3. The Apache Jakarta Project, March 2005. http://jakarta.apache.org/jmeter/.
[7] TestMaker 4.3.1. Push to Test, March 2005.
http://www.pushtotest.com/.
[8] OpenSTA 1.4.3. Open System Testing Architecture, May 2005. http://opensta.sourceforge.net/.
[9] G. Banga and P. Druschel. Measuring the capacity of a web server. In Proceedings of the USENIX Symposium on Inter-net Technologies and Systems, 1997.
[10] P. Barford and M. Crovella. Generating representative web workloads for network and server performance evaluation. In Proceedings of the ACM Sigmetrics Conference on Mea-surement and Modeling of Computer Systems, June 1998. [11] B. Beizer. Software Testing Techniques. Van Nostrand
Rein-hold, New York, second edition, 1990.
[12] D. Kung, C. H. Liu, and P. Hsia. An object-oriented web test model for testing web applications. In Proceedings of the IEEE 24th Annual International Computer Software and Application Conference, October 2000.
[13] D. A. Menasc. Load testing of web sites. IEEE Internet Computing, 6(4):70–74, July/August 2002.
[14] D. Mosberger and T. Jin. httperf - a tool for measuring web server performance. In Proceedings of the Workshop on In-ternet Server Performance, 1998.
[15] E. Nahum. Deconstructing specweb99. In Proceedings of the 7th International Workshop on Web Content Caching and Distribution, August 2002.
[16] E. M. Nahum, M. Rosu, S. Seshan, and J. Almeida. The ef-fects of wide-area conditions on www server performance. In SIGMETRICS ’01: Proceedings of the 2001 ACM SIG-METRICS international conference on Measurement and modeling of computer systems, pages 257–267, 2001. [17] H. Q. Nguyen. Testing Applications on the Web: Test
Plan-ning for Internet-Based Systems. John Wiley and Sons Inc, 2001.
[18] H. Q. Nguyen. Web application testing beyond tactics. In Proceedings of the 6th International Workshop on Web Site Evolution (WSE 2004), page 83, 2004.
[19] F. Ricca and P. Tonella. Analysis and testing of web appli-cations. In ICSE ’01: Proceedings of the 23rd International Conference on Software Engineering, pages 25–34, 2001. [20] M. Sagoo, M. A. M. Capretz, and J. Samarabandu. Pawa: A
program analysis tool for web based intranet applications. In Proceedings of the 6th International Workshop on Web Site Evolution (WSE 2004), pages 63–70, 2004.
[21] J. Shaw. Web application performance testing: A case study of an on-line learning application. BT Techonology Journal, 18(2):79–86, April 2000.
[22] H. M. Sneed. Testing a web application. In Proceedings of the 6th International Workshop on Web Site Evolution (WSE 2004), pages 3–10, 2004.
[23] M. Williams. eBay, Amazon, Buy.com hit by
at-tacks. Network World Fusion, February 2000.
http://www.nwfusion.com/news/2000/0209attack.html. [24] Y. Wu and J. Offutt. Modeling and testing web-based
appli-cations. Technical Report ISE-TR-02-08, GMU, November 2002.