University of Twente
School of Management and Governance
Master thesis Business Administration
Topic :
Implementation of an activity-based
costing method at MAIN B.V.
Submitted by:
Wilco Meijerink
s1231316
First supervisor:
Ir. H. Kroon
Second supervisor: Dr. P.C. Schuur
MAIN supervisor: E. van Nieuwenhuizen
Enviem supervisor: Drs. J. Koetje
Contact e-mail:
[email protected]
Contents
Management summary ... III Index of figures ... IV
1. Situation description & research outline ... 1
1.1 Situation ... 1
1.2 Goal of this research ... 1
1.3 Research question ... 1
1.4 Theory & Relevance ... 2
1.5 Research Outline ... 2
2. MAIN: the company ... 3
2.1 Structure of the company ... 3
2.1.1 MAIN’s divisions ... 3
2.1.2 Supportive divisions ... 3
2.2 MAIN’s activities ... 4
2.2.1. Cleaning ... 4
2.2.2. Logistics ... 5
2.2.3. Terminal ... 5
2.3 Company’s place in the holding ... 6
3. Methodology: Direct costs, indirect costs and the ABC-analysis ... 7
3.1 Direct costs ... 7
3.2 Indirect costs ... 7
3.3 Traditional costing method ... 7
3.4 What is an ABC-analysis? ... 8
3.5 Advantages and disadvantages of an ABC-analysis ... 9
3.6 How should an ABC-analysis be implemented?... 10
3.7 Substitutes of ABC-analysis ... 11
4. Research Method ... 12
4.1 Kind of research ... 12
4.2 Data collection & analysis ... 12
4.3 Choices made in order to implement ABC-analysis. ... 13
4.3.1 Identifying the types of costs according to their allocation: direct costs, traceable costs and non-traceable costs. ... 14
4.3.2 Determining the costs of certain activities and procedures related to non-traceable costs. ... 14
4.3.4 Cost assignment of secondary activities to primary activities based on output measures
of secondary activities. ... 16
4.3.5 Compiling a list of activities for each cost object... 17
4.3.6 Determining activity costs of cost objects. ... 18
4.3.7 Direct costs and non-traceable costs are added to activity costs to determine the total costs of cost objects ... 18
5. Results ... 19
5.1 Costs per activity, division and revenue per division ... 19
5.2 The effect on cost prices when cost structure changes... 20
5.2.1 The effect on cost prices when allocation of indirect costs does not represent reality .. 20
5.2.2 The effect of increased direct costs on cost prices ... 22
6. Conclusion ... 26
7. Discussion ... 27
8. Bibliography ... 28
Management summary
In order to get insights in their cost structure, MAIN B.V.1, a subsidiary of Enviem, wanted
to have an activity-based costing model implemented in their organisation. After
research-ing what MAIN’s activities are, to which cost pool these activities relate, which cost
should be allocated to which type of activity, the output measures et cetera, it appeared that
cost prices that are handled for the division Terminal were higher than the sales prices.
This caused that MAIN is making losses. In order to improve the results, Enviem already
made changes in MAIN’s management team. A more experienced manager was hired as
CEO, who is focussing on improving processes in the company. As a result of hiring this
new CEO, there are already some changes visible. New IT-systems were set up. Also a
new financial program, which is already used by the holding, is being integrated within
MAIN. Hereby, the holding can better monitor how MAIN is performing. Also, there has
become more focus on personal development of employees and managers. Also processes
are analysed in order to reduce abundant costs. The developed activity-based costing tool
helps MAIN to monitor their costs closely. The tool will be used to compare cost prices
over time, so MAIN could react when major changes in cost prices appear.
As already stated, the outcomes of this research showed that the activity costs of the
divi-sion Terminal were higher than the sales prices. A plausible explanation for this could be
the decreasing price of oil worldwide and MAIN’s inability to react towards it.
Another outcome of this research is that, due to the nature of products and services MAIN
offers, a simplified activity-based costing model is developed. The theory of activity-based
costing does not consider the diversity that could occur while executing a particular task.
Therefore, a proportional-by-volume method was used in order to allocate overhead costs.
Furthermore, MAIN should closely monitor their direct costs, especially when demand for
MAIN services/products remains on the same level. This research shows that increases in
direct costs have major influences of MAIN’s cost prices when the demand for MAIN’s
products/services stay more or less constant.
Index of figures
Figure 1. MAIN’s primary divisions (Nieuwenhuizen van, 2015).
[image:5.595.122.552.354.664.2]Figure 3. The way cleaning activities are executed (Nieuwenhuizen van, 2015).
Process responsible: Cleaner
Goal: Cleaning of tanks
Frequency: Daily base
INPUT PROCES OUTPUT PROCEDURE BY PROCESS
Executing cleaning activities MAIN-BV
Workorder from planning
Control of workorder and work environment
Equivalent
Contacting planning No
Estimate risks
Job-risk analysis
Execute activities Taking precautions
Able to work? LMRA
card
Controlling activities
Customer agrees
Signed order Disposing
waste material
A check is provided by a frontman and, if necessary, a gas doctor or
cargo controller.
Transfer to planning
No Contacting planning
Planning Cleaning
Last minute risk analysis
Certificate gas doctor/
Figure 4. The way logistic activities are executed (Nieuwenhuizen van, 2015).
PRO 3.1.2 Collecting waste materials
Process responsible: Skippers and truck drivers
Goal: Collecting of waste from customers and depots. Transportation of the waste to the terminal in Amsterdam. The unloading of the waste material into the installation.
Frequency: On a daily base.
INPUT PROCES OUTPUT PROCEDURE FOR EACH PROCESS
STAP MAIN-BV Workorder Receivement of workorder and collecting waste materials Ship/Truck almost full? Contacting business office YES Controlling waste administrative processing Wrong S-form
Skipper/driver checks whether the offered load corresponds with the loading order. When the load not corresponds, the business office has to be contacted immediately.
Skippers and drivers receive a workorder from business office. Based on the workorders, skippers/drivers will go to customers and collect the waste materials.
Contacting business
office BGB
After acceptance of the load,
administrative processes are handled with the customer. Information about the load is passed on to the business office.
In consultation with the business office there will be determined whether ships/ trucks can unload the cargo.
Unloading cargo in consultation with the operator 1 7 6 6 5 5 3 4 4 3 2 2 1 NO Loading waste and taking sample
When the load is accepted, the load is getting loaded by skipper/driver. During the loading process, some samples are taken. Workor der S-form BGB Tranmitting information about cargo to business office Sample analysis
Then the skipper / driver receives the loading forms and lets take a sample of his cargo by the laboratory. Which is then analyzed by the laboratory. On the loading form the results are filled in.
Next, the loading / unloading paper is transferred to the operator and AD (N) (R) Checklist has to be filled in. The cargo could be unloaded in consultation with the operator.
Load/ Unload form AD(N)(R) Checklist Recycling process Load/ Unload form 7 Arrival ship/truck
In consultation with an operator, a skipper/driver determines to which depot the cargo goes.
Laboratory
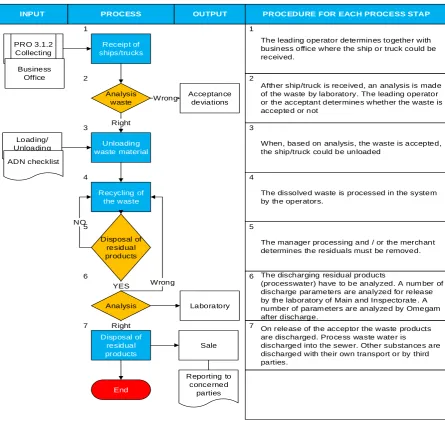
Figure 5. Description of recycling process (Nieuwenhuizen van, 2015).
Process Responsible: Manager Terminal
Go al: Receiving of waste material. Acceptance/rejection of the waste. Recycling of waste. Disposal of waste material.
Frequen cy: Activities are executed on daily base .
INPUT PROCESS OUTPUT PROCEDURE FOR EACH PROCESS STAP PRO 3.1.3 Recycling of waste material in the installation MAIN-BV
Receipt of ships/trucks Unloading waste material Recycling of the waste PRO 3.1.2 Collecting Analysis waste Right Disposal of residual products YES NO Wrong Loading/ Unloading Business Office
The leading operator determines together with business office where the ship or truck could be received.
Afther ship/truck is received, an analysis is made of the waste by laboratory. The leading operator or the acceptant determines whether the waste is accepted or not
Acceptance deviations
When, based on analysis, the waste is accepted, the ship/truck could be unloaded
The dissolved waste is processed in the system by the operators.
Analysis Right Disposal of residual products End Wrong
The manager processing and / or the merchant determines the residuals must be removed.
The discharging residual products
(processwater) have to be analyzed. A num ber of discharge parameters are analyzed for release by the laboratory of Main and Inspectorate . A number of param eters are analyzed by Omegam after discharge.
On release of the acceptor the waste products are discharged. Process waste water is
Figure 6. MAIN’s place in the Enviem Holding (Enviem, 2015)
Figure 7. Academic problem solving (Visscher de, 2015).
Figure 8. Output from accounting programmes used by MAIN.
KostenplaatsKostenplaatsnaam ParagraafParagraafnaam GrootboekGrootboeknaam Bedrag DebetBedrag Debet CumulatiefBedrag CreditBedrag Credit Cumulatief
1001 LINDE - heftruck linde 440 KOSTEN VERVOERMIDDELEN44000 Onderhoud en Reparatie (V) 3.139 7.490
1001 LINDE - heftruck linde Resultaat boekjaar 2015 3.139 7.490
1002 K16GKL4 - Citroen 16-GKL-4440 KOSTEN VERVOERMIDDELEN44000 Onderhoud en Reparatie (V) 0 6
1002 K16GKL4 - Citroen 16-GKL-4440 KOSTEN VERVOERMIDDELEN44050 Gas, water en elektra (V) 0 1.127
1002 K16GKL4 - Citroen 16-GKL-4440 KOSTEN VERVOERMIDDELEN44800 Parkeer-, tol- en veergelden 0 72
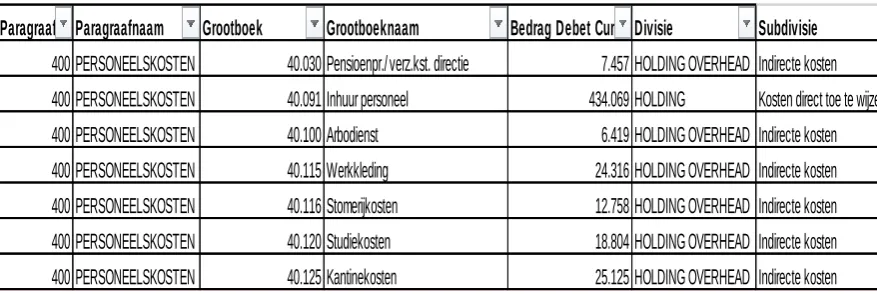
Figure 9. Output combined into generalizable ledger numbers.
Paragraaf Paragraafnaam Grootboek Grootboeknaam Bedrag Debet CumulatiefDivisie Subdivisie
400 PERSONEELSKOSTEN 40.030 Pensioenpr./verz.kst. directie 7.457 HOLDING OVERHEAD Indirecte kosten
400 PERSONEELSKOSTEN 40.091 Inhuur personeel 434.069 HOLDING Kosten direct toe te wijzen aan divisie 400 PERSONEELSKOSTEN 40.100 Arbodienst 6.419 HOLDING OVERHEAD Indirecte kosten
1. Situation description & research outline
In this chapter, the goal of this research, the research question and relevance of this
re-search, academic as well as practical, will be discussed.
1.1 Situation
In the current situation, MAIN handles a traditional cost system. A traditional cost system
allocates indirect costs of departments to products or services (Rchid, Bouksour, &
Beidouri, 2013). These indirect costs or overhead costs are allocated using a single
alloca-tion driver, which is based on a predetermined allocaalloca-tion rate (Özkan & Karaibrahimoğlu,
2013). According to Kujacic et al., shortcomings of this cost system would be overcome by
the activity-based costing method (Kujacic, Blagojevic, Sarac, & Vesovic, 2015).
Activity-based costing analysis assigns resources to activities, using a different cost driver for each
activity (Özkan & Karaibrahimoğlu, 2013). ABC-analysis also contributes to reducing
ar-bitrariness into the division of indirect costs (Stefano, Werustky, Selig, & Filho, 2013). So
in order to calculate a more accurate cost price, more allocation drivers should be taken
into consideration. In order to get a more accurate overview of their costs per activity,
MAIN wants to implement an activity-based costing analysis (ABC-analysis). With a more
accurate cost price per activity, MAIN will be able to respond better to the markets they
are involved in. Also, MAIN will be able to compare their costs more accurately with
com-petitors and react to it. Furthermore, there will be looked how a change in direct cost
struc-ture affects the costs per activity. In that way, MAIN will know what their costs per
activ-ity approximately will be when there is an in- or decrease in direct costs of a division, due
to an in- or decrease in service demand.
1.2 Goal of this research
The goals of this research are:
To implement an activity-based costing analysis (ABC-analysis) at MAIN.
Analyse what happens with the cost per activity when the direct cost structure changes.
To research whether activity-based costing method is still an applicable method
these days.
1.3 Research question
MAIN already determined that an ABC-analysis had to be implemented in order to create a
be implemented. Therefore, in order to execute this research, the following research
ques-tion was raised:
How should MAIN allocate their costs to their activities?
In order to answer this question, several sub-questions were deposit (based on Kaličanin
and Knežević activity-based costing implementing scheme):
1. What are MAIN’s activities ?
2. What are MAIN’s cost objects?
3. Which activities are required for each cost object to occur?
4. Which cost drivers will be used for allocating indirect costs?
5. How should the output be measured?
6. What are the costs per activity?
7. What happens to the cost price per activity when overhead cost structure change?
1.4 Theory & Relevance
In this case, the solely theory that is used is the theory of the ABC-analysis. Substitutable
theories are explained. Because MAIN wants to have an ABC-analysis executed and
im-plemented for future use. Hereby, MAIN generates a more accurate cost overview per
ac-tivity, which it can use in order to respond to market changes, customer desires, holding
desires et cetera. Also, this information could be used to create a benchmark, which is not
available for the current market. Number of researchers argued that ABC could lead to
more accurate costing information (Elhamma & Fei, 2013). This research could strengthen
or weaken this argumentation, by showing that the analysis leads (not) to more accurate
costing information. Also it could provide evidence in order to test whether the theory is
still applicable. According to Kaplan and Anderson, many companies faced difficulties or
could not implement activity-based costing at all (Kaplan & Anderson, 2004). For this
rea-sons, the research is also academically relevant.
1.5 Research Outline
In this research, an ABC-analysis will be implemented at MAIN. In order to successfully
implement this analysis, first the activities that are executed by MAIN and MAIN’s
posi-tion in the holding are accurately mapped in chapter two. Chapter three explains what an
ABC-analysis is, what its advantages and disadvantages are and how it should be
imple-mented. In chapter four, the methodology used in this paper will be explained. Chapter five
tool, which can be used in the future. Chapter 5.2 gives an overview of what happens when
the overhead cost structure changes. Chapter six will give the conclusion and the remaining
parts will elaborate on discussion, limitations and appendices.
2. MAIN: the company
In this chapter there will be elaborated on activities performed by MAIN. Also MAIN’s
structure will be explained, even as and its place in the holding. This elaboration creates a
good understanding of what kind of company MAIN actually is.
2.1 Structure of the company
In this chapter there will be elaborated on how MAIN has been built up.
2.1.1 MAIN’s divisions
When taking the products and services MAIN offers into consideration, it appears that
MAIN divides their products and services into three divisions, as shown in figure 1:
Clean-ing, Logistics and Terminals.
In 2013, MAIN bought and integrated a competitor into the company; Stroom & Visser, a
company that mainly focused on cleaning of tanks and collecting maritime waste. While
Stroom & Visser’s cleaning activities where allocated into MAIN’s cleaning division, the
collecting of maritime waste was allocated to MAIN’s logistic department. So, Stroom &
Visser was fully integrated into MAIN.
The cleaning department mainly focuses on the cleaning of tanks of ships and trucks, while
logistics takes care of collecting, saving and transporting waste from ships, trucks and gas
stations like used oil, bilge water, sanitary waste water, engine room sludge and small
dan-gerous waste like coolant, oil filters, polishing cloth, fats, paint waste, batteries et cetera
from different platforms. There are two ways of collecting: by ship or by truck. There are
also two ways of transporting: by ship or by truck. Some of the ships MAIN possesses
serve as a storage facility; some of the ships MAIN possesses are used as a way of
trans-porting the waste to MAIN’s terminal, where the recycling process takes place. The
termi-nal is responsible for the atermi-nalysing and recycling of the collected waste. All of the
divi-sions are supported by secondary dividivi-sions, who’s role will be further elaborated on in the
next paragraph.
2.1.2 Supportive divisions
MAIN’s head activities are supported by a lot of secondary activities in order to keep the
figure 2. The divisions that produce and delivers MAIN’s products and services are placed
on the left side of figure 2. The supporting divisions that are needed to keep the company
going are placed on the right side of figure 2.The environmental division director has to
make sure that all of these divisions function well and that MAIN creates value for the
En-viem group. The environmental division director reports to and is accountable to the CEO
and CFO of Enviem. The secondary divisions are specifically bounded to one of the
pri-mary divisions. All of the secondary divisions support and contribute to the three pripri-mary
divisions. The Enviem projects department supports MAIN by implementing improvement
programs.
The KAM division is responsible for quality and regulation management. It is KAM
divi-sion’s responsibility that all of the processes meet regulations and internal standards. The
finance division is responsible for all of the financial processes within MAIN, such as
drafting and paying of invoices, bookkeeping et cetera. The sales division is responsible
for the sales made, attracting new customers and satisfying current customers. The
tech-nical services division takes care of all the maintenance that has to be executed. The HR
division takes care of personnel issues, like recruiting new personnel, administration of pay
roles, managing employees performance et cetera.
2.2 MAIN’s activities
In order to create a good understanding of the company, first there will be looked at the
prime activities MAIN execute. MAIN categorize their activities into three divisions :
Cleaning, Logistics and Terminal. The divisions consist of prime activities, which, on their
turn, consist of secondary activities, where has been elaborated on in previous paragraph.
2.2.1. Cleaning
As already suggested by its name, the cleaning division takes care of cleaning; the cleaning
of ships and tanks. This is the cleaning’s division main activity. The cleaning division
takes care of the cleaning of all of the tanks that are available on a ship, such as bilge
tanks, sewage tanks, heavy fuel oil (HFO) tanks, diesel tanks, marine diesel oil (MDO)
tanks, settling tanks, void space and bunker tanks. Also on shore tanks and engine rooms
could be cleaned by MAIN. In order to start the cleaning activities, the customer first has
to contact MAIN. Hereafter, an employee of MAIN controls the work order and working
place. When the work order fits the working place, a risk analysis has to be made by the
employee. After the analysis, the employee has to take precautions concerning the
could start. However, when the working place is not save enough the employee should
contact planning personnel. When the cleaning activities are fulfilled, the cleaned area
should be checked by the employee and sometimes also by a gas specialist. After the
check, the customer should sign the work order, which is eventually processed by planning
personnel. This is graphically shown in figure 3.
2.2.2. Logistics
Logistics takes care of collecting and transporting of used oil, bilge water, sanitary waste
water, engine room sludge, and small dangerous waste, like coolant, oil filters, polishing
cloth, fats, paint waste, batteries et cetera from different platforms. The collected material
is collected in two ways: by ship or by truck. Waste material from ships could be pumped
into ships of MAIN, who are in the same harbour. Hereafter, a ship could go to the
termi-nal in Amsterdam and deliver the waste materials. It is also a possibility that a MAIN ship
only collect the waste of third parties in order to secure a high service level. In that case, a
MAIN ship could collect waste of multiple other ships, pump it into another MAIN ship,
which transports the waste material to the terminal in Amsterdam. So there are two ways
ship waste is collected by ships of MAIN. The trucks also collect in two ways: trucks
could collect ship waste and used oil from a customer and transport it to the terminal. It is
also possible that trucks pump collected waste material into ships of MAIN, which will
transport it eventually to the terminal in Amsterdam. Furthermore, the ships and trucks
could be subdivided regarding to flash point. Some of the ships and trucks are available to
collect maritime waste with a high flash point, such as sludge, bilge, diesels and sewage;
other ships and trucks are available to collect maritime waste with a low flash point, such
as benzenes, naphtha’s and wash water. This is graphical shown in figure 4. The main
ac-tivity of logistics department is transporting, by ship or by truck.
2.2.3. Terminal
The terminal (recycling) division takes care of the recycling of used oil, oil-water mixtures
and bilge and sludge, which are the MAIN activities of the terminal division. All of the
re-maining waste material that is collected is stored at the terminal or depots. MAIN however
does not recycle it. The remaining waste is transported to companies who are able to
recy-cle the waste materials. In order to recyrecy-cle the oil, first a sample of the oil has to be
ana-lysed at the laboratory. After this analysis the recycling process could start. When the
pumped into the installation. After a high technological process, the output of the
installa-tion are the products MAIN wants to sell; used oil, oil-water mixtures and fuel remnants as
bilge and sludge. The recycling manager determines whether the products have to follow
the technological process again or if these could be analysed. The products have to follow
the technological process until they are able to be analysed. When it appears that the
ana-lysed products do not meet the required standards, they also have to follow the process
again. This circle repeats until the products meet the required standards. When the required
standards are met, the products could be drained and sold. This is graphically viewed in
figure five.
2.3 Company’s place in the holding
When taking the holding into consideration, it appears that the holding handles four
divi-sions: Enviem Environmental Services Holding B.V., Enviem Wholesale Holding B.V.,
Enviem Retail Holding and Enviem lubricants. MAIN belongs to the Enviem
Environmen-tal Services Holding B.V., see figure 6. These divisions are all together responsible for a
net turnover of € 1.700,41 million per 31-12-2014 whereby Enviem Environmental
Ser-vices Holding B.V. contributes to this number with € 18,7 million. The holding had a short
term debt of € 40,34 million, a long term debt of € 47,38 million and had to pay € 1,57
million on interest. The environmental division was responsible for 92 out of 697 jobs in
3. Methodology: Direct costs, indirect costs and the ABC-analysis
In this chapter, the differences between direct and indirect costs will be discussed. Also,
the ABC-analysis, its advantages and disadvantages and its implementation process will be
elaborated on.
3.1 Direct costs
Costs could be divided into two broad categories: direct and indirect costs (Drury, 2012).
Direct costs are costs that could directly be assigned to a product or service, like raw
mate-rials that are used for fabricating a product. Direct costs also could be divided into two
cat-egories: direct labour costs and direct material costs. Direct labour costs are labour costs
that could directly be assigned to a product or service. For example, the costs of a truck
driver who is collecting oil. Direct material costs are the material costs that could directly
be linked to a product or service. For example, a truck that is needed for collecting oil.
3.2 Indirect costs
Indirect costs are the costs that could not be directly be assigned to a product or service.
These costs are often referred to as overhead costs. These overhead costs could be divided
into three broad categories: indirect labour, indirect materials and indirect expenses (Drury,
2012). Indirect labour costs could not be directly assigned to a product or service.
Exam-ples of indirect labour costs are the labour costs of personnel working on financial, human
resources and maintenance departments. Indirect material costs are for example the costs
of material used for maintenance, materials used at offices et cetera. Indirect expenses
in-clude for example lighting and heating expenses as well property taxes (Drury, 2012). In
MAIN’s case, direct costs are 5,2 times as high as indirect costs.
3.3 Traditional costing method
The traditional costing method imputes costs that could not directly be linked to a specific
product are equally divided between all fabricated products, the amount of production
hours or the selling value of the produced goods. It is a relative easy and cheap way of
culating a cost price (Van der Velde, 2011). However, it is not an accurate method of
cal-culating a cost price, because only one output measure and one cost driver are used. The
following sub-chapters will discuss the ABC-analysis, another way of calculating the cost
price of a product or service, what the advantages and disadvantages of this method are
3.4 What is an ABC-analysis?
An ABC-analysis provides information on the cost of processes, products, activities and
other costs. Its goal is to create a framework for overcoming the trouble encountered in
tra-ditional cost accounting (Rchid, Bouksour, & Beidouri, 2013).
According to Berry and Jarvis, “activity-based costing recognizes the complexity of
busi-ness activities, the nature of the overheads and what drives or causes them (Berry &
Jarvis, 2011).” The most important assumptions that underpin activity-based costing are:
Costs are caused by activities, activities like ordering of raw materials, processing
of materials, use of machines and assembly; also overhead costs like a finance or
human resource department are caused by activities.
Making products stimulates the demand for activities.
Costs are allocated to products based on products consumption of the activities
(Berry & Jarvis, 2011).
This analysis tool could create value by giving a clearer insight into a company’s cost
structure. According to Kaličanin & Knežević, “ABC-analysis creates better
understanding of all of the processes of doing business and provides relevant information
on:
Costs of object in order to set selling prices, assortment choice, marketing
channels, etc.
Duration and costs of particular activities in the value chain, to manage activities
with the intention of reducing or eliminating costs of particular activities, reducing
or eliminating non-value added activities, and increasing the efficiency of
value-added activities to the customer” (Kaličanin & Knežević, 2013).
So, this better understanding of all processes allows management to adjust current
activi-ties and to benchmark it with other companies. Therefore, the ABC-analysis is a useful tool
for better insights of costs per activity, benchmarking and adjusting or changing the
strat-egy of a company (Kaličanin & Knežević, 2013). While the ABC-analysis mainly focuses
on the costs of each activity, it is also a tool that could be used for managing a company.
The main principles of the ABC-analysis, according to Kaličanin & Knežević, are the
Calculating a more accurate cost price of activities than traditional costing method,
because indirect costs are allocated better.
Creating a better understanding of the business processes.
It becomes easier to monitor the processes because of the better understanding of
processes.
Focus lays on process and activity output, so it provides management with relevant
information.
An ABC-analysis provides data on efficiency and effectiveness of business
pro-cesses, which could result in eliminating non-value-added processes.
Because of the better understanding of the cost structure, a better prediction of
fu-ture costs could be made(Kaličanin & Knežević, 2013).
The ABC-analysis is a tool which provides information to multiple levels of the company.
This tool provides management with data of the cost of different activities. So it provides
data on operational level. The tool provides information for management whether
manage-ment should strive for a low-cost competitive advantage. So the tool also provides
infor-mation for the strategic level of a company. All this together makes the ABC-analysis a
powerful tool that could improve a company’s competitive advantages.
3.5 Advantages and disadvantages of an ABC-analysis
When a company introduces any kind of new method, analysis, system or tool, there
should be some kind of benefit in it for the company; why would a company change
some-thing when they are not benefitting from it? Besides the previous mentioned advantages,
there are also some disadvantages towards the implementation of an ABC-analysis. In
ta-ble one, there is given an overview of the most important advantages and disadvantages of
this method (Onat, Anitsal, & Anitsal, 2014; Kaličanin & Knežević, 2013; Özkan &
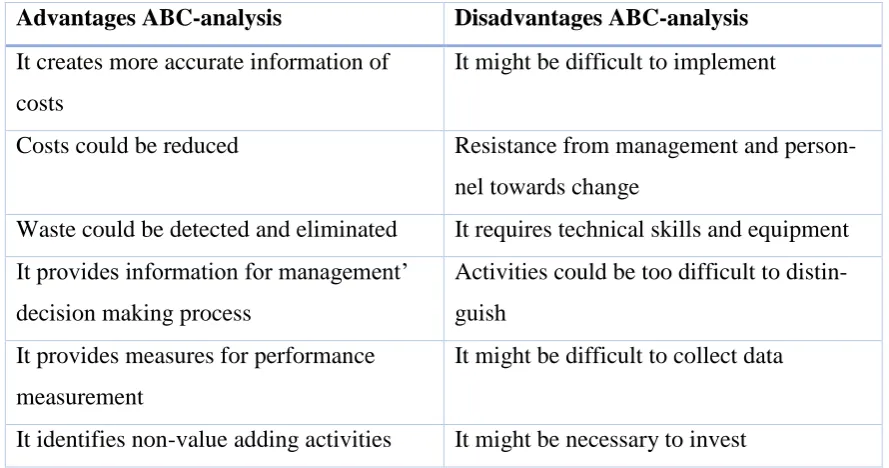
Table 1. Advantages and disadvantages of ABC-analysis
Advantages ABC-analysis Disadvantages ABC-analysis
It creates more accurate information of
costs
It might be difficult to implement
Costs could be reduced Resistance from management and
person-nel towards change
Waste could be detected and eliminated It requires technical skills and equipment
It provides information for management’
decision making process
Activities could be too difficult to
distin-guish
It provides measures for performance
measurement
It might be difficult to collect data
It identifies non-value adding activities It might be necessary to invest
3.6 How should an ABC-analysis be implemented?
Because of MAIN’s relative high direct costs, an ABC-analysis becomes more attractive to
implement. According to Rchid et al., in order to implement an ABC-analysis, the
follow-ing steps have to be taken:
1. The cost objects have to be defined.
2. The activities that contribute to the achievement of the cost object should be
de-fined.
3. The cost drivers responsible for each process that measure resources usage should
be defined.
4. At last, the relationship between cost object, activities and resources must be
de-fined (Rchid, Bouksour, & Beidouri, 2013).
According to Berry and Jarvis, there are four steps for calculating product costs when
using an ABC-analysis. These four steps are suit with the four steps Drury recommend
(Drury, 2012) and are as follows:
1. “Identify major activities.
2. Collect overhead costs in a cost pool for each major activity.
3. Determine the cost driver for each activity.
4. Trace the cost of the activities to the products, using the cost drivers as a masure of
Kaličanin and Knežević also developed a scheme for implementing an ABC-analysis. This
to-do list is largely similar with the standards of Rchid et al, although it is a bit more
sophisticated. It contains 7 steps:
1. Identifying the types of costs according to their allocation: direct costs, traceable
costs, and non-traceable costs.
2. Determining the costs of certain activities and procedures related to non-traceable
costs (they are assigned to activities on the basis of assessment or they are dealt
with as expenses for an accounting period).
3. Identifying cost drivers and output measures of given activities (both primary
activ-ities and secondary activactiv-ities).
4. Cost assignment of secondary activities to primary activities based on output
measures of secondary activities.
5. Compiling a list of activities for each cost object.
6. Determining activity costs of cost objects.
7. Direct costs and non-traceable costs (if there is a possibility of assessment) are
added to activity costs to determine the total costs of cost objects (Kaličanin &
Knežević, 2013).
This research will use the implementation scheme of Kaličanin and Knežević as a guidance
because it is a sophisticated way for implementing an ABC-analysis and it covers all the
parts of Rchid et al. implementing scheme and Berry and Jarvis’ steps for implementing an
ABC-analysis.
3.7 Substitutes of ABC-analysis
The implementation of activity-based costing also causes difficulties. It takes time and
money to implement an activity-based costing analysis. This is a major barrier for
compa-nies in order to implement an ABC-analysis (Kaplan & Anderson, 2004). Another barrier
that could rise is that operations are too complex to implement an ABC-analysis properly.
The ABC-analysis also use proportionality and separability assumptions which do not fit
with reality (Homburg, 2005). Therefore, Homburg suggests data envelopment analysis as
an alternative for ABC-analysis. The main advantage of data envelopment analysis over an
ABC-analysis is that it does not determine the cost driver rates ex ante, reducing
infor-mation cost. Kaplan and Anderson suggest a time-driven activity-based costing model,
substitutes of an ABC-analysis. These will not be further elaborated on because it is not
relevant for this research.
4. Research Method
In this chapter, the kind of research and its methodology will be discussed. Furthermore,
the choices that have to be made according through the ABC implementing scheme, which
is elaborated on in the previous chapter, will be explained.
4.1 Kind of research
This research is a design research. A design research tries to solve a business problem in an
academic way, following steps which are represented in figure seven (Visscher de, 2015).
In this case, the company, wants to implement an activity-based costing analysis in order to
create a more accurate cost overview. So MAIN’s current problem is that the costs aren’t
allocated in a proper way, which leads to wrong cost prices for the services and products
MAIN delivers. Academic literature was used in order to explain the principles of
activity-based costing and to explain how implementation of this method works in practice. MAIN
already diagnosed this problem and made the choice to implement an activity-based
cost-ing analysis. This research focuses on creatcost-ing an ABC-analysis template that could easily
be used by the company. In order to collect data, the actual costs of MAIN of
January-Oc-tober 2015 were used because these costs were the most recent available numbers and
these costs best represent reality . In order to analyse the data, several bookkeeping
pro-grams are used. Also Windows Microsoft Excel was used in order to analyse the data and
to create a simple module that could create an ABC-analysis on monthly or yearly basis.
The results are going to be compared to sales prices. The comparison reflects whether the
theory of ABC-analysis is still applicable in practice or that it is outdated. That is why it is
also a research with academic interest; is the theory applicable in real life?
4.2 Data collection & analysis
As already mentioned, real cost figures of MAIN of January - October 2015 are used in
or-der to calculate an accurate cost rate per activity. These cost figures are obtained using
MAIN’s accounting systems; Lodder, AS400 and Finsys5. The necessary information
could be exported into Excel. It appeared from the data that there were costs that had too
much overlap with two or more activities (overhead costs). These costs could be allocated
to a single activity, however in practice it is a quite inefficient process, which causes
MAIN a lot of time and therefore extra costs. For example, consider employees of the
could be kept up how much time they spent on each division. This is however a very time
consuming process which will not be very reliable because the time spent on a division
could vary over time. So it is a very inefficient process. Therefore, the costs that could not
be assigned to a specific activity are allocated using the proportional by volume method.
This contains that the costs are allocated as follows: a percentage of the overhead costs are
allocated to the different activities. This percentage is based on the already assigned costs
per activity divided by the total already assigned costs. In formula form, it could be
de-scribed as:
𝑋𝑦 =𝐴𝐴𝐶𝑅𝑦
𝐴𝐴𝑇𝐶 ∗ 𝑇𝑂𝐶
Where Xy = Overhead costs x assigned to activity y
AACRy = Already Allocated Costs per Activity y
AATC = Already Allocated Total Costs
TOC = Total Overhead Costs
This formula was deduced from Schotanus’ proportional by volume method, which state
that the total gains and costs of a purchasing group of companies are allocated to single
companies and Kellner, Otto and Lienlands cost-proportional allocation method (Kellner,
Otto, & Lienland, 2014). The amount that is allocated to a single company depends on the
number of items it orders (Schotanus, 2007). Kellner et al., 2014, transformed this method
into a cost-proportional allocation method, which allocate overhead costs according to the
proportion of individual costs of projects. This research allocate overhead costs according
to activities according through the proportion of direct costs per activity, as stated by the
previous formula, because the different divisions of MAIN could be considered as
individ-ual projects and the formula could be easily applied and adjusted.
4.3 Choices made in order to implement ABC-analysis.
In order to use the implementation scheme of Kaličanin and Knežević as a guidance for
implementing an activity-based costing system, several choices have to be made. This
chapter discuss which choices are made during the seven steps of the implementation
4.3.1 Identifying the types of costs according to their allocation: direct costs, traceable costs and non-traceable costs.
In order to assign costs to activities, there first have to be made a distinction between direct
costs, traceable costs and non-traceable costs. In this case, direct costs are the costs that
could directly be assigned to activities, such as labour and material costs. Labour costs that
directly could be assigned to activities are the labour costs of skippers, sailors, truck
driv-ers, lab technicians and cleaners. Labour costs that could not directly be assigned to
activi-ties, such as the costs of financial or human resources department, are treated as an
over-head rate; these costs are divided by the three different divisions on basis of a percentage,
which is elaborated on in chapter 4.2. Also representation costs are an example of
non-traceable costs.
In figure eight, there is given an example of the output that was generated from the
ac-counting programs MAIN uses. In total, the output gives 920 cost items. Normally, this
number is too high, there is a risk that cost items are not used or that there are multiple cost
items for the same costs; therefore overview could be lost (Kroon, 2015). However, in this
case the number of cost items is high because costs are subdivided into several cost types
per ship or truck. In order to create a better overview, cost types are generalized into ledger
numbers, which is graphically shown in figure nine. These ledgers were first divided into
the three divisions of MAIN, afterwards the ledgers were divided into direct costs,
tracea-ble costs and non-traceatracea-ble costs. Ledgers, that could directly be traced to one of the three
divisions, but not directly traced to an activity were labelled: ‘Kosten direct toe te wijzen
aan divisie’. It could be seen as indirect costs or traceable costs of a division. So in fact,
there are two kinds of indirect costs for MAIN: indirect costs for the whole company and
indirect or traceable costs for the divisions. Ledgers that were not traceable were labelled:
‘Indirecte kosten’. Ledgers that could be traced to an activity were labelled with the name
of that matching activity.
4.3.2 Determining the costs of certain activities and procedures related to non-traceable costs.
As mentioned in previous paragraph, ledgers were first allocated to one of MAIN’s three
divisions, when they were traceable. Non-traceable costs were allocated into a so-called
overhead division. These overhead costs were divided among the divisions Terminal,
Logistics and Cleaning using the ‘proportional by volume’-formula that has been
intro-duced in chapter 4.2. It also occurred that some ledgers could partly be allocated into
be allocated to divisions, for instance maintenance of trucks could be allocated to
Logis-tics. However, maintenance to the head quarter could not be allocated directly towards one
of the three divisions. This problem was solved by allocating the maintenance cost types
one by one towards a division.
4.3.3 Identifying cost drivers and output measures of given activities
According to Schniederjans and Garvin (1997), the selection of cost drivers have to be
based on following rules:
“1. Pick activity drivers that match the type of activity.
2. Pick activity drivers that correlate well with the actual consumption of the activity.
3. Reduce the number of unique drivers.
4. Pick activity drivers that encourage improved performance.
5. Pick activity drivers having a modest cost of measurement.
6. Minimize use of activity drivers that require new measurements.” (Schniederjans &
Garvin, 1997)
These rules are based on multiple activities that could have multiple activity drivers.
How-ever, in this case there are not many activity drivers because of the nature of the activities
that are executed by MAIN. Because the divisions Cleaning and Terminal have one core
activity, cleaning of tanks and recycling of waste material, the direct and indirect costs of
these divisions could just be add up. It is not realisable to split up the indirect costs in
dif-ferent activities, because it will be a time-consuming process which is subject to great
di-versity. Therefore, the indirect costs will be add up to the direct costs for the divisions
Cleaning and Terminal. The output measure for the division Cleaning will be the amount
of hours spend by employees on the primary activity, so the hours of actual cleaning.
Be-cause time spend on secondary activities is subject to great diversity, it is not realisable to
assign costs towards activities like setting up of invoices, planning et cetera. Therefore
these costs are seen as indirect costs and use the same output measure as the primary
activ-ity. The cost driver behind the output measure of the cleaning department, hours spend on
cleaning, is the salary of the cleaning personnel.
The costs of the division Terminal are, just like the costs of the Cleaning division, are
caused by core activities: the recycling of oil, oil-water mixtures and fuel remnants. Also
for this division, it is not realizable to come up with output measures for the secondary
of employees et cetera are subject to diversity. The costs of recycling oil are subscribed to
recycling oil, the costs of recycling oil-water mixtures are subscribed to recycling oil-water
mixtures and the costs of recycling fuel remnants are subscribed to recycling fuel
rem-nants. There are also some costs which could not be described to one of the three main
ac-tivities. Based on the proportional-by-volume formula, there will be made a distinction on
how much of the costs are subscribed to recycling of oil, how much of the costs are
sub-scribed to recycling of oil-water mixtures and how much of the costs are subsub-scribed to
re-cycling of fuel remnants. The output measure will be the amount of recycled oil, oil-water
mixtures and fuel remnants The cost driver of the Terminal division are the prices paid for
used oil, oil-water mixtures and fuel remnants.
The costs of the division Logistics could be divided into five cost pools: costs of collecting
waste materials by trucks, costs of collecting waste materials by ships, costs of delivered
water in Den Helder, the costs of delivered shore power in Den Helder and the costs of
ac-tivities executed by third parties. The output measure for collecting waste materials by
trucks is the total amount of hours worked by truck drivers. Because truck drivers have to
wait while oil, oil-water mixtures or fuel remnants are pumped into the truck, there has
been chosen for the total amount of hours worked by truck drivers as output measure
in-stead of, for instance, the amount of kilometres driven by trucks. The cost driver for this
cost pool is the salary of truck drivers. For the same reason, the output measure for
collect-ing waste materials by ships is the amount of worked hours by skippers and sailors and the
cost driver for this cost pool is the salary of skippers and sailors. The output measure for
costs of delivered water in the harbour of Den Helder is the amount of delivered water, the
output measure for shore power is the delivered amount of shore power.
4.3.4 Cost assignment of secondary activities to primary activities based on output measures of secondary activities.
Due to the nature of activities that are provided by MAIN, especially service-focussed, it is
not possible to come up with different output measures for primary activities as well as
secondary activities. Therefore, the output measures of primary activities are also used for
secondary activities.
Because the secondary activities of the Terminal and Cleaning division are activities, like
planning and financial activities, which are subject to great diversity, the costs of these
sec-ondary activities are based on the output measures of the primary activity. The prime
activ-ity of the Terminal division is recycling of oil, oil-water mixtures and fuel remnants.
costs of the primary and secondary activities could be add up and divided by the output of
recycling. There has been chosen to split the costs of recycling oil, oil-water mixtures and
fuel remnants while using the proportional-by-volume method, because these volumes all
move along a different recycling process. The amount of recycled oil, oil-water mixtures
and fuel remnants becomes the output measure for the division Terminal.
Because Cleaning also has one prime activity and some supportive secondary activities
which costs could not be divided due to diversity in these activities, the costs of prime and
secondary costs are summed up and divided by the total hours worked by cleaners; the
out-put measure of the prime activity.
The Logistic division has some primary activities, which are supported by the same
sec-ondary activities. Therefore, the total costs of the secsec-ondary activities are summed up and
allocated to the costs of prime activities based on the proportional-by-volume formula,
which is described in chapter 4.2. The prime activities have the following output measures,
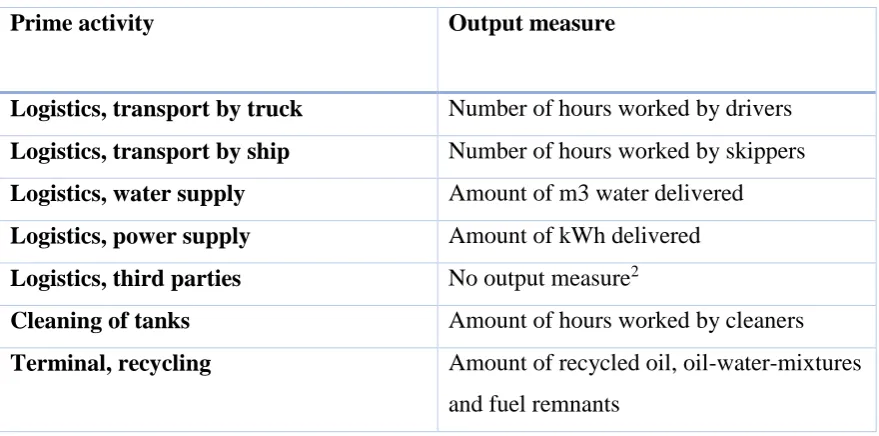
[image:27.595.114.554.408.626.2]as described in the previous chapter:
Table 2. Prime activity and its output measure.
Prime activity Output measure
Logistics, transport by truck Number of hours worked by drivers
Logistics, transport by ship Number of hours worked by skippers
Logistics, water supply Amount of m3 water delivered
Logistics, power supply Amount of kWh delivered
Logistics, third parties No output measure2
Cleaning of tanks Amount of hours worked by cleaners
Terminal, recycling Amount of recycled oil, oil-water-mixtures
and fuel remnants
4.3.5 Compiling a list of activities for each cost object
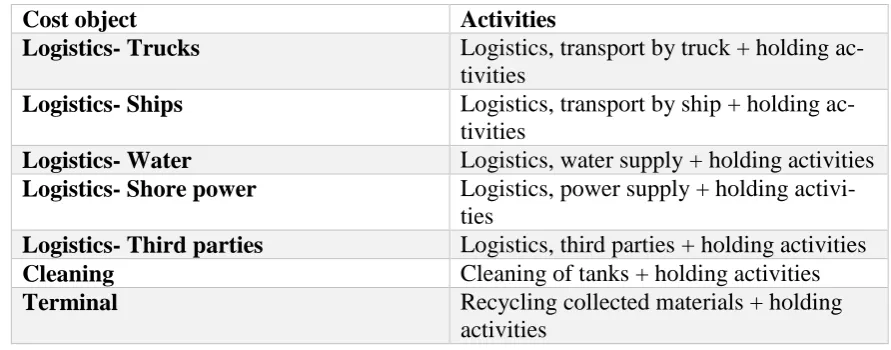
As already described in previous chapters, each cost object exists of a prime activity and some secondary activities that could not be split up due to diversity in this secondary activ-ities. These activities are labelled as holding activactiv-ities. Therefore, an overview of the cost objects and related activities is given in table 3.
Table 3. Cost object and their related activities
Cost object Activities
Logistics- Trucks Logistics, transport by truck + holding ac-tivities
Logistics- Ships Logistics, transport by ship + holding ac-tivities
Logistics- Water Logistics, water supply + holding activities Logistics- Shore power Logistics, power supply + holding
activi-ties
Logistics- Third parties Logistics, third parties + holding activities Cleaning Cleaning of tanks + holding activities
Terminal Recycling collected materials + holding
activities
4.3.6 Determining activity costs of cost objects.
The activity costs were assigned to the cost objects in the Excel file which was developed
in order to create a better overview of costs. In figure nine,a part of the Excel file is
shown. In order to get a full overview of the activity costs, the Excel file should be
checked. Appendix A gives an overview of how the excel-file should be used. The final
re-sults are shown in chapter five.
4.3.7 Direct costs and non-traceable costs are added to activity costs to determine the to-tal costs of cost objects
Figure nine gives a brief view of how the costs are assigned towards the different activities.
In order to get a full overview of the activity costs, the Excel file should be checked.
Ap-pendix A gives an overview of how the excel-file should be used. The results are shown in
5. Results
5.1 Costs per activity, division and revenue per division
As described in chapter four, first there was looked which costs belonged to which
divi-sion. Also the revenues per division are taken in consideration. This led to the following
[image:29.595.118.556.242.343.2]cost per division, including holding costs, and revenues per division:
Table 4. Costs and Revenues per division.3
DIVISION TOTAL COSTS REVENUE
TERMINAL € €
LOGISTICS € €
CLEANING € €
TOTAL € €
Because table four gives an overview of the total costs and revenues per division, the
fig-ures are round up or down to whole figfig-ures. However, some of MAIN’s services compete
on figures after the comma. Therefore it is important that when looking at a detailed level,
the figures must not be round up or down.
These costs were assigned towards the activities that are carried out by each division. This
led to the following costs per activity:
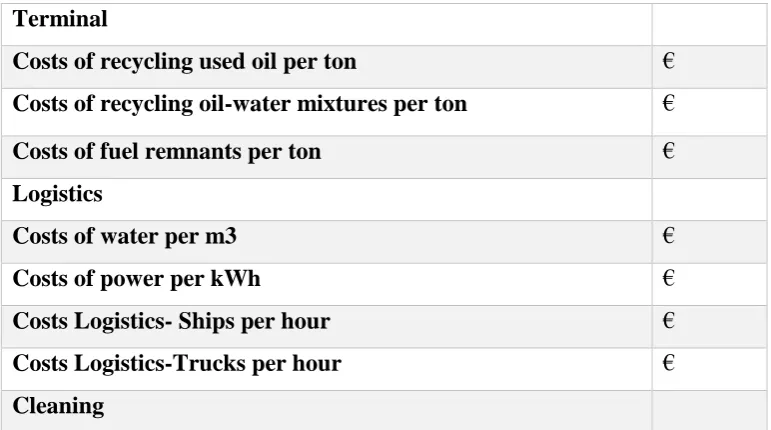
Table 5. Cost price per activity.4
Terminal
Costs of recycling used oil per ton €
Costs of recycling oil-water mixtures per ton €
Costs of fuel remnants per ton €
Logistics
Costs of water per m3 €
Costs of power per kWh €
Costs Logistics- Ships per hour €
Costs Logistics-Trucks per hour €
Cleaning
[image:29.595.113.499.516.731.2]
Costs Cleaning per hour €
These costs exists of direct costs, traceable and non-traceable costs and indirect costs.
These costs were assigned as was described in chapter four. The excel-file that was created
could easily be used for future purposes. A description of how the excel-file should be used
could be found in Appendix A.
5.2 The effect on cost prices when cost structure changes
5.2.1 The effect on cost prices when allocation of indirect costs does not represent reality
[image:30.595.111.554.309.368.2]In order to divide indirect costs, there was chosen to apply the proportional by volume method. So indirect costs were allocated to MAIN’s divisions based on the following percentages: Table 6. Percentages of indirect costs allocated towards division.5
Division % allocated indirect costs
Terminal %
Logistics %
Cleaning %
This allocation method led to the cost prices per activity which were shown in chapter five.
But what if these percentages are not reflecting reality? If the percentages are not reflecting
reality, the cost prices are not correct as well. Therefore, there will be checked what
hap-pens with the cost prices when the allocation of indirect costs changes. This is done by
up-grading and downup-grading the percentage that is allocated towards each division with five
and ten percent.
This lead to the following cost prices:
Table 7. Cost prices Terminal by different amounts of allocated indirect costs.6
Terminal % indirect
costs
% indirect
costs
% indirect
costs
% indirect
cost
% indirect
costs
C.p7. Oil/
ton
€
∆8%
€ ∆%
€ ∆%
€ ∆%
€ ∆%
C.p.
Oil-wa-ter
mix-tures/ ton
€ ∆%
€ ∆%
€ ∆%
€ ∆%
€ ∆%
5 Information is confidential 6 Information is confidential
7 C.p. is an abbreviation for cost price
[image:30.595.109.558.569.734.2]C.p. Fuel remnants/ ton € ∆% € ∆% € ∆% € ∆% € ∆%
Table 8. Cost prices Logistics by different amounts of allocated indirect costs.9
Logistics % indirect
costs % indirect costs % indirect costs % indirect costs % indi-rect costs
C.p. Water/m3 €
∆% € ∆% € ∆% € ∆% € ∆% C.p. Power/ kWh € ∆% € ∆% € ∆% € ∆% € ∆%
C.p.Truck/hour € ∆% € ∆-% € ∆% € ∆% € ∆%
[image:31.595.113.554.204.420.2]C.p. Ship/hour € ∆% € ∆% € ∆% € ∆% € ∆%
Table 9. Cost prices Cleaning by different amounts of allocated indirect costs.10
Cleaning % indirect
costs % indirect costs % indirect costs % indirect costs % indirect costs C.p. Clean-ing/hour € ∆% € ∆% € ∆% € ∆% € ∆%
As could be seen in table seven till nine, a wrong estimation of percentages used for cost
allocation could lead to great diversity in cost prices. So a different allocation of indirect
costs leads to major differences in cost prices. Therefore it is important that the chosen
percentages reflects reality. It appeared that the percentages, as shown in table six, used for
calculating cost prices are considered as a good representation of reality, based on
conver-sations with employees. However, a company could decide to allocate indirect costs not
based on reality but on competiveness. When it appears that the cost price of cleaning for
instance is not competitive, there could be decided to lower the percentage of indirect costs
that is allocated towards cleaning. As could be seen in table nine, allocating five percent
less of indirect costs leads to a reduction of € … per hour or a reduction of …%11.
How-ever, these five percent of indirect costs do no vaporise. It will lead to an increase of costs
of other activities. When these cost prices are still competitive, management could choose
to alter the percentage of indirect costs which are allocated towards a division. However,
the cost prices have to be closely monitored in order to ensure that other activities are still
competitive. Furthermore, the cost price for cleaning is most sensitive towards changes in
allocating indirect costs.
5.2.2 The effect of increased direct costs on cost prices
When MAIN attracts more work, this will lead to an increase of direct costs. Indirect costs
however, do not have to increase, or increases not as much as direct costs because, for
ex-ample, MAIN does not have to hire a new planning member when one more truck or ship
is driving for MAIN. Assuming that the increase of direct costs equals the increase of
out-put, the total costs per activity will be lower because the same amount of overhead is
di-vided by an increased output. This could create a competitive advantage for MAIN.
How-ever, when applying the same logic a decrease in demand will lead to higher costs per
ac-tivity. It could also happens that products used to execute MAIN’s services become more
or less expensive, which also create an in- or decrease in direct costs. There are a lot of
rea-sons why the direct costs could in- or decrease.
So in order to find out what the effect is of an increase or decrease in direct costs of
MAIN’s services on the cost price, there will be modelled what happens with the cost
prices when direct costs increases. Hereby the assumption is made that an in- or decrease
in direct costs up till 30% will not affect indirect costs. Also, it is assumed that the relation
between increased output and increased direct costs is 1:1. So when the demand for oil
in-creases with ten percent, the direct costs will also rise with ten percent. Furthermore, it is
assumed that divisions are independent and therefore the costs of one division do not affect
the costs of other divisions. The results are given in table ten till fifteen.
Table 10. Cost prices Terminal when direct costs increase/decrease due to an in- or
de-crease in demand.12
Terminal Direct
costs de-crease of 30% Direct costs de-crease of 20% Direct cost de-crease of 10% Current situa-tion Direct cost in-crease of 10% Direct cost in-crease of 20% Direct cost in-crease of 30%
[image:33.595.115.553.487.699.2]Oil/ton € ∆% € ∆% € ∆% € ∆% € ∆% € ∆% €2 ∆% Oil-wa-ter mix-tures/ton € ∆% € ∆% € ∆% € ∆% € ∆% € ∆% € ∆% Fuel rem-nants/ton € ∆% €2 ∆% € ∆% € ∆% € ∆% € ∆% € ∆%
Table 11. Cost prices Terminal when direct costs increase/decrease while demand remains
the same.13
Terminal Direct
costs de-crease of 30% Direct costs de-crease of 20% Direct cost de-crease of 10% Current situa-tion Direct cost in-crease of 10% Direct cost in-crease of 20% Direct cost in-crease of 30%
Oil/ton € ∆% € ∆% € ∆% € ∆% € ∆% € ∆% € ∆% Oil-wa-ter mix-tures/ton € ∆% € ∆% € ∆% € ∆% € ∆% € ∆% € ∆%
Fuel rem-nants/ton € ∆% € ∆% € ∆% € ∆% € ∆% € ∆% € ∆%
Table 12. Cost prices Logistics when direct costs increase/decrease due to an in- or
de-crease in demand.14
Terminal Direct
[image:34.595.114.555.548.761.2]costs de-crease of 30% Direct costs de-crease of 20% Direct cost de-crease of 10% Cur-rent sit-uation Direct cost in-crease of 10% Direct cost in-crease of 20% Direct cost in-crease of 30% Water/ m3 € ∆% € ∆% € ∆% € ∆% € ∆% € ∆% € ∆% Power/ kWh € ∆% € ∆% € ∆% € ∆% € ∆% € ∆% € ∆% Trucks/ hour € ∆% € ∆% € ∆% € ∆% € ∆% € ∆% € ∆% Ships/ hour € ∆% € ∆% € ∆% € ∆% € ∆% € ∆% € ∆%
Table 13. Cost prices Logistics when direct costs increase/decrease while demand remains
the same.15
Terminal Direct
costs de-crease of 30% Direct costs de-crease of 20% Direct cost de-crease of 10% Cur-rent sit-uation Direct cost in-crease of 10% Direct cost in-crease of 20% Direct cost in-crease of 30% Water/ m3 € ∆% € ∆% € ∆% € ∆% € ∆% € ∆% € ∆% Power/ kWh € ∆% € ∆% € ∆% € ∆% € ∆% € ∆% € ∆%
Trucks/ hour € ∆% € ∆% € ∆% € ∆% € ∆% € ∆% € ∆% Ships/ hour € ∆% € ∆% € ∆% € ∆% € ∆% € ∆% € ∆%
Table 14. Cost prices Cleaning when direct costs increase/decrease due to in- or decrease
in demand.16
[image:35.595.113.555.248.378.2]Clean-ing Direct costs de-crease of 30% Direct costs de-crease of 20% Direct cost de-crease of 10% Current situa-tion Direct cost in-crease of 10% Direct cost in-crease of 20% Direct cost in-crease of 30% Clean-ing/hour € ∆% € ∆% € ∆% € ∆% € ∆% € ∆% € ∆%
Table 15. Cost prices Cleaning when direct costs increase/decrease while demand remains
the same.17
Clean-ing Direct costs de-crease of 30% Direct costs de-crease of 20% Direct cost de-crease of 10% Current situa-tion Direct cost in-crease of 10% Direct cost in-crease of 20% Direct cost in-crease of 30% Clean-ing/hour € ∆% € ∆% € ∆% € ∆% € ∆% € ∆% € ∆%
Table ten till fifteen show that an in- or decrease of direct costs has influence on the cost
prices per activity. While it seems that the influence of the increases of costs, due to
in-crease in demand for MAIN’s services, do not lead to huge difference in cost prices, in
such competitive industries as the logistic industry and the oil industry a decrease in cost
prices could result in a competitive advantage. When direct costs in- or decrease while the
[image:35.595.113.553.451.582.2]
demand for MAIN’s services and products remain the same, the in- or decrease has a huge
impact on cost prices which could have tremendous consequences for the company.
6. Conclusion
In order to create a better overview of costs, there was implemented an activity-based
cost-ing system that could provide MAIN more accurate information about the cost prices of
MAIN’s activities. Due to the fact that the activities that are executed by MAIN mostly
considers one prime activity that are supported by activities which costs could not be
di-rected to a prime activity, overhead costs such as HRM costs or financial department costs,
the developed system has more resemblances with a traditional costing system than with an
activity-based costing system. Because it was also not possible to implement multiple cost
drivers per activity or service, the principles of activity-based costing were seemingly not
applicable for MAIN. However, the model that is developed could be thought of as, due to
the fact that MAIN’s services exists of one prime activity, a simplified activity-based cost
model. So activity-based costing is still a theory that is applicable in practice. However, for
one company it could be more applicable than to another company.
As table four has shown, MAIN is making losses. When comparing cost prices to sales
prices18, it appeared that the sales prices for Logistics and Cleaning were higher than the
cost prices. However, the cost prices for the division Terminal exceeds the sales prices.
One of the reasons why this could occur is the global decline of oil prices. In order to stay
competitive, MAIN has to adjust towards the market. Therefore it is important for MAIN
to analyse the Terminal division once again in order to find out whether processes could
become more efficient and where costs could be saved.
Furthermore, a different allocation of indirect costs could lead to wrong cost prices.
There-fore it is important that the allocation method more or less match with reality. In this case,
the used allocation method gives, according to employees, a realistic view of divided
indi-rect costs.
Tables ten till fifteen show that MAIN also has to monitor its costs closely. Increases of
di-rect cost which appear due to higher demand will lower the cost price per activity.
How-ever, increased direct costs while demand for MAIN’s services stays the same has a bigger