Research & Development
Performance in the Business
Sector Ireland 2005/6
Science and Technology
Indicators Unit
THE NATIONAL POLICY AND ADVISORY BOARD FOR ENTERPRISE, TRADE, SCIENCE, TECHNOLOGY AND INNOVATION
Forfás
Wilton Park House, Wilton Place,
Dublin 2. Tel: 01-607 3000
Research & Development
Performance in the
Business Sector
Ireland 2005/6
Science and Technology
Indicators Unit
This report examines data and provides analysis on Research and Development activities performed across the business sector in Ireland in 2005 and 2006. It focuses on business sector spending on R&D performed, levels of human resources dedicated to R&D activities, and other performance variables including collaboration activities, and types and aims of R&D conducted. It can be used alongside other data gathered from R&D surveys conducted by Forfás of the
Government and higher education sectors, to examine the total R&D performance across the Irish economy.
Data published and analysed in the report has been gathered from a large-scale survey of the business sector of R&D activity. The survey, “Business Expenditure on Research & Development” (BERD survey), continues a series of biennial surveys carried out by Forfás over the past two decades. The most recent survey was carried out in the period May to October 2006, with the reference year for data collected being the calendar year 2005, with estimates for 2006 also collected.
A more detailed methodological note on operational procedures including sampling, fieldwork procedures, re-weighting and analysis of the data is included in Appendix 1 of this report. It should be noted that the data gathered from this survey of business R&D activities adheres to the strict international rules and definitions laid down by the OECD and Eurostat and published in the “Frascati Manual”. This ensures that the data and analyses in this Irish survey of business R&D activities are internationally comparable, and can be used for performance benchmarking.
Forfás would like to thank the many R&D performing firms across the Irish economy that assisted in the completion of this survey by answering the detailed questionnaires. The strong response rate achieved from businesses to the survey will allow rapid and accurate analysis to take place, paving the way for policymakers to respond to the needs of the business sector regarding the promotion of higher levels of R&D activity over the coming years. This is particularly relevant in the context of the BERD targets set out by the Government in the Strategy for Science,
Technology & Innovation, launched in June 2006.
For further information about this survey please contact:
Andrew Stockman,
Science and Technology Indicators Unit, Science, Technology and Innovation Division, Forfás,
Wilton Park House, Wilton Place, Dublin 2, Ireland
Page
Foreword i
Contents iii
Introduction 1
Executive Summary 2
Key Indicators 8
Chapter 1 Business R&D Performance (all firms) 9
1.1 Introduction and summary 9
1.2 R&D spending 10
1.3 R&D human resources 18
1.4 Other R&D data 28
Chapter 2 Business R&D Performance (medium/large firms) 36
2.1 Introduction and summary 36
2.2 R&D spending 37
2.3 R&D human resources 41
2.4 Other R&D data 45
Chapter 3 Business R&D Performance (small firms) 50
3.1 Introduction and summary 50
3.2 R&D spending 51
3.3 R&D human resources 54
3.4 Other R&D data 59
Annexes 64
Annex 1 Methodology 64
Annex 2 Questionnaire 2005/6 66
The Government’s recently launched Strategy for Science, Technology and Innovation 2006-20131 outlined the importance that research and innovation activities will have in shaping our future economic and social progress. High levels of investment in these areas will help sustain future competitiveness performance, and facilitate economic growth and improved quality of life.
Governments have several roles in facilitating improved R&D performance in the business sector. As well as being a financial supporter of some R&D activities performed in the business sector to address market failures, they have a strong role in promoting a positive R&D environment for businesses. This includes supporting R&D infrastructure, promoting R&D education, training and skills development, facilitating international collaboration and creating a strong and supportive regulatory framework. As well as creating a positive R&D environment for Irish-owned firms, policy in a more globalised and competitive world must also be geared to improving the attractiveness of the country as a location to perform R&D activities by foreign-owned firms.
Specifically, improving Irish R&D performance will be one of the key drivers in attempts to further transform the economy to be a more competitive, dynamic and knowledge-driven economy. The business sector, being the largest performer of R&D in the economy at two-thirds of the total, will play a key role in this regard. Improved R&D performance in the business sector will result in the transformation of new and existing knowledge into innovative, higher value added and
productive commercial activities.
This report focuses on the performance of R&D activities in the Irish economy in 2005 and 20062. It includes all the R&D activities performed within the boundaries of the Irish State, but excludes the R&D activities of Irish firms carried out overseas. Data is gathered by a survey of R&D performers using the strict international rules and guidelines laid out in the OECD Frascati Manual.3
In particular, it should be noted that Business R&D activity is only measured where it is deemed as “Creative work undertaken on a systematic basis in order to create new or improved products, services or other applications”. These R&D activities are therefore distinguishable from other non R&D business activities by the presence of an appreciable element of novelty and by the
resolution of problems and uncertainties using scientific or technological means. Activities such as routine software development, routine monitoring and analysis or pre-production preparation which have no novelty or problem resolution are therefore excluded.
In this regard the survey is the definitive source of internationally comparable R&D performance. Data and analysis from this report is therefore crucial in measuring the trends and performance in achieving success in the goals of increasing R&D investment by the business sector, boosting overall R&D spending and driving forward productivity and economic gains in the future.
1 http://www.entemp.ie/publications/science/2006/sciencestrategy.pdf
2 All 2006 figures are estimates
The Business Expenditure on Research and Development (BERD) report 2005/2006 examines research and development (R&D) spending and performance in the business sector in Ireland for 2005, with estimated results for 2006.
The key survey results from R&D performance in the business sector are:
Spending
Research & development expenditure performed by the business sector in Ireland rose to €1.33 billion in
2005. This represented an annual average increase of 9.7% between 2003 and 2005.
Preliminary estimates for business R&D spending in 2006 indicate a further strong climb, with R&D expenditure growth expected to quicken to 17.3% to stand at an estimated €1.56 billion.
Business R&D spending as a ratio of economic activity (Gross National Product) increased from 0.94% of GNP in 2003 to 0.98% in 2005. This ratio is expected to climb further in 2006 to 1.05% of GNP.
Strong increases in business R&D spending and the level of BERD intensity has allowed for a narrowing of the gap between Ireland and the EU/OECD averages, which stood at 1.14% and 1.54% of GDP respectively in 2005.
R&D spending in real terms in the business sector has nearly tripled in the last decade.
Business R&D spending in Ireland (1992-2006)
€
million
400 600 800 1000 1200 1400 1600
€
1 9 9 2 1 9 9 3 1 9 9 4 1 9 9 5 1 9 9 6 1 9 9 7 1 9 9 8 1 9 9 9 2 0 0 0 2 0 0 1 2 0 0 2 2 0 0 3 2 0 0 4 2 0 0 5 2 0 0 6R&D expenditure by foreign-owned firms rose to €939 million in 2005, with spending by Irish-owned
firms increasing to €390 million. Spending growth of 10% per annum in foreign-owned firms slightly
outpaced the overall 9% annual average increase for Irish-owned firms.
R&D spending in the business sector by ownership
€
million (1995–2005)
The largest performing sector for business R&D in Ireland continued to be the Software/Computer Related areas accounting for 30.4% of all R&D investments in 2005. However, R&D spending growth in this sector was a relatively sluggish 6.8% between 2003 and 2005.
R&D performed by business in the Irish Pharmaceuticals sector increased by 40.4% between 2003 and 2005. This sector now accounts for 20.1% of total business R&D.
The Dublin region was the location for 41.2% of all business R&D performance in 2005, with the BMW accounting for 25.7% of the total and the rest of the country accounting for the remaining 33.1% of the total.
0.6% 0.7% 0.8% 0.9% 1.0%
1996 1997 1998 1999 2000 2001 2002 2003 2004 2005 2006
BERD % GDP BERD % GNP
1329 1105
900
784
467
612
939
775
582 500
400 312
390 330
318 284
212 155
0 200 400 600 800 1000 1200 1400
1995 1997 1999 2001 2003 2005
All (€mn) Foreign-owned (€mn) Irish-owned (€mn)
€
m
R&D spending by medium/large sized firms (>50 employees) rose by 9.6% per annum on average between 2003 and 2005. Expenditure is expected to increase by a high of 19% between 2005 and 2006.
Small firm R&D expenditure (<50 employees) climbed by 9.9% on average per annum between 2003 and 2005. Spending by small firms is anticipated to increase by 12.4% between 2005 and 2006.
Medium/large firms BERDs by ownership (1995-2005)
€
m
Software/ Computer Related 16% Software/ Computer Related 31% Other Services 4% Other Services 2%
Food, Drink & Tobacco
10%
Food, Drink & Tobacco 5% Instruments 5% Instruments 9% Pharmaceuticals 16% Pharmaceuticals 20% Electrical/ Electronic Equipment 27% Electrical/ Electronic Equipment 21% Other Sectors 20% Other Sectors 8%
(% total 1995) (% total 2005)
Chemicals 4% Chemicals 2% 633.5 708.5 840.0 1008.5 514.3 413.0 375.7 464.3 529.5 670.6 818.5 297.8
115.2 138.6 169.2 178.9 169.4 190.0
0.0 200.0 400.0 600.0 800.0 1000.0 1200.0
1995 1997 1999 2001 2003 2005
All medium/large (€mn) Foreign-owned (€mn) Irish-owned (€mn)
€
m
Human Resources
The total number of research personnel (researchers plus technicians and support staff) engaged in R&D in Irish industry has risen to an all-time high of 13,621 in 2005. This represents a 13.2% increase in research personnel working in the business sector since 2003.
The number of researchers working in the Irish business sector increased by 16.4% between 2003 and 2005 to 7,696.
The ratio of the number of researchers employed in the business sector per thousand workers in industrial employment was 4.7 in 2005. This was an increase on the 2003 recorded ratio of 4.5, and above the EU25 average of 4.2 but below the OECD ratio of 6.6.
Total research personnel (headcount) (1995-2005)
57.197.9
320.2
265.1
192.1 149.8
13.4
120.1 106.6
52.3 36.2
24.4 43.7
73.5
113.6
139.8
158.5
200.1
0.0 50.0 100.0 150.0 200.0 250.0 300.0
1995 1997 1999 2001 2003 2005
All (€mn) Foreign-owned (€mn) Irish-owned (€mn)
8000 9000 10000 11000 12000 13000 14000
The Software/Computer Related sector employed the largest number (4,586) of research personnel in 2005, though the rate of increase between 2003 and 2005 was weaker than for some other sectors.
The next largest sectors of research personnel employment in 2005 were the Electrical/Electronic Equipment; Food, Drink & Tobacco; Instruments and Pharmaceuticals sectors.
Total research personnel by sector, 2003 and 2005 (headcount)
Sector 2003 2005
Software/Computer Related 4537 4586
Electrical/Electronic Equipment 2263 2624
Food, Drink & Tobacco 684 1085
Instruments 885 1058
Pharmaceuticals 742 996
Machinery & Equipment 813 815
Other Services 359 724
Chemicals 246 402
Basic & Fabricated Metals 320 355
Wood Products 178 225
Non-Metallic Minerals 151 211
Other Manufacturing 206 202
Rubber & Plastics 230 160
Transport Equipment 157 72
Paper, Print & Publishing 51 55
Textiles, Clothing & Leather 215 51
Total 12037 13621
The number of female research personnel (researchers plus technicians and support staff) engaged in R&D has risen from 2,670 in 2003 to 3,079 in 2005. Female research personnel accounted for 22.6% of the total business R&D work-force in 2005. Some 20.2% of R&D personnel working as researchers in 2005 were female.
2005 2003 2001 1999 1997 1995
0 2500 5000 7500 10000 12500 15000
About 61.2% of all research personnel are employed in medium/large firms compared to 38.8% of research personnel in small firms.
10.8% of all researchers employed in the Irish business sector in 2005 had a PhD qualification. Of this total, 21.8% are female PhD holders.
Other Data
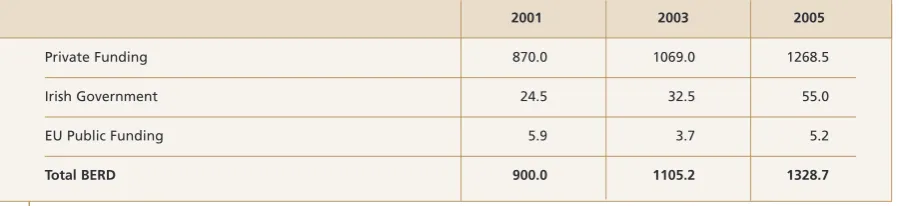
The bulk of the funding for business R&D continues to come from private sources with private funding representing 95.5% of total funding in 2005.
Funding of €55.0 million for business R&D activities performed in Ireland was sourced from the Irish
government (4.1% of the total, up from 2.9% in 2003).
Sources of funding for business R&D 2001, 2003 and 2005
€
mn
2001 2003 2005
Private Funding 870.0 1069.0 1268.5
Irish Government 24.5 32.5 55.0
EU Public Funding 5.9 3.7 5.2
Total BERD 900.0 1105.2 1328.7
There were an estimated 1,370 R&D active firms in Ireland in 2005, ahead of the 1,264 recorded R&D performers in 2001.
Of the total 1,370 R&D active firms in 2005, 1,025 were Irish-owned with the remaining 345 foreign-owned.
50 firms accounted for 57.7% of total R&D spending in 2005.
There was evidence of a shift to higher value-added R&D activities in 2005, with 12% of all spending being classed as basic research, compared to the 4% share estimated in 2001.
35.8% of R&D active firms were involved in some type of collaboration activities. 17.4% of R&D active firms collaborated with other Irish firms.
49.3% of all R&D spending was aimed at developing new products, with 17.3% of expenditure aimed at developing new processes.
1000 1500 2000 2500 3000
2001 2003 2005
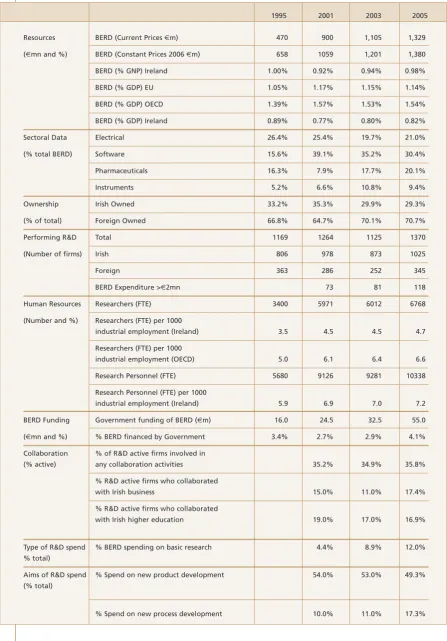
1995 2001 2003 2005
Resources BERD (Current Prices €m) 470 900 1,105 1,329
(€mn and %) BERD (Constant Prices 2006 €m) 658 1059 1,201 1,380
BERD (% GNP) Ireland 1.00% 0.92% 0.94% 0.98%
BERD (% GDP) EU 1.05% 1.17% 1.15% 1.14%
BERD (% GDP) OECD 1.39% 1.57% 1.53% 1.54%
BERD (% GDP) Ireland 0.89% 0.77% 0.80% 0.82%
Sectoral Data Electrical 26.4% 25.4% 19.7% 21.0%
(% total BERD) Software 15.6% 39.1% 35.2% 30.4%
Pharmaceuticals 16.3% 7.9% 17.7% 20.1%
Instruments 5.2% 6.6% 10.8% 9.4%
Ownership Irish Owned 33.2% 35.3% 29.9% 29.3%
(% of total) Foreign Owned 66.8% 64.7% 70.1% 70.7%
Performing R&D Total 1169 1264 1125 1370
(Number of firms) Irish 806 978 873 1025
Foreign 363 286 252 345
BERD Expenditure >€2mn 73 81 118
Human Resources Researchers (FTE) 3400 5971 6012 6768
(Number and %) Researchers (FTE) per 1000
industrial employment (Ireland) 3.5 4.5 4.5 4.7
Researchers (FTE) per 1000
industrial employment (OECD) 5.0 6.1 6.4 6.6
Research Personnel (FTE) 5680 9126 9281 10338
Research Personnel (FTE) per 1000
industrial employment (Ireland) 5.9 6.9 7.0 7.2
BERD Funding Government funding of BERD (€m) 16.0 24.5 32.5 55.0
(€mn and %) % BERD financed by Government 3.4% 2.7% 2.9% 4.1%
Collaboration % of R&D active firms involved in
(% active) any collaboration activities 35.2% 34.9% 35.8%
% R&D active firms who collaborated
with Irish business 15.0% 11.0% 17.4%
% R&D active firms who collaborated
with Irish higher education 19.0% 17.0% 16.9%
Type of R&D spend % BERD spending on basic research 4.4% 8.9% 12.0%
% total)
Aims of R&D spend % Spend on new product development 54.0% 53.0% 49.3%
(% total)
[image:15.595.91.539.109.751.2]Chapter 1 - Business R&D
Performance (all firms)
1.1
Introduction and summary
In this first chapter we will examine various aspects of research and development (R&D) spending and performance by allR&D active firms in Ireland for 2005/2006. This chapter takes a broad overview of aggregate business expenditure and performance and also examines trends over the past 10 years.
The first section focuses on the contribution of business R&D expenditure to economic activity over the past decade and benchmarks Ireland’s performance against various countries internationally. The performance of Irish-owned companies is compared with that of foreign-owned companies and the sectoral composition of R&D spending is examined. A comparison of current and capital R&D related costs is also made. Finally a regional breakdown of spending by all R&D active firms is analysed.
Research & development expenditure performed by the business sector in Ireland rose to €1.33 billion in
2005. This represented an annual average increase of 9.7% between 2003 and 2005. Preliminary estimates for business R&D spending in 2006 indicate a further strong climb, with R&D expenditure growth expected to quicken to 17.3% to stand at an estimated €1.56 billion.
Business R&D spending as a ratio of economic activity (Gross National Product) increased from 0.94% of GNP in 2003 to 0.98% in 2005. This ratio is expected to climb further in 2006 to 1.05% of GNP.
The largest performing sector for business R&D continued to be the Software/Computer Related areas accounting for 30.4% of all R&D investments in 2005. However, R&D spending growth in this sector was a sluggish 6.8% between 2003 and 2005.
The Dublin region was the location for 41.2% of all business R&D performance in 2005, with the BMW accounting for 25.7% of the total and the rest of the country accounted for the remaining 33.1% of the total.
In the second section we look in detail at the human resources allocated by companies to R&D activities. We examine trends over the past 10 years, qualification levels and occupations of the research personnel, the percentage of time spent on R&D, international comparisons and gender breakdown information.
The total number of research personnel engaged in R&D activity in Irish industry rose to an all-time high of 13,621 in 2005. This represents a 13.2% increase in research personnel working in the business sector since 2003.
The Software/Computer Related sector employed the largest number (4,586) of research personnel in 2005, though the rate of increase between 2003 and 2005 was weaker than for some other sectors.
The number of female research personnel engaged in R&D has risen from 2,670 in 2003 to 3,079 in 2005. Female research personnel accounted for 22.6% of the total business R&D work-force in 2005.
Funding of €55.0 million for business R&D activities performed in Ireland in 2005 was sourced from the
Irish government (4.1% of the total).
35.8% of R&D active firms were involved in some type of collaboration activities.
1.2
R&D Spending (all firms)
This section examines expenditureon R&D by the business sector in Ireland during the last decade. The figures are for all firms, incorporating information received for R&D spending and performance by small, medium and large firms.
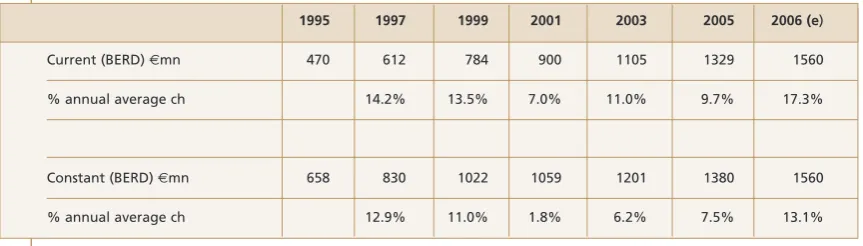
[image:17.595.91.523.346.469.2]Table 1 and Chart 1 below show the trend in business sector R&D spending for the past 10 years, in both nominal and real terms. Between 2003 and 2005 total R&D spending performed by all businesses in Ireland increased from €1.1 billion to €1.33 billion – an annual average increase of 9.7% in nominal terms. Stripping out the effects of inflation BERD rose by 7.5% on average per annum between 2003 and 2005 in constant prices. Firms were asked in the latest survey of expenditure on research and development to estimate spending for 2006. Initial data shows that current R&D spending is expected to accelerate to 17.3% to stand at €1.56 billion.
Table 1: Spending on R&D performed in the Business sector (1995-2006)
41995 1997 1999 2001 2003 2005 2006 (e)
Current (BERD) €mn 470 612 784 900 1105 1329 1560
% annual average ch 14.2% 13.5% 7.0% 11.0% 9.7% 17.3%
Constant (BERD) €mn 658 830 1022 1059 1201 1380 1560
% annual average ch 12.9% 11.0% 1.8% 6.2% 7.5% 13.1%
In the decade from 1995 to 2005, R&D spending by businesses in Ireland almost tripled from €470 million to €1.33 billion in current prices. Spending growth slowed between 1999 and 2001, but re-accelerated to record double-digit gains once more between 2001 and 2005. If the rate of increase in 2006 is confirmed by future surveys then that increase of 17.3% would point to a further quickening in the pace of business sector R&D spending growth. However, a
re-acceleration of inflation in though would erode some of these spending gains in real terms. The rate of BERD growth over the last decade has been one of the strongest in Europe, only outpaced by the BERD gains in China, Israel, Hungary, Poland and Finland.5
4 All data comes from the survey of Business Expenditure of Research and Development 2005/2006 unless otherwise stated.
Chart 1
: Business R&D spending in Ireland (1992-2006)
€
million
Chart 2:
Annual percentage change BERD 1996-2006
Chart 3 shows the ratio of business R&D expenditure to economic activity in the country over the past decade. The chart shows BERD intensity as measured by gross national product (GNP) and gross domestic product (GDP). GNP is the comparative measure usually used for Ireland as GDP figures include the profit repatriation of multinational companies.
Over the last decade, the business R&D intensity ratio has fluctuated between 0.9% of GNP and 1.1% of GNP. The intensity ratio rises when the growth rate of business R&D spending is quicker than the overall growth rate in the economy. If BERD expansion is slower than economic growth, then the intensity ratio falls. BERD growth has therefore had to be extremely strong to keep pace with the rate of economic expansion experienced during the “Celtic Tiger” period.
400 200 600 800 1000 1200 1400 1600 € m n 1 9 9 2 1 9 9 3 1 9 9 4 1 9 9 5 1 9 9 6 1 9 9 7 1 9 9 8 1 9 9 9 2 0 0 0 2 0 0 1 2 0 0 2 2 0 0 3 2 0 0 4 2 0 0 5 2 0 0 6
BERD €mn current prices BERD €m constant prices
0.0% 5.0% 10.0% 15.0% 20.0%
1996 1997 1998 1999 2000 2001 2002 2003 2004 2005 2006
6 Both GNP (Gross National Product) and GDP (Gross Domestic Product) are used for analytical
purposes of economic activity in Ireland. The GDP measure includes the value-added from foreign-owned firms operating in Ireland which are not counted in the GNP measure. As a result GDP in Ireland is 18.5% higher than the GNP measure of economic activity
Between 1996 and 1999, BERD intensity was steady at just over 1.0% of GNP, as BERD growth of 14% matched the rate of expansion in the overall economy. Between 2000 and 2003, the intensity ratio edged down slightly to 0.94% of GNP as BERD growth rates slowed to around 8% and were outpaced by economic growth of 11%. Finally in the period 2003 to 2006, the BERD intensity has risen steadily once more to an estimated 1.06% of GNP as strong BERD growth outpaced overall gains in the economy.
Chart 3
: BERD intensity (as a percentage of economic activity) (1996-2006)
Chart 4 shows the BERD intensity ratio for Ireland discussed previously (in both GNP and GDP terms6
) and benchmarks that performance against the EU25 and OECD average intensities (GDP). It can be seen that Ireland’s BERD intensity ratio has lagged the EU25 and OECD averages over the last decade but that the gap is closing in more recent years. That said, BERD performance, although close to being on a par with the EU25 average, remains considerably below the OECD average intensity of 1.54% of GDP.
In the period 1997 to 2001 the gap between Irish BERD intensity and the EU and OECD average intensities widened as global R&D intensities rose and Irish intensity slowed, despite still strong domestic BERD growth. In the period from 2001 that gap has narrowed as global R&D intensities remained flat and Irish BERD intensity increased once more. If estimates of BERD in 2006 are borne out by data captured from future surveys, then Ireland’s intensity ratio would rise further, and in all likelihood wipe out the intensity gap with the EU25 average.
0.7% 0.8% 0.9% 1.0% 1.1%
1996 1997 1998 1999 2000 2001 2002 2003 2004 2005 2006
Chart 4
: International business R&D intensity as a percentage of economic
activity, (1995 - 2005)
Source: Main Science and Technology Indicators Vol. 2006/2, OECD
Chart 5 takes a closer look at cross-country BERD intensities in 2005 or for the latest year for which data was available on the OECD database. In 2005 Ireland’s BERD intensity of 0.98% of GNP placed it in 16th place out of the 26 countries benchmarked.
The graph points to four different areas of R&D intensity performance. The first group identified is the “bottom” group of low performers with intensity between 0.2% and 0.6% of GDP. The next group up are countries “catching up” with BERD intensities between 0.6% and 1.2% of GDP. Ireland is a member of this group which also contains the average intensity for the EU25.
The third group of “strong” BERD performers are those with intensity ratios between 1.2% and 1.6% of GDP. This group includes the OECD average intensity of 1.54% of GDP. The final group is the selection of “top” performers of BERD intensity. This group includes the world leaders in business R&D performance and includes the USA, Korea, Japan, Finland, Sweden and Israel, which with a business R&D intensity of 3.59% of GDP, leads the world. It should be noted however, that some of these performances are exaggerated by the performance of single large R&D performers operating in the ICT sector or by large military R&D spending.
0.60% 0.80% 1.00% 1.20% 1.40% 1.60% 1.80%
1995 1997 1999 2001 2003 2005 2007
Chart 5:
R&D spending in the business sector as a percentage of GDP (2005 or
latest year data is available from OECD)
Source: Main Science and Technology Indicators Vol. 2006/2, OECD
In Chart 6 we examine the R&D expenditure performance of all business firms by nationality (Irish and foreign). A firm is deemed to be foreign-owned if more than 50% of share ownership is controlled outside of Ireland. If this 50% share ownership threshold is not passed, then the firm, for the purposes of this set of analysis, is deemed to be Irish-owned. This definition is a
harmonised definition used across all EU nations.
Foreign-owned R&D spending of firms programmes carried out in Ireland rose to €939 million in
2005, an annual average increase of 10% between 2003 and 2005. Although the pace of growth of foreign-owned firms has remained strong between 2003 and 2005, there was a slight easing in those growth patterns compared to the 2001 to 2003 period.
R&D spending by foreign-owned firms therefore accounted for 70.6% of the total in 2005, compared to the 66.8% foreign-owned share in 1995. This ratio of foreign-owned R&D performance in the country is amongst the highest in Europe and reflects the very particular industry structure in Ireland, with only Hungary reporting a higher ratio, and with most other countries clustered between a foreign-owned/total ratio pf between 20% and 40%.
0.00% 0.50% 1.00% 1.50% 2.00% 2.50% 3.00% 3.50% 4.00% Turkey
Irish-owned companies’ spending on business sector performed R&D rose to €390 million in 2005. This rise of 8.8% on average per annum compares to the high rate of increase of 10% per annum recorded for foreign-owned companies. The share of R&D performed in the business sector by Irish-owned firms stood at 29.4% in 2005, slightly below the 29.9% ratio posted in 2003, and even further below the 33.2% share recorded ten years earlier.
Chart 6:
R&D spending in the business sector by ownership (Irish-owned or
foreign-owned) 1995–2005 (
€
mn.)
The industry sectors7which spent most on research and development in 2005 were the Software/Computer Related sector; the Electrical/Electronic Equipment sector and the Pharmaceuticals sector. Chart 7 shows that this trend has been maintained since 2001.
R&D spending performed in the Software/Computer Related sector rose to €404 million in 2005, although the 6.8% increase from 2003 was one of the slower sectoral growth rates. R&D expenditure by companies operating in the Electrical/Electronic Equipment sector climbed by 31.5% between 2003 and 2005, to stand at €279.0 million. R&D spending gains of 40.4% in the Pharmaceuticals sector saw the level of R&D spending in this sector rise to €267.1 million. R&D spending growth in the Food, Drink & Tobacco sector also strengthened to 50.4% in the two-year period up to 2005.
1329
1105
900
784
467
612
939
775
582 500
400 312
390 330
318 284
212 155
0 200 400 600 800 1000 1200 1400
1995 1997 1999 2001 2003 2005
All (€mn) Foreign-owned (€mn) Irish-owned (€mn)
Chart 7:
R&D industry spending by selected sectors
€
mn. (2001-2005)
The sectoral share of total research and development spending by all firms in 1995 and 2005 is illustrated in Chart 8. As can be seen clearly the Software/Computer Related sector has greatly increased its share from 15.6% in 1995 to 30.4% of the total in 2005, although this is below the peak of the 39% share recorded in 2001. That said, the sector remains the largest R&D performer.
The Pharmaceuticals sector increased its expenditure on R&D by 250% in the decade between 1995 and 2005. The share of total expenditure from this sector was 16.3% in 1995, and this share fell steadily to a low of 7.8% in 2001, before recovering strongly to take up a growing 20.1% share of the total in 2005, just narrowly behind the number two ranked sector in 2005 – the Electrical/Electronic Equipment sector’s share of 21.0%.
In the Food, Drink & Tobacco sector the percentage share has fallen from 9.9% in 1995 to 4.8% in 2005, although this sector recorded strong growth between 2003 and 2005. Finally the
Instruments sector now contributes 9.4% to total R&D performed in the Irish business sector, almost double the 5.2% share ten years previously.
Chart 8:
R&D sectoral share of total expenditure 1995 and 2005
0 50 100 150 200 250 300 350 400
Chemicals Machinery & Equipment Other Services Food, Drink & Tobacco Instruments Pharmaceuticals Electrical/Electronic Equipment Software/Computer Related
2001 2003 2005
Software/ Computer Related 16% Software/ Computer Related 31% Other Services 4% Other Services 2%
Food, Drink & Tobacco
10%
Table 2 examines the breakdown of overall R&D expenditure into current and capital costs for 2001, 2003 and 2005 and the percentage share of the total costs for these areas to overall R&D spending by all firms. Labour costs represent the largest share of total R&D costs and have been consistently around 55-57% of total costs over the 2001-2005 period. The next largest category are other current costs which represent 30-35% of total expenditure, but their share of the total has declined over the period from 35.3% to 29.5%.
Table 2:
Total R&D expenditure showing current and capital costs and percentage
of total
2001 2003 2005 2001 2003 2005
€mn €mn €mn % share % share % share
Labour Costs 515.3 612.5 747.6 57.2% 55.4% 56.3%
Other Current Costs 318.0 339.6 392.1 35.3% 30.7% 29.5%
Land and Buildings 15.6 81.5 55.9 1.7% 7.4% 4.2%
Equipment 51.3 71.4 133.1 5.7% 6.5% 10.0%
Total 900.2 1105.0 1328.7
The remaining costs are made up of land, buildings and equipment which combined represent a relatively small percentage of total costs. However, R&D related expenditure on land and buildings has increased by 258% between 2001 and 2005 and spending on equipment has increased by 159%. More recently spending on land and buildings has eased somewhat as large-scale R&D building works come to an end and these firms begin the next stages of development including tooling up of these buildings with R&D equipment.
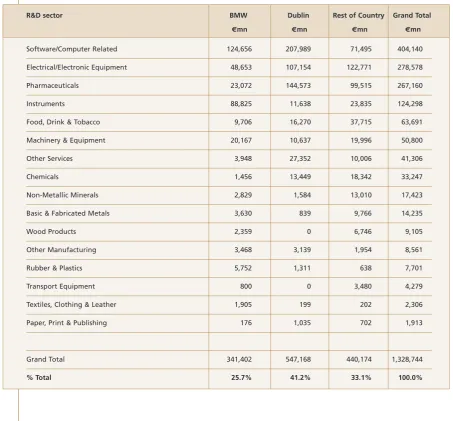
The regional and sectoral distribution of R&D spending by all business companies during 2005 is illustrated in Table 3. The country is divided into the Border, Midlands and West (BMW) region, Dublin city and county and the rest of the country (which excludes the BMW region and Dublin city and county) for the purposes of this analysis. Overall the largest region for R&D performance in 2005 was the Dublin region with 41.2% of total R&D spending performed in this region. However, Dublin’s percentage of total spending decreased in 2005 to 41.2% from the 2003 share of 46.5%.
The next largest region was the rest of the country (excluding BMW and Dublin city and county) which was the location for 33.1% of all R&D spending. R&D spending located in the rest of the country region has decreased from a 38.1% share in 2003. Finally the BMW region was the location for 25.7% of total R&D in 2005 increasing its percentage of the total considerably from only 15.4% in 2003.
8 “Research Personnel” incorporates researchers, technicians and administrative/support staff engaged
[image:25.595.88.542.87.508.2]in R&D work.
Table 3:
Regional distribution of R&D spending by sector, 2005
R&D sector BMW Dublin Rest of Country Grand Total
€mn €mn €mn €mn
Software/Computer Related 124,656 207,989 71,495 404,140
Electrical/Electronic Equipment 48,653 107,154 122,771 278,578
Pharmaceuticals 23,072 144,573 99,515 267,160
Instruments 88,825 11,638 23,835 124,298
Food, Drink & Tobacco 9,706 16,270 37,715 63,691
Machinery & Equipment 20,167 10,637 19,996 50,800
Other Services 3,948 27,352 10,006 41,306
Chemicals 1,456 13,449 18,342 33,247
Non-Metallic Minerals 2,829 1,584 13,010 17,423
Basic & Fabricated Metals 3,630 839 9,766 14,235
Wood Products 2,359 0 6,746 9,105
Other Manufacturing 3,468 3,139 1,954 8,561
Rubber & Plastics 5,752 1,311 638 7,701
Transport Equipment 800 0 3,480 4,279
Textiles, Clothing & Leather 1,905 199 202 2,306
Paper, Print & Publishing 176 1,035 702 1,913
Grand Total 341,402 547,168 440,174 1,328,744
% Total 25.7% 41.2% 33.1% 100.0%
1.3
R&D Human Resources (all firms)
Introduction
In this section we change focus from R&D spending analysis of all firms to examine in detail trends on human resources dedicated to R&D activities. In particular, focus is placed on the number of research personnel8
engaged in research and development over the past 10 years; the differing occupations of these personnel; the qualification level of the researchers; the percentage of time actually spent on R&D; international comparisons and gender breakdown information.
Chart 9:
Total research personnel 1995-2005 (headcount)
We are able to break down the headcount information gained from the business R&D survey into the occupation of the research personnel (includes researchers, technicians and support staff -see Chart 10).
The number of researchers has increased from 5,000 in 1995 to 7,696 in 2005, a 53.9% rise over the decade. Researcher numbers in the business sector which had fallen slightly between 2001 and 2003, regained momentum to rise by 16.4% in the following period. The numbers of both technicians and support staff have fluctuated over the 10 year period but technicians reached an all-time high of 3,095 in 2005. The ratio of 4 technicians per 10 researchers employed in the business sector has remained relatively stable in the last decade. The level of R&D support staff reached a high of 2,830 in 2005.
Chart 10:
Research personnel by occupation, 1995-2005 (headcount)
8000 9000 10000 11000 12000 13000 14000
1995 1997 1999 2001 2003 2005
Researchers
R
2005
2003
2001
1999
1997
1995
0 2500 5000 7500 10000 12500 15000
Technicians Support
7696
6611
6937
6620
6200
5000
3095
2799
2642
2991
2800
2100
2830
2627
2741
2698
2593
Respondents to the BERD survey were asked to estimate the average percentage of time spent by research personnel in carrying out research and development work. This information provides a measure of relevant full-time equivalent (FTE) employment, a standard metric of international comparison of R&D human resources performance. For example, someone who is recorded as having spent 50% of their time engaged in an R&D activity is regarded as 0.5 of a full-time equivalent research worker. Similarly, a technician spending 25% of their time conducting R&D activities is counted as 0.25 of a FTE.
Chart 11 provides information on the numbers of FTE research personnel engaged in R&D activities for the past 10 years in the Irish business sector. The number of FTE R&D human resources has increased sharply in the last 10 years from 5,680 FTE in 1999 to 10,338 FTE in 2005. There was a brief stalling in R&D FTE levels between 2001 and 2003 as R&D headcount numbers fell, although this drop was counterbalanced in FTE terms as more time was spent by those numbers conducting research activities.
Chart 11:
Total research personnel 1995-2005 (Full Time Equivalent)
Chart 12 and Table 4 show that when broken down into types of research occupation, the total FTE personnel figures show a similar trend to the headcount personnel figures. Researchers are the largest employment category and their numbers have increased by 99% in the last decade from 3,400 in 1995 to 6,768 in 2005. The number of FTE technicians has also increased gradually since 1995. By contrast the number of FTE support staff rose from 1,280 in 1995 to 1,407 in 2001 but since 2001 the numbers have decreased to 1,256 just marginally above the 1995 number.
4000 5000 6000 7000 8000 9000 10000 11000
Chart 12:
FTE research personnel by occupation (1995-2005)
The overall amount of average time spent on research and development in the business sector by research personnel has risen from 58.6% on average in 1995 to 75.9% in 2005 (Table 4). The time use of research personnel conducting research activities peaked in 2003 at 77.1%, before easing back a little in 2005.
[image:28.595.105.501.97.283.2]Researchers have increased the amount of time spent on purely R&D activities from 68% in 1995 to almost 88% in 2005, though there has been a drop from the 2003 percentage. The percentage of time spent on R&D projects by technicians has also risen steadily from the 48% recorded in 1995 to 74.8% in 2005. Average time spent supporting research activities by other R&D support staff fell back to 44.4% in 2005 having peaked at a 51.9% rate in 1999.
Table 4:
Average R&D time use of business sector research personnel by
occupation (1995-2005)
1995 1997 1999 2001 2003 2005
Researchers 68.0% 69.7% 79.9% 86.1% 90.9% 87.9%
Technicians 47.6% 48.2% 54.5% 66.2% 68.2% 74.8%
Support 49.2% 50.1% 51.9% 51.3% 51.7% 44.4%
Research Personnel Total 58.6% 60.1% 67.6% 74.1% 77.1% 75.9%
In table 5 we examine the number of business sector FTE researchers and research personnel (all R&D occupations) engaged in R&D activities, as a ratio of total industrial employment in Ireland and internationally. This ratio is a standard international benchmarking indicator.
3400 4320
5291 5971
6012 6768
1000 1350
1630 1748
1909 2314
1280
1300
1400 1407
1359 1256
0 2000 4000 6000 8000 10000
1995 1997 1999 2001 2003 2005
Table 5:
Irish business sector researchers and research personnel 1995-2005
(FTE per 1000 industrial employment)
1995 1997 1999 2001 2003 2005
Researchers 3.5 4.2 4.3 4.5 4.5 4.7
Research Personnel 5.9 6.7 6.8 6.9 7.0 7.2
The ratio of FTE business sector researchers per thousand in industrial employment rose to 4.7 in 2005, boosted by strong relative rises in researcher employment. That ratio has risen from a level of 3.5 business researchers per thousand in industrial employment in 1995. Looking at the wider research personnel category which includes all types of R&D occupations, the ratio for that group per thousand in industrial employment increased to 7.2 in 2005, ahead of the 5.9 ratio estimated ten years previously. Chart 13 shows international comparisons of the number of business sector FTE researchers engaged in R&D activities as a ratio of the number in total industrial
employment.
Chart 13:
International comparisons of business sector researchers 2005
(FTE per 1000 industrial employment)
Source: Main Science and Technology Indicators, Volume 2006/2, OECD
0.0 5.0 10.0 15.0
In 2003 Ireland’s ratio of 4.5 remained unchanged from 2001. This has now increased slightly to 4.7 in 2005 with the country continuing to rank above the EU25 average ratio of 4.2 (3.8 in 2003), though below the OECD average ratio of 6.6 (5.9 in 2003). Finland and Sweden remain the leading OECD countries with ratios of 13.8 and 13.1 researchers per thousand in industrial employment respectively for the latest year data was available.
Chart 14 provides similar international benchmarking data but this time for the wider research personnel category employed per thousand in industrial employment. Despite Ireland’s ratio increasing to 7.2 in 2005 it still ranks below the EU25 average of 7.6 and the OECD average of 11.0 for this employment category. As with the international comparisons for researchers alone, the top ranking countries are Finland and Sweden, though Sweden’s ratio of 21.9 is slightly above Finland’s ratio of 20.2 for the latest year in which data was available.
Chart 14:
International comparison of business sector research personnel, 2005
(FTE per 1000 industrial employment)
*Forfás estimates
Source: Main Science and Technology Indicators, Volume 2006/2, OECD
0.0 5.0 10.0 15.0 20.0 25.0
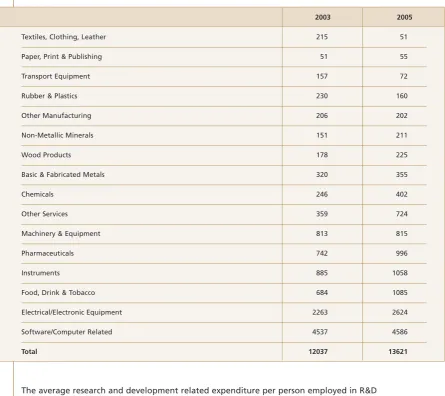
The total number of research personnel employed in the business sector in Ireland in 2005 can be broken down into sectors of employment (table 6). The sector employing the largest number of research personnel in both 2003 and in 2005 was the Software/Computer Related areas which employed 4,586 research personnel in 2005. While the numbers employed in this area in 2005 have only increased very slightly over the 2003 figures (1.1% rise), the sector remains well ahead of the next largest R&D employment sector, the Electrical/Electronic Equipment sector which employed 2,624 research personnel in 2005, a 16.0% rise from 2003.
As a percentage of total R&D employment, the Software/Computer Related sector employed 38% of the total in 2003, which dropped to 33% of the total in 2005. By contrast R&D related
[image:31.595.93.539.283.679.2]employment in the Electrical/Electronic Equipment sector remained at the 2003 level of 19% of the total. The Food, Drink & Tobacco sector increased its employment of research personnel by 59% over the 2003 and 2005 period, overtaking the Instruments sector.
Table 6:
Total research personnel by sector, 2003 and 2005
2003 2005
Textiles, Clothing, Leather 215 51
Paper, Print & Publishing 51 55
Transport Equipment 157 72
Rubber & Plastics 230 160
Other Manufacturing 206 202
Non-Metallic Minerals 151 211
Wood Products 178 225
Basic & Fabricated Metals 320 355
Chemicals 246 402
Other Services 359 724
Machinery & Equipment 813 815
Pharmaceuticals 742 996
Instruments 885 1058
Food, Drink & Tobacco 684 1085
Electrical/Electronic Equipment 2263 2624
Software/Computer Related 4537 4586
Total 12037 13621
Table 7:
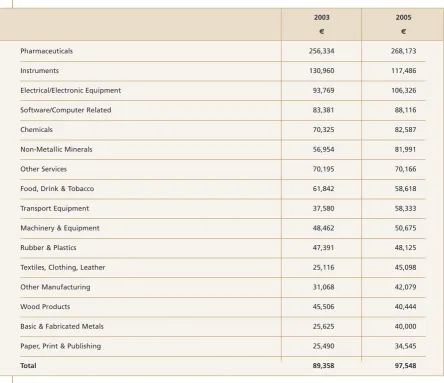
Expenditure per person employed in R&D activities by sector, 2003 and 2005
2003 2005
€ €
Pharmaceuticals 256,334 268,173
Instruments 130,960 117,486
Electrical/Electronic Equipment 93,769 106,326
Software/Computer Related 83,381 88,116
Chemicals 70,325 82,587
Non-Metallic Minerals 56,954 81,991
Other Services 70,195 70,166
Food, Drink & Tobacco 61,842 58,618
Transport Equipment 37,580 58,333
Machinery & Equipment 48,462 50,675
Rubber & Plastics 47,391 48,125
Textiles, Clothing, Leather 25,116 45,098
Other Manufacturing 31,068 42,079
Wood Products 45,506 40,444
Basic & Fabricated Metals 25,625 40,000
Paper, Print & Publishing 25,490 34,545
Total 89,358 97,548
The next section of the analysis of human resources focuses on gender issues. The latest BERD survey allowed for the splitting of research personnel data within the business sector to be further sub-divided into a male-female split for all occupations.
Chart 15:
Female research personnel and researchers, 2001-2005 (headcount)
Chart 16 examines the total number of female research personnel broken down into the other types of R&D occupations for the period 2001-2005. All three categories of R&D employment underwent a drop in numbers in 2003. However all three categories increased their female headcount between 2003 and 2005, with female support staff increasing by 11.4%, female technicians increasing by 18.6% and researchers by 16.1%.
Chart 16
Female research personnel by occupation, 2001-2005 (headcount)
The percentage of female researchers in Ireland as a percentage of total female R&D workers in the business sector is benchmarked in Chart 17 against a selection of other countries
internationally. Data for this benchmarking chart is taken from the OECD Main Science and Technology Indicators report which uses survey data gathered under a common methodology across EU and OECD countries. Countries are asked to supply data on a headcount basis of researchers working on R&D activities in the business sector split by gender. A ratio is then created by dividing the female researcher headcount by the total researcher headcount total.
Researchers Technicians Support staff
1405 1341 1557
578 574 681
924
755
841
0 500 1000 1500 2000 2500 3000 3500
2001 2003 2005
0 500 1000 1500 2000 2500 3000 3500
2001 2003 2005
Chart 17:
International comparison of female researchers as a percentage of total
(headcount) female workers in the business sector
Source: Main Science and Technology Indicators, Volume 2006/2, OECD
Ireland’s female BERD researcher employed ratio of 20.2% ranks mid-way on the chart above other EU countries such as Italy, Czech Republic, Finland, Germany and the Netherlands. The female researcher employed ratio for France, Belgium and Norway are almost on a par with Ireland’s ratio. The Russian Federation and Slovakia show the highest percentage of female researchers as a percentage of total business sector researcher employed workers at 41.2% and 32.4% respectively.
The next section of the human resources section examines the qualifications of R&D staff employed in the business sector. Within the survey firms were asked to identify those people employed in R&D activities in the firm, and to break this down into those with a PhD qualification.
The total number (7,696) of researchers in the business sector (male and female) in 2005, with a PhD qualification rose to 830 in 2005. The number of PhD qualified researchers has therefore almost doubled between 2001 and 2005.
0 10 20 30 40 50
Chart 18
Total researchers by qualification in the business sector
2001-2003 (headcount)
The ratio of PhD qualified researchers to the overall number of researchers was 10.8% in 2005. This compares with a ratio of 10.4% in 2001 and 7.0% in 2003.
Chart 19
PhD researchers as a percentage of total (headcount) researchers in the
business sector, 2001 -2005
1.4
Other R&D data (all firms)
In this section we examine data gathered from the business R&D survey on sources of funding for research and development; numbers of R&D active enterprises and distribution of expenditure by ownership; trends in spending by type of research, including a sectoral breakdown; R&D
collaboration between the business sector and other areas and the aims of R&D projects carried out in the Irish business sector.
As can be seen in Table 8 the bulk of the funding for business R&D in 2005 continued to come from private sources, with private funding representing 97% of total funding in 2001 and 2003 and 95% in 2005. Irish Government sourced funding has increased its share of total BERD funding from 2.9% in 2003 to 4.1% in 2005 while the EU funding share has declined from 0.6% in 2001 to 0.4% in 2005.
420 466 830
6517 6145
6866
0 1000 2000 3000 4000 5000 6000 7000 8000
2001 2003 2005
PhD NonPhD
0.0% 2.0% 4.0% 6.0% 8.0% 10.0% 12.0%
Table 8:
Sources of funding for business R&D 2001, 2003 and 2005 (
€
mn)
2001 2003 2005
Private Funding 870.0 1069.0 1268.5
Irish Government 24.5 32.5 55.0
EU Public Funding 5.9 3.7 5.2
Total BERD 900.0 1105.2 1328.7
[image:36.595.93.507.365.738.2]The number of firms engaged in research and development activities (R&D active) has increased by 17% in the last decade (see Table 9 and Chart 19). Irish-owned R&D performing companies have grown from 873 in 2003 to 1,025 in 2005 an increase of 17.4% in the period. The number of R&D active foreign-owned R&D companies rose to 345 in 2005 from the 252 estimated number in 2003.
Table 9:
R&D performing firms by ownership, 1995-2005
1995 1997 1999 2001 2003 2005
Irish-owned 806 890 905 978 873 1025
Foreign-owned 363 300 248 286 252 345
Total 1169 1190 1153 1264 1125 1370
Chart 19 shows clearly that the total number of R&D performing companies (both foreign and Irish-owned) has risen sharply by 17.4% between 2003 and 2005.
Chart 20:
Estimate of number of R&D active firms by ownership, 1997-2005
0 200 400 600 800 1000 1200 1400 1600
1997 1999 2001 2003 2005
Foreign-owned Irish owned
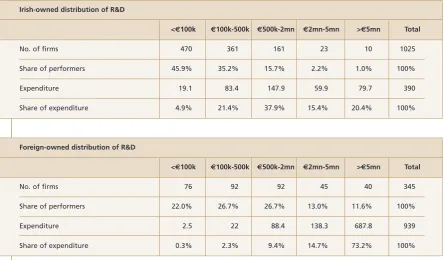
In Table 10 and Charts 20 and 21 we examine the distribution of Irish and foreign-owned R&D active companies’ and their expenditure attributed to differing sized firms in 2005. For Irish-owned industry in 2005, the largest number of R&D performing companies (470), were companies spending less than €100,000 on R&D projects. This represents almost 46% of the total number of Irish-owned companies who were classed as R&D active. The next largest grouping of firms, were companies located in the €100,000 to €500,000 R&D spending bracket, representing 35% of the total. 33 R&D performing Irish-owned companies spent more than €2 million on R&D in 2005. Compared to similar analyses for 2003, not only are the numbers of R&D active Irish-owned firms increasing, but the average spend is also rising as companies step up the size of R&D spending projects.
Table 10:
Irish-owned and foreign-owned distribution of R&D, 2005
Irish-owned distribution of R&D
<€100k €100k-500k €500k-2mn €2mn-5mn >€5mn Total
No. of firms 470 361 161 23 10 1025
Share of performers 45.9% 35.2% 15.7% 2.2% 1.0% 100%
Expenditure 19.1 83.4 147.9 59.9 79.7 390
Share of expenditure 4.9% 21.4% 37.9% 15.4% 20.4% 100%
Foreign-owned distribution of R&D
<€100k €100k-500k €500k-2mn €2mn-5mn >€5mn Total
No. of firms 76 92 92 45 40 345
Share of performers 22.0% 26.7% 26.7% 13.0% 11.6% 100%
Expenditure 2.5 22 88.4 138.3 687.8 939
Share of expenditure 0.3% 2.3% 9.4% 14.7% 73.2% 100%
By contrast the biggest share of foreign-owned R&D performing firms are located in the
€100,000 to €2,000,000 R&D expenditure categories representing 53.4% of the total. A total of 85 foreign-owned R&D active companies undertake projects with research spending greater than
Chart 21:
Irish-owned firms’
Chart 22:
Foreign-owned
R&D performance
firms’ R&D performance
For the 2005-2006 business R&D survey, respondents were asked to identify the percentage of total research undertaken in 2005 classified by the following research types:
Basic research – “involving the experimental or theoretical work undertaken primarily to acquire new knowledge without any particular application or use in view”
Applied research – “the original investigation undertaken to acquire new knowledge primarily directed towards a specific practical aim or objective”
Experimental development – “systematic work drawing on existing knowledge gained from research and practical experience that is directed to producing new materials, products and devices, to installing new processes, systems and services, or to improving substantially those already produced or installed”.
Chart 22 illustrates the results, with half of all research spending undertaken by the business sector being classified as experimental development. Projects grouped under this category totalled €670.5 million in 2005 (50.5% of the total spending undertaken). Applied research accounted for 37.6% (€499 million) of total R&D spending in 2005, with basic research projects accounting for the remaining 12% of total R&D spending undertaken in the year (€159.3 million).
Chart 23:
Business R&D spending by type of research, 2005
0.0% 5.0% 10.0% 15.0% 20.0% 25.0% 30.0% 35.0% 40.0% 45.0% 50.0%
<€100k € 100k-500k
€ 500k-2mn
€ 2mn-5mn
>€5mn
Share of Performers Share of Expenditure Share of Performers Share of Expenditure 0.0% 10.0% 20.0% 30.0% 40.0% 50.0% 60.0% 70.0% 80.0%
<€100k € 100k-500k
€ 500k-2mn
€ 2mn-5mn
>€5mn
Chart 23 shows that R&D spending in the business sector in Ireland has been, in relative terms, more focused on basic and applied research programmes, with less relative focus on experimental development type projects. The share of total R&D spending accounted for by basic research projects has risen steadily from a 4% rate in 2001, climbing to 8.9% of total R&D spending in 2003, before increasing further to a 12.0% ratio in 2005. Similarly, the share of total R&D spending coming under the applied research category increased from a 20% total share in 2001 to a 37.4% total share in 2005. With the pace of R&D spending growth in the basic and applied categories outstripping R&D spending gains on experimental development driven projects, that share has fallen from 76% in 2001 to a 50.5% share in 2005.
Chart 24:
BERD spending by type of research as % of total spending, 2001-2005
[image:39.595.99.477.201.425.2]If we further analyse the type of research undertaken by type of business sector, we can see that in the Electrical/Electronic Equipment sector more than half the research undertaken was experimental, followed by applied research. Experimental research made up the highest percentage share of the total for every sector except the Instruments sector where applied research was over 50.9% of the total. Relative levels of basic research were strongest in the Software/Computer Related sector, with the spending ratio of 18.5% of total R&D spending in the sector recorded in 2005. In contrast basic research type projects accounted for just 5.1% of total R&D spending in the Electrical/Electronic Equipment sector in 2005.
Table 11:
Type of research by sector, 2005
Type of Research Basic Applied Experimental
Electrical/Electronic Equipment 5.1% 38.7% 56.2%
Software/Computer Related 18.5% 38.2% 43.3%
Pharmaceuticals 10.0% 36.5% 53.5%
Instruments 10.5% 50.9% 38.6%
Food, Drink & Tobacco 13.7% 29.4% 56.9%
Other Sectors 11.3% 30.0% 58.7%
Total 12.0% 37.6% 50.4%
4% 8.9% 12.0%
20% 24.7%
37.6%
76% 66.4%
50.5%
0% 20% 40% 60% 80% 100% 2001
2003 2005
The percentage levels of types of research by sector have changed since 2003 in line with the overall percentage changes in the three research types. The percentage of experimental research undertaken by all sectors dropped considerably in the 2003 to 2005 period with resultant increases in both applied, and to a lesser extent, basic research. This was most noticeable in the Software/Computer Related sector where the percentage of experimental research dropped from 71% to 43.3% and the Electrical/Electronic Equipment sector which recorded levels of 56.2% for experimental research in 2005 as opposed to 74% in 2003.
In the following table we examine the number of business firms who were classed as R&D active and who engaged in collaboration activities, such as joint research projects, with higher
education institutions or other firms both inside and outside the country during 2005.
[image:40.595.90.538.350.465.2]Of the total number of firms (1,370) who were R&D active in 2005, 490 firms (35.8%) were involved in some type of R&D collaboration activity. 239 R&D active firms collaborated with other Irish firms (17.4% of total active) slightly ahead of the 323 companies who collaborated with other companies outside of Ireland (23.6%). Looking at higher education R&D collaboration rates, 231 firms collaborated with higher education institutions in Ireland (16.9% of R&D active), ahead of the 116 firms that collaborated with higher education institutions outside of Ireland (8.5%).
Table 12:
Collaborative activities of R&D active firms in 2005
Collaboration
Higher Higher
Other Other Firms Education Education Any type
Firms in Outside in Outside of
Ireland Ireland Ireland Ireland Collaboration
All Firms (1,370 active) 239 323 231 116 490
% active 17.4% 23.6% 16.9% 8.5% 35.8%
Chart 24 shows the percentage of research activities undertaken by Irish businesses in collaboration with other firms and with higher education institutions both inside and outside Ireland from 2001 to 2005. Collaborative research projects with companies outside Ireland has remained the area where most collaboration has taken place since 2001 with the Irish higher education sector being the next most popular choice for joint research projects.
Chart 25:
Percentage of R&D active companies which engaged in collaborative
research, 2001-2005
The highest level of collaborative research activity during 2005 was undertaken by the
[image:41.595.106.470.93.306.2]Electrical/Electronic Equipment sector with firms outside Ireland, which has remained unchanged since 2003. The next highest relative level of collaboration was between the Instruments sector and firms outside Ireland with collaboration levels of 32.7%. By contrast the lowest level of collaboration was between the Software/Computer Related sector and higher education institutions outside Ireland. This sector’s highest levels of collaboration were with other firms both inside and outside Ireland.
Table 13:
Percentage of BERD companies engaged in collaboration activities by
sector, 2005
Higher Higher Other Other Firms Education Education
Firms in Outside in Outside
Ireland Ireland Ireland Ireland
Electrical/Electronic Equipment 24.4% 35.3% 21.2% 15.4%
Software/Computer Related 17.6% 20.8% 13.1% 5.5%
Pharmaceuticals 25.8% 31.8% 27.3% 9.1%
Instruments 20.2% 32.7% 32.7% 8.7%
Food, Drink, Tobacco 17.0% 21.3% 16.5% 8.0%
Other Sectors 14.1% 19.9% 13.6% 8.1%
Total 17.4% 23.6% 16.9% 8.5%
0.0% 5.0% 10.0% 15.0% 20.0% 25.0%
% with other Irish
Firms
% with Firms outside
Ireland
% with Irish Higher
Education
% with Higher Education
outside Ireland
The 2005 BERD survey asked companies carrying out R&D projects in Ireland in 2005, to specify their main aims when undertaking research. The aims were classified as:
Developing new products
Improving existing products
Developing new processes
Improving existing processes
Other aims
Chart 26:
Aims of R&D spending as a percentage of total R&D spending
As can be seen in Chart 25 development of new products in 2005 was the main motivation for undertaking research among business companies in Ireland, accounting for 49.3% of the total. Improving existing products accounted for 24.7% while developing new processes accounted for 17.3%. The remaining 8.8% of relevant expenditure was undertaken for the purposes of improving existing processes and other unspecified aims.
1.0% 7.8%
24.7%
49.3%
17.3%
0% 10% 20% 30% 40% 50% 60%
Chapter 2 - Business R&D
Performance (medium/large firms)
Medium/Large firms >50 employees9
2.1
Introduction and Summary
This chapter brings forward the analyses of the first chapter and focuses further on the R&D performance of medium/large firms i.e. those employing more than 50 employees. Splitting the business R&D analysis into differing sizes of firms allows a closer look to be taken of the differing performance of varying firms. This analysis therefore allows R&D performance strengths and weaknesses to be identified for differing sizes of firms, which in turn facilitates better policymaking for these different areas of the economy.
The first section of this chapter focuses once more on the key area of R&D spending, though this time for medium/large sized firms. The second section examines the human resources allocated by medium/large firms to performing R&D activities. The final section looks at other R&D
performance variables for medium/large firms including sources of funding for R&D activities, number of R&D active firms, types of research, collaboration and the aims of research programmes.
Like most developed nations a large majority of R&D spending is undertaken by medium/large firms. In 2005 the ratio of spending by these firms as a percentage of the total R&D spending was 75.8%. The growth rates of R&D spending by medium/large firms has therefore fallen behind the growth rates of R&D spending performed by small firms (those employing <50 employees). That said the ratio has been falling steadily from 1995 when it peaked at 87.9% of the total
performance, although estimates for 2006 show an increasing ratio once more as larger projects by medium/large firms located in Ireland start to take effect.
Over the last five years strong R&D spending expansions by medium/large firms operating in the Pharmaceuticals sector has resulted in the sector rapidly challenging the previously dominant Software/Computer Related sector for the number one sectoral spending position.
Looking at human resources, 61.2% of all research personnel are employed in medium/large firms. Of this total 68.1% are employed in medium/large foreign-owned firms, with 31.9% employed in Irish-owned firms. Between 2001 and 2005 the strongest growth in R&D personnel employment has been in the Pharmaceuticals and Instruments sectors of the economy.
Among researchers an average 91.8% of working time in medium/large firms is spent conducting research, ahead of the 80.7% average research time spent by researchers employed in smaller firms. 58.7% of all PhD qualified researchers are employed by medium/large firms.
Some 45.4% of all R&D active medium/large firms were involved in collaboration with either other firms or with higher education institutions.