State Expenditure on
Science & Technology and
Research & Development
2005 and 2006
State Expenditure on
Science & Technology
and Research &
Development
2005 and 2006
Science & Technology
Budget
REVIEW OF STATE EXPENDITURE ON SCIENCE AND TECHNOLOGY
AND RESEARCH AND DEVELOPMENT 2005 AND 2006
Incorporating financial expenditures in 2005 and allocations for 2006 by Government to institutions engaged in any activity related to science and technology.
Prepared by:
Helena Connellan
Science and Technology Indicators Unit
Helena Connellan
Andrew Stockman
Monica Roche
Abbreviated list of Acronyms*
AAGR Average Annual Growth RateBERD Business expenditure on R&D
CSF Community Support Framework
FTE Full Time Equivalent
GBAORD Government Budget Appropriations and Outlays on R&D
GERD Gross Expenditure on R&D
GOVERD Government Expenditure on Intramural R&D
HERD Higher Education Expenditure on R&D
OST Office of Science and Technology - Department of Enterprise, Trade and Employment
R&D Research and Development
RSE Researcher
S&T Science and Technology
SSH Social Sciences and Humanities
If you require further information about this survey please contact:
Andrew Stockman
Manager, Science and Technology Indicators Unit
Forfás, Wilton Park House, Wilton Place
Dublin 2, Ireland
Tel: + 353 1 607 3224
www.forfás.ie
Executive Summary
The following are the main findings of the 2006 science budget:
The Government Budget Allocation to R&D rose to an estimated €829 million in 2006. This represented
an 18.1% increase in real terms compared to the previous year.
In international terms Ireland ranks second out of 36 countries for growth in Government funding of R&D (GBAORD) over the last decade.
GOVERD as a percentage of GNP fell to 0.09% in 2006 from 0.12% in 2002. Ireland is positioned at the lower end of 31 countries benchmarked.
The total science budget for 2006 totalled an estimated €2.3 billion which is an increase of 10% over the 2005 outturn. Expenditure on S&T activities has increased almost threefold between
1996 and 2006 from €830million to €2.3 billion. The greatest share of the science budget is spent on education and training. In 2006 this amounted to €1.1 billion, making up 46% of the total State S&T spend.
The next largest category of S&T spending is for Research and Development (R&D). This accounts
for an estimated €784 million in 2006. The R&D share of total S&T expenditure has increased
from 24% in 2001 to 35% in 2006. In real terms stripping out inflationary effects, R&D spending
has increased by 65% from €475 million in 2001 to €784 million in 2006. Expenditure on
technology transfer has increased from €6 million to €105 million in the same period.
Civil GBAORD1amounted to €829 million in 2006. Internationally, Ireland ranks highly with an average annual growth rate (AAGR) of 14% for civil GBAORD over the last decade, increasing
to 18% in the period from 2002 to 2006. The positive outputs of increased GBAORD have already
been captured in the Survey of R&D performed in the Higher Education Sector 2004. HERD
increased by 52% (€170 million) over the 2002 figure.
In relative terms, GBAORD as a percentage of GNP has increased from 0.36% in 1996 to 0.55% in
2006. This compares with an OECD average of 0.50% in 1996 and 0.56% in 2006. The differential
has narrowed considerably bringing Ireland in line with the OECD average.
Total GOVERD2for 2006 is an estimated €139 million. Almost two thirds of GOVERD is performed by Teagasc and the Marine Institute. Agricultural and natural sciences research
accounts for almost 80% of research performed in the Government sector, most of which is
applied research.
GOVERD as a percentage of GNP fell to 0.09% in 2006 from 0.12% in 2002. Ireland is positioned
last out of 31 countries benchmarked. This is due to a reduction of 1% in expenditure on R&D
performed in the Government sector coupled with a 20% increase in GNP in 2006 over 2004.
Finally the Science Budget analysed Human Resource data across State performed S&T activities.
Researchers (FTEs3) accounted for 38% of total R&D personnel in 2006. Almost two-thirds of
Government sector researchers are PhD holders. Two-thirds of male and over half of female
researchers have doctoral qualifications. Female researchers account for 36% of total researchers
in the government sector. Ireland ranks 17th out of 30 countries in this area.
1 GBAORD is the international metric used to compare public funding of R&D. Civil GBAORD eliminates the defence R&D
component thereby improving data comparability with Ireland which has no budget for defence R&D
2 Expenditure on in-house R&D in the Government Sector
Contents
Preface i
Introduction ii
1 Science and Technology Budget 1
1.1 Total S&T budget 1
1.2 Trends in S&T expenditure 2
1.3 S&T intensity trend 4
2 Funding of Research and Development 7
2.1 Introduction 7
2.2 Public funding of R&D and GBAORD 8
2.3 GBAORD classified by area of spending in the economy 10
2.4 GBAORD as a percentage of GNP and international comparisons 10
2.5 Annual growth rates of civil GBAORD and international comparisons 12
3 Performance of R&D in the public sector 13
3.1 Total expenditure on R&D performed in the Government sector 13
3.2 Performance of R&D in the Government sector as a % of GNP 14
3.3 Types of research 15
3.4 Field of science 16
4 Personnel engaged in R&D 17
4.1 Total research personnel in the Government sector 17
4.2 Researchers in the Government sector 18
4.3 Researchers categorised by gender and field of science 19
Appendix 1:Methodology 21
Appendix 2:Questionnaire 24
Appendix 3:Detailed tables/Acronyms/Definitions 29
Appendix 4:Government departments and agencies’ programmes 35
List of Charts
Figure 1: Total Science Budget 2006 1
Figure 2: Total science and technology expenditure in the State sector, 1996 -2006 2
Figure 3: S&T spending by activity since 2001 in constant prices 3
Figure 4: Distribution of S&T expenditure by activity 3
Figure 5: Total S&T expenditure as a percentage of GNP, 1996–2006 5
Figure 6: S&T budget and GNP in constant prices, 1996–2006 5
Figure 7: Annual percentage differences in S&T expenditure and GNP growth, 1996–2006 6
Figure 8: R&D funding and performance system 7
Figure 9: GBAORD trend in constant prices, 1996-2006 8
Figure 10: GBAORD and GBAORD as a percentage of GNP, 1996–2006 11
Figure 11: International comparisons of civil GBAORD as a percentage of GDP 12
Figure 12: Average annual growth rate of civil GBAORD for selected countries, 2001–2006 12
Figure 13: Major R&D performers in the State sector, 2006 13
Figure 14: GOVERD as a percentage of GNP and GOVERD trend, 1996–2006 14
Figure 15: Total R&D personnel by occupation in FTEs, 2006 17
Figure 16: Total R&D personnel in terms of headcount and FTEs, 2003–2006 18
Figure 17: Total Researchers, 2003–2006, HC and FTEs 18
Figure 18: Researchers by gender and qualification, 2006 19
Figure 19: Researchers classified by gender and field of science (FTE), 2006 19
List of Tables
Table 1: Total expenditure on science and technology 2001, 2005 outturn 4
and 2006 allocation, current prices (€million)
Table 2: Government departments and agencies funding R&D activities, 2006 9
Table 3: GBAORD classifications for Ireland, 2006 10
Table 4: International comparisons of civil GBAORD as a percentage of GDP, 11
1996 and 2006
Table 5: GOVERD as a percentage of GDP, 1996 and 2006 15
Table 6: GOVERD by type of research, 2006 16
Table 7: Field of science classified by type of research, 2006 16
Table 8: Total researchers classified by gender and field of science 20
Appendix Tables
Table 1: Government departments/agencies funding S&T activities 2006 23
Table 2: Average annual growth rates in civil GBAORD, 2001 – 2006 30
Table 3: International comparisons of GOVERD as a percentage of GDP, 1996 and 2006 31
Table 4: Women researchers as a percentage of total researchers in the 32
Preface
Increased investment in science and technology, and in particular research and development,
is a vital part of Ireland’s plan to become a more knowledge-driven economy. Increased and
continuing investments in these key areas will be crucial to maintaining future economic stability,
improving Ireland’s competitiveness position on the international stage through higher
productivity, and sustaining high levels of future employment.
Increased public and private investment in R&D in recent years has placed Ireland in a strong
position to become a more knowledge-driven economy which delivers high value added activities.
One of the key driver’s of this improving performance has been a significant rise in State
investment and spending for S&T and R&D activities performed in the higher education,
business and state sectors of the economy.
In this context, measurement and analysis of relevant indicators of Science and Technology allow
policymakers to assess the progress being made on developing a strong knowledge economy.
This publication details the actual and allocated spending by the Government on S&T activities
in 2005 and 2006 respectively as well as providing analysis of performance over the last decade.
The report has a strong R&D focus particularly in relation to Government funding of R&D across
all sectors, and also to performance of R&D in Government departments and agencies. This
enables benchmarking of the objectives set out in the Lisbon agenda, which aims to increase
the European Union’s R&D and innovation performance in order to compete with strong
knowledge economies like the US and Japan.
The Strategy for Science, Technology and Innovation4was launched in 2006 by the Department
of Enterprise, Trade and Employment to facilitate the continuing transition to a strong
knowledge intensive economy. It is a targeted seven year plan to promote and increase S&T
activities in Ireland and will lay a strong foundation from which future economic growth can
develop. It was developed to implement the goals of the Lisbon agenda and the National Action
Plan and commits to spending €2.7 billion of exchequer funds to 2008 on S&T activities with a particular focus on R&D. It also aims to build up Ireland‘s research base by
Increasing the numbers of students taking science subjects from primary school to PhD level
Providing supports for businesses to perform research, from inception to commercialisation of ideas
Fostering a collaboration culture in Ireland across sectors and within sectors i.e.
industry/academic linkages
through clusters and networks.
We would like to thank the 41 Government agencies and departments that participated in this
survey. Further methodological information on the survey is contained in Appendices 1 and 2.
4 Strategy for Science, Technology and Innovation 2006-2013 Department of Enterprise, Trade and Employment
Introduction
Forfás annually publishes the ‘Science and Technology Budget’ report which provides a
comprehensive account of State expenditure on S&T and other performance indicators gathered
from the survey. The Science Budget is a mandatory survey which is compiled from returns from
41 Government agencies and Departments that fund or undertake science and technology (S&T)
activities.
It details expenditure on research and development (R&D); education and training; technical
services; technology transfer and other S&T activities. Details are given of the allocations made
by Government to all S&T activities undertaken by the public and private sectors. Some 41
government departments and agencies were involved in allocating the total S&T budget in 2006.
The science budget data is comparable with R&D surveys of the Government sector in other OECD
and EU countries and is harmonised using OECD definitions. The survey is conducted in strict
adherence to the OECD Frascati manual guidelines and in accordance with Eurostat directives.
Further classifications of R&D such as gender, field of science, type of R&D and GBAORD5have
been added to this year’s report.
There have been some changes to the questionnaire and report this year reflecting a greater
focus on the R&D component of the S&T budget. Three of the four chapters are dedicated to
R&D, one each to funding, expenditure and personnel. A copy of the questionnaire is contained
in the Appendix 2 and the accompanying CD contains details of individual Government agencies’
and departments’ S&T programmes.
1
Science and Technology Budget
This chapter provides details of the total S&T budget allocations for 2006 and the final outturn
for 2005. The trend in S&T expenditure over the last decade and the component S&T activities are
also examined here in more detail.
1.1
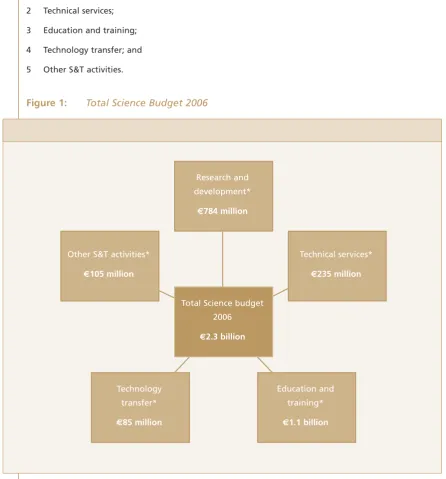
Total Science Budget
The 2006 Science Budget records the total spending on S&T in 2005 and the funds allocated for
2006. The total Science and Technology budget for 2006 is €2.3 billion and covers the following five activities:
1 Research and development;
2 Technical services;
3 Education and training;
4 Technology transfer; and
[image:10.595.88.535.245.725.2]5 Other S&T activities.
Figure 1:
Total Science Budget 2006
* Definitions in Appendix 3
Total Science budget
2006
€2.3 billion Other S&T activities*
€105 million
Technical services*
€235 million
Technology
transfer*
€85 million
Education and
training*
€1.1 billion Research and
development*
1.2
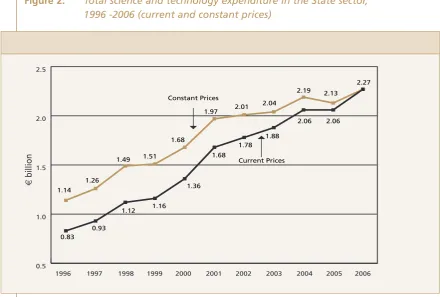
Trends in S&T expenditure
Figure 2 shows the increase in spending on science and technology in the State sector in the last
[image:11.595.90.531.143.440.2]decade. The two trend lines show spending in current and constant6terms.
Figure 2:
Total science and technology expenditure in the State sector,
1996 -2006 (current and constant prices)
Source: Forfás Survey of State Expenditure on S&T activities, 2006
The graph shows that expenditure on S&T activities has increased almost threefold between
1996 and 2006 in current prices. The annual average growth rate between 1996 and 2001 in S&T
spending was 15%, which slowed between 2002 and 2006 to 6%. The total S&T budget remained
static for a number of reasons between 2004 and 2005.7
It is anticipated however that the total S&T budget will increase by 10% in 2006 in current prices
to total €2.27bn. In real terms this represents a 6.6% increase compared to the previous year. Of this total, the greatest share is spent on education and training. In 2006 this amounted to €1.06 billion, making up 46% of the total State S&T spend. Spending on education and training for S&T
activities increased by 11.9% between 2005 and 2006.
The next largest category of S&T spending is in the Research and Development category (R&D).
This accounted for an estimated €784 million in 2006, an increase of 8.4% from the previous year. Spending on technical services rose by 19.9% between 2005 and 2006, totalling €235mn in 2006.
6 Data is converted to 2006 prices using the consumer price index which incorporates the effects of inflation
7 S&T spending was static as a result of downward effects from:
1. A reduction of €71 million in 2005 over the 2004 figure due to a change in the methodology for calculating the S&T portion
of the block grant for the HEA;
2. A drop of €47 million in capital expenditure for the OPW due to the completion of the Dept of Agriculture Laboratory;
3. A fall of €22 million for the Dept of Communications over 2004 - mainly capital expenditure for upgrading the broadband
network; and
4. Reductions in expenditure of €8 million and €4 million for Media Lab Europe and the NSAI respectively.
1996 1997 1998 1999 2000 2001 2002 2003 2004 2005 2006
€
b
il
li
o
n
Constant Prices
Current Prices
0.5 1.0 1.5 2.0 2.5
1.14 1.26
1.49 1.51
1.68
1.97 2.01
2.04
2.19 2.13
2.27
2.06 2.06
1.88 1.78 1.68
1.36
1.16 1.12
Figure 3:
S&T spending by activity since 2001 in constant prices
Source: Forfás Survey of State Expenditure on S&T activities, 2006
Since 2001 R&D expenditure increased in real terms by €308 million indicating an annual growth rate of 11% over the period. Expenditure on technology transfer has increased from €6 million to €105 million and spending on other S&T activities has halved in real terms from €210 million in 2001 to €105 million in 2006.
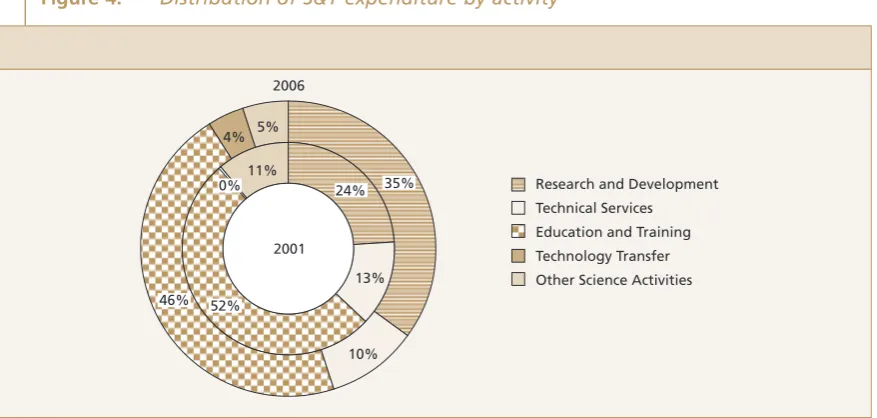
The R&D share of total S&T expenditure has increased from 24% in 2001 to 35% in 2006. In real
[image:12.595.94.533.562.771.2]terms stripping out inflationary effects, R&D spending has increased by 65% from €475 million in 2001 to €784 million in 2006. Expenditure on technology transfer has increased from €6 million to €105 million in the same period.
Figure 4:
Distribution of S&T expenditure by activity
Source: Forfás Survey of State Expenditure on S&T activities, 2006
2001
1996 1997 1998 1999 2000 2001 2002 2003 2004 2005 2006 2002 2003 2004 2005 2006
€
m
il
li
o
n
€
m
il
li
o
n
0 200 400 600 800 1000 1200
Constant Prices
Current Prices Education and Training
Research and Development
Technical Services Other S&T Activities
Technology Transfer
0.000 0.625 1.250 1.875
1.14 1.26
1.49 1.51 1.68
1.97 2.01 2.04 2.19
2.13 2.27
2.06 2.06 1.88 1.78 1.68 1.36 1.16 1.12
0.93 0.83 2.500
2001 2006
Research and Development
Technical Services
Education and Training
Technology Transfer
Other Science Activities 4%
11% 5%
10% 13%
46% 52%
24% 35%
8 The difference between GDP and GNP is now estimated to be 19% in Ireland
Figure 4 shows the R&D share of total S&T expenditure has increased from a quarter in 2001
to more than a third in 2006. This highlights the importance placed on R&D in Ireland over the
5 year period. Total R&D expenditure in 2006 is expected to reach €784 million. The HEA will fund €253 million and SFI will fund €132 million.
[image:13.595.92.534.220.308.2]Technology transfer makes up 4% (€85 million) of the total budget which is up 4 percentage points since 200l. Teagasc and Enterprise Ireland account for €45 million and €33 million respectively.
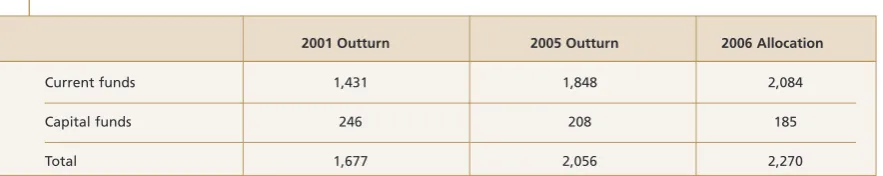
Table 1:
Total expenditure on science and technology 2001, 2005 outturn
and 2006 allocation, current prices (
€
million)
2001 Outturn 2005 Outturn 2006 Allocation
Current funds 1,431 1,848 2,084
Capital funds 246 208 185
Total 1,677 2,056 2,270
Source: Forfás Survey of State Expenditure on S&T activities, 2006
The majority of spending in the Science Budget takes place under the category current spending.
Table 1 shows that current expenditure accounted for €2.08 billion of the total science budget in 2006, alongside the €185 million in capital expenditure.
The 2006 Science Budget totalled €2.3 billion, an increase of 35% over the 2001 figure driven mainly by large increases in funding for R&D from SFI, the Department of Education and Science,
the HEA and the research councils (IRCSET and IRCHSS). It is anticipated that 2006 will yield an
increase of €213 million over the 2005 outturn.
The major increases in S&T programmes in 2006 over 2005 are:
1. €111 million - Dept of Education and Science comprised of the following programmes:
-€43 million - Institutes of Technology
-€40 million - Science and Technological Education (Investment) Fund -€12 million - Third level research and development activities -€7 million - Third level grants
2. €39 million - CSO mainly attributable to the 2006 census
3. €17 million - HRB research award schemes
4. €14 million - Department of Communications Marine and Natural Resources for the continued upgrading of Ireland’s broadband network
5. €11 million - Dept. of Social and Family Affairs for technical services 6. €10 million - SFI to support research excellence in biotech and ICT
1.3
S&T intensity trend
It is also important to calculate the S&T spending performance in relative terms to changing
levels of economic activity. Gross National Product (GNP) is the more meaningful metric used
for economic activity comparison purposes in Ireland as Gross Domestic Product (GDP) is
distorted8 by profit repatriations from large multinational firms. Figure 5 shows total S&T spend
Figure 5:
Total S&T expenditure as a percentage of GNP, 1996 – 2006
Source: Forfás Survey of State Expenditure on S&T activities, 2006
Despite an almost trebling of expenditure on science and technology activities over the last
decade, the S&T intensity ratio has fallen slightly from 1.6% of GNP in 1996 to 1.52% of GNP in
2006. The variability in S&T intensity is partially due to large increases in GNP over the last decade.
There has been strong growth in GNP over the last decade with an annual growth rate of over
11%. The annual growth rate of total S&T spend has remained constant at almost 11% as shown
in Figure 6.
Figure 6:
S&T budget and GNP in constant prices, 1996 – 2006
Source: Forfás Survey of State Expenditure on S&T activities, 2006
1996 1997 1998 1999 2000 2001 2002 2003 2004 2005 2006
%
1.35 1.40 1.45 1.50 1.55 1.60 1.65 1.70 1.75
1996 1997 1998 1999 2000 2001 2002 2003 2004 2005 2006
%
€
m
ill
io
n
Total Science Budget Left Axis
Gross National Product Right Axis
0.0 0.5 1.0 1.5 2.0 2.5
[image:14.595.92.532.497.749.2]As a result there has been no improvement in the S&T intensity ratio in the past decade.
The minimum S&T intensity ratio was 1.5% in 1999 and the maximum was 1.72% in 2001.
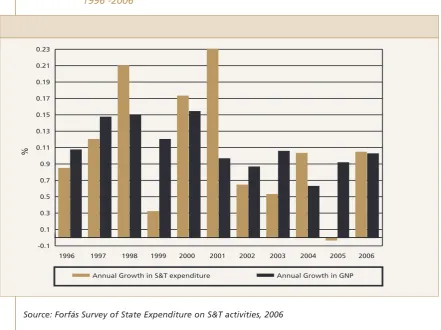
Figure 7 shows the annual percentage differences in GNP and S&T spend since 1996. In 2001,
S&T spend increased by 22 % on an annual basis, far outpacing the recorded 10% growth in gross
national product. This yielded the highest S&T intensity of the decade at 1.72%. However
in 2005 the S&T intensity dropped to 1.52 % as a result of S&T spending remaining flat whilst
economic growth accelerated to 9.3%.This intensity level remained static in 2006 as S&T spending
[image:15.595.91.533.226.556.2]growth quickened once more to 10.4%, marginally ahead of anticipated GNP growth of 10%.
Figure 7:
Annual percentage differences in S&T expenditure and GNP growth,
1996 -2006
Source: Forfás Survey of State Expenditure on S&T activities, 2006
1996 1997 1998 1999 2000 2001 2002 2003 2004 2005 2006
%
-0.1 0.1 0.3 0.5 0.7 0.9 0.11 0.13 0.15 0.17 0.19 0.21 0.23
2
Funding of Research and
Development
2.1
Introduction
This chapter focuses further on the most important part of the total Science Budget spend –
Research and Development. Research and development is a key driver of economic growth.
Strong investment in R&D by the State will facilitate Ireland’s transition to a knowledge economy
and build a foundation for future economic stability. This will enable Ireland to compete
effectively with established and emerging knowledge economies.
Research and development, as defined by the OECD "comprises creative work undertaken on a systematic basis in order to increase the stock of knowledge, including knowledge of man, culture and society, and the use of this stock of knowledge to devise new applications.“
(Frascati Manual, OECD, 2002).
The importance placed on R&D by the Government is measured by taking Government funding
as a proportion of economic activity. This is an internationally comparable metric and Ireland
ranks second out of 36 countries.
The Science Budget has a particular focus on research and development and yields the following
two R&D indicators.
1. GBAORD – Government Budget Appropriations or Outlays on R&D
[image:16.595.93.534.451.782.2]2. GOVERD – Measure of R&D performed in the Government sector (chapter 3)
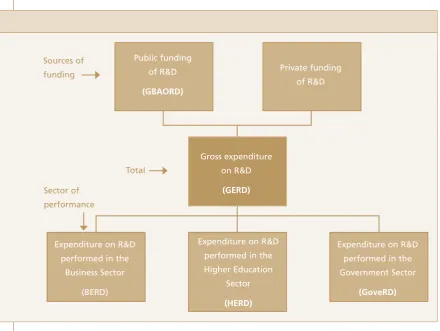
Figure 8:
R&D funding and performance system
Expenditure on R&D
performed in the
Higher Education
Sector
(HERD) Gross expenditure
on R&D
(GERD)
Expenditure on R&D
performed in the
Business Sector
(BERD)
Expenditure on R&D
performed in the
Government Sector
(GoveRD) Public funding
of R&D
(GBAORD)
Sources of
funding Private funding
of R&D
Total Sector of
GOVERD (chapter 3) is the total expenditure on R&D performedon site in government agencies
and departments for example, Teagasc and the Marine Institute. It does not include R&D
contracted out to a third party.
GBAORD is the measure of Government fundingof R&D in all sectors, and includes for example:
IDA and EI funding for business sector R&D
Funding for the higher education sector administered by the Department of Education and the HEA
Funding for Government sector performed R&D for example, Teagasc
2.2
Public funding of R&D and GBAORD
The main focus for the science budget is public financing of research and development which
comprises exchequer and EU funds. The internationally recognised indicator for benchmarking
State funding performance of R&D is GBAORD (Government Budget Appropriations or Outlays
on R&D).
The GBAORD indicator includes all publicly funded R&D including social sciences and humanities.
(The science budget does not request data on social sciences and humanities, the HEA provide
[image:17.595.91.533.357.626.2]this component and it is added to the Public R&D estimate calculated from the Science Budget).
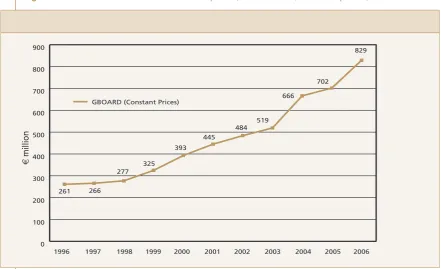
Figure 9:
GBAORD trend in constant prices, 1996-2006 (constant prices)
Source: Forfás Survey of State Expenditure on S&T activities, 2006
Figure 9 shows that GBAORD has increased substantially in Ireland over the last decade, a positive
indication of the value placed on R&D by the Government. Total GBAORD amounted to an
estimated €829 million in 2006 and the public allocation of funds for R&D is €771 million. This represents an 18.1% increase in real terms compared to the previous year, and a 22.6%
year-on-year rise in current prices. Internationally, Ireland ranks highly with an average annual
growth rate (AAGR) of 14% for civil (non-defense) GBAORD over the last decade, increasing to
18% in the period from 2002 to 2006. The positive outputs of increased GBAORD have already
been captured in the Survey of R&D performed in the Higher Education Sector 2004. HERD
increased by 52% (€170 million) over the 2002 figure.
1996 261 266
277 325
393 445
484 519
666
702
829
1997 1998 1999 2000 2001 2002 2003 2004 2005 2006
€
m
il
li
o
n
GBOARD (Constant Prices)
Table 2 provides a breakdown of public R&D funding by main Government departments/key
[image:18.595.93.531.139.492.2]agencies.9
Table 2:
Government departments and agencies funding R&D activities, 2006
Funding Department/Organisation Public R&D (€m)
Education and Science 366
Enterprise, Trade and Employment 206
Agriculture and Food 61
Communications, Marine and Natural Resources 54
Health & Children 41
Social & Family Affairs 17
Environment 13
Finance 6
Community Rural and Gaeltacht Affairs 3
Office of Public Works 2
Central Bank 1
Taoiseach 1
Arts, Sport and Tourism 0.4
Transport 0.1
Total 771
Source: Forfás Survey of State Expenditure on S&T activities, 2006
The State currently invests in a wide range of R&D programmes including:
€132 million – Science Foundation Ireland for a range of programmes promoting research excellence in the biotechnology and information communication technology (ICT) sectors;
€81 million - the Dept of Education and Science for third level R&D activities;
€58 million - the Higher Education Authority for the Programme for Research in Third Level Institutes (PRTLI);
€37 million - the Health Research Board for research award schemes;
€44 million - Enterprise Ireland to support indigenous companies undertaking R&D activities;
€21 million - IDA Ireland to encourage foreign–owned companies to perform R&D in Ireland;
€18 million – The Irish Research Council for Science, Engineering and Technology to fund R&D in Science, Engineering and Technology in third level institutes; and
€8 million – The Irish Research Council for Humanities and Social Sciences to fund R&D in the Humanities and Social Sciences in third level institutes.
2.3
GBAORD classified by area of spending in the economy
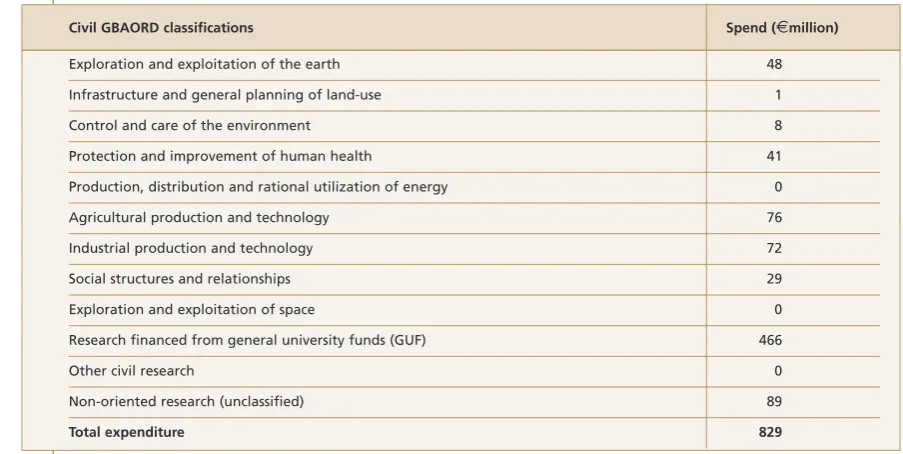
The total GBAORD for 2006 - €829mn can be classified into 11 types of economic areas as shown in Table 3. More than half of Irish GBAORD in 2006 (€466 million) is earmarked for performance in the Higher Education sector. This includes funding from direct sources of funding such as
Science Foundation Ireland, Higher Education Authority PRTLI schemes and also from Enterprise
Ireland and other sources of research funding to the higher education sector. The GBAORD total
aimed at the Higher Education sector also includes an estimate of indirect funding from the HEA
block grant. The amount calculated is the academic portion of the block grant spent on teaching
[image:19.595.80.532.247.474.2]salaries of S&T researchers. This is calculated using a time use ratio and unit cost methodology.
Table 3:
GBAORD classifications for Ireland, 2006
Civil GBAORD classifications Spend (€million)
Exploration and exploitation of the earth 48
Infrastructure and general planning of land-use 1
Control and care of the environment 8
Protection and improvement of human health 41
Production, distribution and rational utilization of energy 0
Agricultural production and technology 76
Industrial production and technology 72
Social structures and relationships 29
Exploration and exploitation of space 0
Research financed from general university funds (GUF) 466
Other civil research 0
Non-oriented research (unclassified) 89
Total expenditure 829
Source: Forfás Survey of State Expenditure on S&T activities, 2006
The positive outputs of increased GBAORD have already been captured in the survey of R&D
performed in the higher education sector 2004. Expenditure on R&D in the higher education
sector (HERD) increased by 52% (€170 million) in 2004 over the 2002 figure. Funding for R&D in this sector can come from private sources, alongside direct and indirect funding from the
Government.
The next largest area of economic performance of State funding for Research and Development
across all sectors of performance is the €76mn directed toward the agricultural production and technology area. This is closely followed by the €72mn invested in the industrial production and technology area.
A residual €89mn of funding is unallocated to any economic category.
2.4
GBAORD as a percentage of GNP and international comparisons
The relative importance placed on R&D by the Government can be measured by GBAORD as
a percentage of economic activity (Gross National Product). Figure 10 shows strong growth in
Figure 10:
GBAORD and GBAORD as a percentage of GNP, 1996 -2006
Source: Forfás Survey of State Expenditure on S&T activities, 2006
GBAORD as a percentage of GNP has increased from 0.36% in 1996 to 0.55% in 2006. Comparing
this with an OECD average of 0.50% in 1996 and 0.56% in 2006 the differential has narrowed
considerably bringing Ireland in line with the OECD average (Table 4).
Table 4:
International comparisons of civil GBAORD (% GDP, 1996 and 2006)
Civil GBAORD/GDP
Country 1996 2006
Finland 0.93% 1.01%
France 0.75% 0.79%
Chinese Taipei not available 0.76%
Sweden 0.85% 0.73%
Korea not available 0.72%
Germany 0.79% 0.72%
Japan 0.52% 0.68%
Norway 0.73% 0.66%
EU-25 0.64% 0.65%
Italy 0.55% 0.62%
Canada 0.51% 0.57%
OECD 0.50% 0.56%
Ireland as % GNP 0.36% 0.55%
United Kingdom 0.47% 0.49%
United States 0.40% 0.43%
Source: OECD, Main Science and Technology Indicators, June 2006 and Forfás Survey of State Expenditure on S&T activities, 2006
Ireland has no R&D defence budget - unlike the US and UK where the R&D defence budgets
comprise 57% and 31% respectively of their total GBAORD. Civil GBAORD is the metric used
for international comparisons with Ireland as it eliminates the defence portion.
1996 261
0.36% 0.33% 0.30% 0.32% 0.36% 0.36% 0.40% 0.41%
0.50% 0.50% 0.55%
266
277 325
393 445
484 519
666
702
829
1997 1998 1999 2000 2001 2002 2003 2004 2005 2006
%
€
m
ill
io
n
0
100 200 300 400 500 600 700 800 900
0 1
2 3
[image:20.595.92.536.441.705.2]Figure 11:
International comparisons of civil GBAORD as a percentage of GDP
Source: OECD, Main Science and Technology Indicators, June 2006 and Forfás Survey of State Expenditure on S&T activities, 2006
2.5
Annual growth rates of civil GBAORD and international comparisons
Ireland, at 17%, ranks second out of 36 countries for the highest average annual growth
rate (AAGR) of civil GBAORD from 2001 to 2006 % as illustrated in Figure 12 below.
Figure 12:
Average annual growth rate of civil GBAORD for selected countries (2001-2006)
Source: OECD, Main Science and Technology Indicators, June 2006 and Forfás Survey of State Expenditure on S&T activities, 2006
Ireland ranks well ahead of the OECD, EU and US growth rates of 5%, 3% and 8 % respectively. (See Appendix
Table 3 for more details).
0.0 0.2 0.4 0.6 0.8 1.0
Finland
France
Chinese Taipei
Sweden
Korea
Germany
Japan
Norway
EU-25
Italy
Canada
Total OECD
Ireland as % GNP
United Kingdom
United States 0.43%
0.49% 0.55% 0.56% 0.57%
0.62% 0.65%
0.66% 0.68%
0.72% 0.72% 0.73%
0.76%
0.79% 1.01%
%
024 2.1%
2.2% 2.7%
4.4% 5.2% 5.5%
2.1% 6.8% 7.6% 7.8%
8.4%
8.6%
14.0%
16.6% 18.1%
6 8101214161820
Luxembourg Ireland Romania Spain Russian Federation Korea Slovenia United States Portugal Chinese Taipei Finland Total OECD EU-25 France Germany
[image:21.595.96.535.455.725.2]3
Performance of R&D in the Public
Sector
This chapter deals with performance of R&D in the Government sector (GoveRD). Most funding
for State performed R&D comes from the government, although a small amount does come from
private and other sources. It should be noted that GoveRD does not include the R&D performance
in the higher education sector, which is calculated in the HERD performance survey.
3.1
Total expenditure on R&D performed in the Government sector
Total expenditure allocations for research performed in the government sector (GOVERD)
amounts to €139 million in 2006. This represented a 9.4% increase in current prices compared to the previous year, and reversed the 8% drop in GoveRD between 2004 and 2005. In real terms
R&D performed in the state sector increased by 5.3% in real terms between 2005 and 2006.
In relative terms GoveRD comes in at 0.09% of Gross National Product, somewhat below
the EU and OECD averages. This reflects the smaller contribution of government spending
proportionate to the overall economy compared to other economic models e.g Scandinavia.
The recently released Strategy for Science, Technology and Innovation has also set ambitious
spending targets for State sector performed research over the coming years.
Almost two-thirds of this is performed by Teagasc and the Marine Institute (Figure 13). Teagasc
and the Marine Institute approximate spending of €50 million and €38 million on R&D in 2006. Additional and more detailed information on R&D and S&T spending programmes is contained
in the attached CD-ROM appendix to this report.
Teagasc undertakes research relating to sustainable agriculture and rural development and food
processing. The Marine Institute manage two research vessels, which form a crucial part of marine
research for seabed, fisheries and environmental surveys and a wide range of research and
[image:22.595.92.530.511.768.2]monitoring tasks in the areas of marine environment and seafood safety.
Figure 13:
Major R&D performers in the State sector, 2006
Source: Forfás Survey of State Expenditure on S&T activities, 2006
0 5 10 15 20 25 30 35 40 45 50
3.2
Performance of R&D in the Government sector as a % of GNP
Figure 14 shows the trend in GOVERD for Ireland in constant terms over the last decade. The
trend increased steadily until 2004 (€147 million) and then fell to €132 million in 2005. This was due to a cessation of R&D programmes for Media Lab Europe, and lower R&D spending in 2005
over the 2004 outturn by the Office of Public Works, the ESRI, Sustainable Energy Ireland, the
[image:23.595.93.530.194.482.2]Department of Health and Children and COFORD.
Figure 14:
GOVERD as a percentage of GNP and GOVERD trend, 1996-2006
Source: Forfás Survey of State Expenditure on S&T activities, 2006
An increase of €12 million is anticipated for 2006 bringing it back on par with the 2003 level of€139 million for R&D performed in the Government sector.
This is due to increases in spending on R&D programmes of:
€1.7 million - Bord Iascaigh Mhara for the Supporting Measures for Sea Fisheries Development
programme
€2.3 million and €1.6 million - Marine Institute for the Ocean Science Services programme and NDP support for R&D programmes respectively
€7.3 million - The Dept. of Social and Family Affairs for various R&D programmes
A survey of R&D performed in Irish hospitals was also undertaken by Forfás for the first time
in 2006. Data was available on funding of health research from GBAORD, but no data on
expenditure for R&D performed in hospitals thereby creating a gap in the national R&D
statistics. Preliminary results show that in excess of €22 million is spent on in-house R&D in hospitals in Ireland.
More significantly though there has been a drop in GOVERD as a percentage of GNP to 0.09%
from 0.12% in 2002. Although GOVERD accounts for only 8% of total Gross Expenditure on
Research and Development (GERD) the decrease has implications for the achievement of the
National Action Plan GERD target of 2.5% by 2010.
1996 88
0.12% 0.11%
0.10% 0.08% 0.11% 0.11% 0.12% 0.11% 0.11% 0.09% 0.09% 89
93 83
118 123
141 139 147 132
139
1997 1998 1999 2000 2001 2002 2003 2004 2005 2006
%
€
m
il
li
o
n
0 15 30 45 60 75 90 105 120 135 150
0.0 0.2 0.4 0.6 0.8 1.0
A target of 0.8% of GNP by 2010 was set for the public sector (HERD and GOVERD) from a base
of 0.4% in 2001. HERD as a percentage of GNP increased to 0.4% in 2004 from 0.27% in 2001
compensating for the fall in GOVERD over the period. HERD increases are expected to continue
with substantial investments from SFI, the HEA and extra funding from the Science Strategy.
Table 5 provides an international comparison of GOVERD as a percentage of GNP for 1996 and
2006. Ireland ranked 31st out of 31 countries benchmarked for this indicator in 2001 and 2006.
(See Appendix 3, Table 3 for more details).
Table 5:
GOVERD as a share of GDP*, 2001 and 2006 (or latest available data)
2001 2006
Chinese Taipei 0.51 0.60
France 0.36 0.36
Korea 0.32 0.34
Finland 0.35 0.33
Germany 0.34 0.33
United States 0.31 0.33
Japan 0.29 0.30
Total OECD 0.27 0.28
China 0.28 0.28
Norway 0.29 0.25
EU-25 0.24 0.24
Canada 0.22 0.19
United Kingdom 0.18 0.18
Italy 0.20 0.17
Spain 0.15 0.17
Belgium 0.13 0.14
Sweden 0.12 0.14
Ireland 0.11 0.10
* GNP for Ireland
Source: Forfás Survey of State Expenditure on S&T activities, 2006
3.3
Types of Research
Research can be broken down into 3 categories – basic, applied and experimental. The OECD
Frascati definitions are:
Basic Research: Experimental or theoretical work undertaken primarily to acquire new
knowledge, without any particular application or use in view.
Applied Research: Original investigation undertaken in order to acquire new knowledge,
primarily directed towards a specific practical aim or objective.
Experimental Development: Systematic work, drawing on existing knowledge gained from
research and practical experience, that is directed to producing new materials, products and
devices, to installing new processes, systems and services, or to improving substantially those
Expenditure on intramural R&D is broken out into the different types of research in Table 6.
[image:25.595.85.541.16.817.2]Applied research accounts for 82% of research performed in the Government sector.
Table 6:
GOVERD by type of research, 2006
Type of Research 2006 % of total
Basic 10 7%
Applied 114 82%
Experimental 16 11%
Total in-house research 139 100%
Source: Forfás Survey of State Expenditure on S&T activities, 2006
[image:25.595.90.534.140.249.2]3.4
Field of Science
Table 7 breaks out the research expenditure further into field of science and type of research.
Almost half of the research performed in the Government sector is in the field of agriculture
(Teagasc and Dept. of Agriculture). One-third is classified as natural sciences encompassing
research performed by the Marine Institute. Almost one-fifth is social and economic research
carried out by ESRI and the The Dept. of Social and Family Affairs.
Table 7:
Field of science classified by type of research, 2006
2006 (€m)
Fields of Science Basic Applied Experimental Total
Natural sciences 4 40 3 47
Engineering sciences 0 1 0 1
Agricultural sciences 3 54 8 65
Medical sciences 0 1 0 1
Social science and humanities 1 18 4 23
Total 10 114 16 139
[image:25.595.92.532.418.575.2]4
Personnel engaged in R&D
This chapter focuses on the human resources involved in R&D activities performed in the
Government sector. Questionnaires were sent to 41 Government departments and organisations
requesting details on gender, occupation, and PhD status for all R&D personnel. The total
headcount was requested and an estimate of time spent purely on research or full–time
equivalents (FTEs)10.
4.1
Total research personnel in the Government sector
In 2006, 1262 R&D personnel are employed in the Government sector. In terms of full time
equivalents 1147 people are employed. The occupations of R&D personnel are categorised
as follows:
1. Researchers with PhDs
2. Researchers without PhDs
3. Technicians
[image:26.595.91.534.330.615.2]4. Support Staff.
Figure 15:
Total R&D personnel by occupation in FTEs, 2006
Source: Forfás Survey of State Expenditure on S&T activities, 2006
About two-thirds of total R&D personnel in the government sector are support staff and
technicians. Researchers in full-time equivalents hold a 38% share of total R&D personnel in
2006 as shown in Figure 15. Almost two-thirds of Government sector researchers have a PhD.
Other 35%
Researchers (with PhD) 24%
Researchers (without PhD) 14%
Technicians 27%
Figure 16:
Total R&D personnel in terms of headcount and FTEs, 2003 – 2006
Sourc Forfás Survey of State Expenditure on S&T activities, 2006
Figure 16 illustrates the trend in R&D personnel employed over the last four years. In 2004 there were
1295 personnel employed in terms of headcount and this fell to 1249 in 2005. Media Lab Europe went
into liquidation in January 2005 and had employed 76 researchers which accounts for the drop in terms
of headcount and full-time equivalents in 2005. This correlates with a reduction in GOVERD over the last
few years, as salaries would constitute a significant share of total R&D expenditure. The chart also shows
that R&D personnel are spending more than 90% of their time on R&D related activities.
4.2
Researchers in the Government sector
Figure 17 shows the number of researchers employed in the Government sector declined from 588 in 2003 to
457 in 2005 due to the closure of Media Lab Europe, with an anticipated increase to 474 in 2006. Researchers
[image:27.595.95.534.528.754.2]employed in the government sector are consistently spending more than 90% of their time on research.
Figure 17:
Total Researchers, 2003 - 2006, HC and FTEs
Source: Forfás Survey of State Expenditure on S&T activities, 2006
2003 2004 2005 2006
800 1000 1200 1400 1600
Headcount Full Time Equivalents
2003 2004 2005 2006
300 400 500 600 700
4.3
Researchers categorised by gender and field of science
An estimated 474 FTE researchers will be employed in the Government sector in 2006. The ratio
[image:28.595.87.532.150.389.2]of male to female researchers is 2:1. Figure 18 illustrates their gender and qualification make up.
Figure 18:
Researchers by gender and qualification, 2006
Source: Forfás Survey of State Expenditure on S&T activities, 2006
Female researchers make up 36% of total researchers in the government sector. Ireland is
positioned 17th out of 30 countries for this indicator (see Appendix 3, Table 4 for more detail)
Almost two-thirds of Government sector researchers have a PhD. Two-thirds of male and over
half of female researchers have a PhD.
Figure 19:
Researchers classified by gender and field of science (FTE), 2006
Source: Forfás Survey of State Expenditure on S&T activities, 2006
Female Researchers 36%
Female (Non PhD) 16%
Male (PhD) 43% Male (Non PhD) 21%
Female (PhD) 20%
Male Researchers Female Researchers
16%
11%
38% 26%
4%
7%
47% 46%
3%2%
Natural Sciences
Engineering
Medical Sciences
Agricultural Sciences
[image:28.595.92.531.510.754.2]Figure 19 shows the main areas of Government sector research with a gender breakdown,
Table 8 provides more detail. Teagasc and the Marine Institute perform 80% of Government
sector research, explaining the bias towards agricultural and natural sciences.
Almost half of male and female researchers perform agricultural research (Teagasc and the
Department of Agriculture and Food). The next greatest share for both sexes is natural sciences
(Marine Institute), followed by social sciences. A greater share of males than females perform
research in the natural sciences; 38% compared with 26% respectively. 16% of female researchers
[image:29.595.92.531.230.519.2]undertake social and economic research compared with 11% of males.
Table 8:
Total researchers classified by gender and field of science
Field of Science Male % of total Female % of total
Mathematics and computer sciences 1 0% 1 1%
Physical sciences 36 13% 12 8%
Earth and related environmental sciences 63 23% 27 17%
Biological sciences 5 2% 0 0%
Electrical engineering, electronics 4 1% 1 1%
Other engineering sciences 3 1% 5 3%
Agriculture, forestry, fisheries and
allied sciences 127 46% 73 47%
Health sciences 8 3% 11 7%
Economics 26 10% 22 15%
Other social sciences 2 1% 2 1%
History 1 0% 0 0%
276 100% 154 100%
Appendix 1
Methodology
The information given in this document relates to 41 institutions in receipt of monies from
the exchequer for the performance or support of scientific, technological and related activities
in every field and is based on the information supplied by these institutions. In general,
institutions and information relating to them are listed separately. In a few cases an institution
is listed with its parent department or organisation but identified separately. Where practicable
the programmes of the various institutions have been separated and categorised in accordance
with international practice into relevant scientific and technological activities ie:
Research and development (R&D)
Technical services
Training, education and information
Technology transfer and
Other S&T activities.
However, in many instances, especially in institutions with few staff, institutions operate several
programmes jointly, sharing resources in an administratively appropriate unit. In these
circumstances the programmes, as described here, do not represent truly independent
programmes. Consequently, the data should be interpreted with caution if expansions or
contractions are being considered.
Expenditure data for specific programmes refer to the 2005 outturn costs of programmes and to
the expected costs in 2006. The outturn costs are mainly funded by matching grant-in-aid or
voted monies. Where programmes are funded in other ways these monies are noted separately.
In these instances the expenditure (cost) data shown includes both exchequer and other income
contributions.
Expenditures are based on unaudited figures, except in a few cases where they are identical
with a Vote by the Oireachtas. For convenience, general overheads, where shown, are distributed
in proportion to programme expenditures. Programmes are attributed to the institution most
directly involved, that is to those actually operating them, but not necessarily funding them.
An example of the latter is the Department of Enterprise, Trade and Employment, which funds,
but does not operate or manage any programmes. Only their own administrative costs are
attributed to the funding institutions in such cases.
Numbers of staff involved on individual S&T programmes are shown only where a reasonable
subdivision is possible. Where institutions are involved in funding a large number of external
R&D (or similar) personnel, data on these external personnel are not given.
Apportionment problems arise in the third level sector, mainly from the monies distributed by
the Higher Education Authority and the Department of Education and Science to the institutes
of technology. In the case of the HEA, total funds are first apportioned between S&T faculties
and non-S&T faculties in the colleges (expenditure on non-S&T faculties is not included in this
document). The extent and cost of the R&D work undertaken in colleges and funded out of the
HEA’s general block grant, is determined indirectly from surveys of academic staff in colleges.
These surveys are carried out by Forfás on a multi-annual basis and the corresponding cost data
are, of necessity, based on historical estimates. The HEA funding of academic departments was
Government Departments and agencies included in the 2006 Science Budget
The Science Budget records expenditure on science and technology in the government sector. This
includes
government departments
associated government agencies
government offices
Table 1 below lists the 41 government departments, agencies and offices included in the
2005/2006 science budget.
Table 1:
Government departments/agencies funding S&T activities, 2006
Departments/Offices Associated Agencies
Dept. of Agriculture & Food Teagasc
Dept of Arts, Sport and Tourism
Dept of Transport National Roads Authority
Dept. of Communications, Marine & Natural Resources Bord Iascaigh Mhara
Central & Regional Fisheries Boards
COFORD
Marine Institute
Sustainable Energy Ireland
Dept. of Community, Rural & Gaeltacht Affairs Údarás na Gaeltachta
Dept. of Education and Science Dublin Institute for Advanced Studies
HEA
Irish Research Council for Humanities and Social Sciences
Irish Research Council for Science, Engineering and Technology
Dept. of Enterprise, Trade & Employment Enterprise Ireland
FÁS
Forfás
IDA Ireland
InterTrade Ireland
National Microelectronics Application Centre
Science Foundation Ireland
Shannon Development
Dept. of Finance Economic & Social Research Institute
Dept. of Health and Children Food Safety Authority
Health Research Board
Postgraduate Medical & Dental Board
Dept. of Social and Family Affairs
Dept. of the Environment, Heritage & Local Government Environmental Protection Agency
Met Éireann
Radiological Protection Institute of Ireland
Dept. of the Taoiseach National Economic & Social Council
OFFICES Central Bank
Central Statistics Office
Office of Public Works
Ordnance Survey Ireland
State Laboratory
Appendix 2
Appendix 3
Detailed Tables
Table 2:
Average annual growth rates in civil GBAORD 2001-2006
Country AAGR Rank
Australia 2.9% 27
Austria 4.1% 20
Belgium 3.1% 26
Canada 3.4% 24
Czech Republic 6.2% 13
Denmark 3.3% 25
Finland 5.2% 18
France 2.2% 29
Germany 2.1% 30
Greece 5.7% 15
Iceland 6.3% 12
Ireland 16.6% 2
Italy 0.8% 33
Japan 3.6% 23
Korea 8.4% 6
Luxembourg 18.1% 1
Mexico 0.0% 34
Netherlands 1.9% 31
New Zealand 1.6% 32
Norway 4.1% 21
Poland -1.0% 36
Portugal 6.8% 10
Slovak Republic 5.6% 16
Spain 10.7% 4
Sweden 6.1% 14
Switzerland 6.7% 11
United Kingdom 3.9% 22
United States 7.6% 9
Total OECD 4.4% 19
EU-25 2.7% 28
Argentina 7.7% 8
Israel -0.7% 35
Romania 14.0% 3
Russian Federation 8.6% 5
Slovenia 7.8% 7
Chinese Taipei 5.5% 17
Table 3:
International comparisons of GOVERD as a percentage of GDP,
1996 and 2006
Country 2001 Rank 2006 Rank
Belgium 0.13 28 0.14 28
Canada 0.22 20 0.19 20
Czech Republic 0.29 8 0.27 12
Denmark 0.28 11 0.17 23
Finland 0.35 4 0.33 4
France 0.36 3 0.36 2
Germany 0.34 5 0.33 4
Hungary 0.24 17 0.26 13
Ireland 0.11 31 0.09 31
Italy 0.20 21 0.17 23
Japan 0.29 8 0.30 7
Korea 0.32 6 0.34 3
Luxembourg 0.15 25 0.19 20
Netherlands 0.25 16 0.26 13
Norway 0.23 19 0.25 15
Poland 0.20 21 0.23 18
Slovak Republic 0.15 25 0.16 27
Spain 0.15 25 0.17 23
Sweden 0.12 29 0.14 28
United Kingdom 0.18 23 0.18 22
United States 0.31 7 0.33 4
Total OECD 0.27 14 0.28 10
EU-25 0.24 17 0.24 16
Argentina 0.17 24 0.17 23
China 0.28 11 0.28 10
Israel 0.26 15 0.21 19
Romania 0.11 30 0.13 30
Russian Federation 0.29 8 0.29 8
Singapore 0.28 11 0.24 16
Slovenia 0.38 2 0.29 8
Table 4:
Women researchers (rses) as a percentage of total researchers in the
Government sector (headcount), 2006*
Country Female rses as a % of total rses Rank
Argentina 47.3 3
Belgium 30.1 22
Chinese Taipei 17.9 28
Czech Republic 35.0 18
Denmark 35.5 16
Finland 40.2 10
France 32.0 21
Germany 27.1 26
Greece 38.9 11
Hungary 38.6 13
Iceland 42.1 7
Ireland 35.4 17
Italy 38.7 12
Japan 12.2 29
Korea 11.6 30
Luxembourg 28.5 25
Mexico 29.9 23
Netherlands 29.2 24
Norway 35.6 15
Poland 41.1 8
Portugal 57.9 1
Romania 49.2 2
Russian Federation 45.8 4
Singapore 33.6 19
Slovak Republic 42.7 6
Slovenia 41.1 9
Spain 45.5 5
Sweden 36.4 14
Switzerland 25.5 27
United Kingdom 32.2 20
Acronyms
AAGR Average Annual Growth Rate
BERD Business expenditure on R&D
BIM Bord Iascaigh Mhara - The Irish Sea Fisheries Board
CRFB Central and Regional Fisheries Boards
COFORD National Council for Forest Research and Development
CSF Community Support Framework
CSO Central Statistics Office
DIAS Dublin Institute for Advanced Studies
EPA Environmental Protection Agency
ESRI Economic and Social Research Institute
EU European Union
FÁS Foras Áiseanna Saothair – National Training and Employment Authority
FSAI Food Safety Authority Ireland
FTE Full Time Equivalent
GBAORD Government Budget Appropriations and Outlays on R&D
GERD Gross Expenditure on R&D
GOVERD Government Expenditure on Intramural R&D
HEA Higher Education Authority
HERD Higher Education Expenditure on R&D
HC Headcount
HRB Health Research Board
IDA Industrial Development Agency
IRCHSS Irish Research Council for the Humanities and Social Sciences
IRCSET Irish Research Council for Science, Engineering and Technology
MLE Media Laboratory Europe
NMAC National Microelectronics Applications Centre
NESC National Economic and Social Council
NMRC National Microelectronics Research Centre
NRA National Roads Authority
NSAI National Standards Authority of Ireland
OPW Office of Public Works
OSI Ordnance Survey Ireland
OST Office of Science and Technology - Department of Enterprise, Trade and Employment
PGMDB Postgraduate Medical and Dental Board
R&D Research and Development
RSE Researcher
RPII Radiological Protection Institute of Ireland
S&T Science and Technology
SEI Sustainable Energy Ireland
SFI Science Foundation Ireland
Definitions
For the purpose of this survey science and technology comprises the five categories below:
1. Research and development:
Research: Original, experimental or theoretical investigations undertaken to acquire new knowledge, with or without a particular application or use in view.
Development: Systematic work drawing on existing knowledge gained from research and/or practical experience, that is directed to producing new products, processes, systems, services, varieties and breeds and to improving substantially already existing ones. Data collection conducted solely or primarily as part of the research and development (R&D) process included under "research" or "development" as appropriate.
2. Technical services:
Specialised support services of a scientific or technical nature generally provided by centralised
laboratories or facilities and can be of a routine or non-routine nature. Essentially they comprise
the technical back-up, analytical, diagnostic and data collection/processing services.
3. Training, education and information:
Training and education: Education and training of third level or equivalent students in science and technology disciplines.
Information:Provision of information via formalised scientific and technical information and documentation (STID) servicesincludes all expenditure (manpower and materials) involved in acquiring, controlling or transmitting information to users with the involvement of staff whose primary function is in formalised STID services e.g. provision of S&T information, advice, liaison, specialist advice, information analysis, libraries, publications and documentation services, translations, technical seminars and conferences. Provision of information via non-formalised STID services includes expenditure on providing know how and expertise by members of staff who, while not specifically engaged in formalised STID services, provide specialist advice, liaison, consultancy or other general information services.
4. Technology transfer:
Activities which are directed solely or primarily towards the transfer and adoption of new
technology, generally in enterprises. The horizontal transfer of technology, primarily from abroad,
but also from colleges to enterprises is included here.
5. Other S&T activities:
Activities which cannot be conveniently grouped under the above headings can be included here
e.g. grants to international organisations, policy planning units etc.
Other Definitions:
1. Public funds= Exchequer + EU funds
2. GBAORD= Government Budget Appropriations or Outlays on R&D (Public funds +
Appendix 4:
Government departments
and agencies' programmes
Forfás
Wilton Park House, Wilton Place,
Dublin 2.
Tel: 01-607 3000
Fax: 01-607 3030 Website: www.forfas.ie