NAACL-HLT 2012 Workshop on Predicting and Improving Text Readability for target reader populations (PITR 2012)., pages 40–48,
Making Readability Indices Readable
Sara Tonelli FBK, Trento, Italy
Ke Tran Manh
Charles University, Prague, CR
Emanuele Pianta FBK, Trento, Italy
Abstract
Although many approaches have been pre-sented to compute and predict readability of documents in different languages, the infor-mation provided by readability systems often fail to show in a clear and understandable way how difficult a document is and which aspects contribute to content readability. We address this issue by presenting a system that, for a given document in Italian, provides not only a list of readability indices inspired by Coh-Metrix, but also a graphical representation of the difficulty of the text compared to the three levels of Italian compulsory education, namely elementary, middle and high-school level. We believe that this kind of represen-tation makes readability assessment more in-tuitive, especially for educators who may not be familiar with readability predictions via su-pervised classification. In addition, we present the first available system for readability as-sessment of Italian inspired by Coh-Metrix.
1 Introduction
The task of readability assessment consists in quan-tifying how difficult a text is for a reader. This kind of assessment has been widely used for several pur-poses, such as evaluating the reading level of chil-dren and impaired persons and improving Web con-tent accessibility for users with low literacy level.
While indices and methodologies for readabil-ity assessment of English have been widely investi-gated, and research on English readability has been continuously progressing thanks to advances in psy-cholinguistic research and in natural language
pro-cessing, only limited efforts have been made to ex-tend current approaches to other languages. An adaptation of the basic Flesch Index (Flesch, 1946) exists for many languages, but only in few cases more sophisticated approaches have been adopted, taking into account recent studies on text cohesion, readability and simplification.
With this work, we aim at bridging the gap be-tween the standard approach to Italian readability based on the Gulpease index (following the same criteria of the Flesch Index) and the more advanced approaches to readability currently available for En-glish and based on psycholinguistic principles. In particular, we present a set of indices for Ital-ian readability covering different linguistics aspects, from the lexical to the discourse level, which are in-spired by Coh-Metrix (Graesser et al., 2004). We make this analysis available online, but we differ-entiate our service from that of Coh-Metrix1in that we provide a graphical representation of the aspects affecting readability, comparing a document with the average indices of elementary, middle and high-school level texts. This makes readability analysis really intuitive, so that a user can straightforwardly understand how difficult a document is, and see if some aspects (e.g. lexicon, syntax, discourse) affect readability more than others.
Our research goals are:i)to analyze the adequacy of the Gulpease index for discriminating between the readability levels of texts used for teaching and testing in the Italian school practice,ii)to implement an adaptation of Coh-Metrix indices for Italian,iii) to make the readability analysis available online and
1http://cohmetrix.memphis.edu
understandable to naive users.
2 Related work
The first formulas to automatically compute the dif-ficulty of a text were devised for English, starting from the Flesch Index (Flesch, 1946), followed by the Gunning Fog (Gunning, 1952), the SMOG index (McLaughlin, 1969) and the Fleisch-Kincaid (Kin-caid et al., 1975). These metrics combine factors, such as word and sentence length, that are easy to compute and that should approximate the linguistic elements that impact on readability. Similar indexes have been proposed also for other languages such as German (Bamberger and Vanecek, 1984), French (Kandel and Moles, 1958) and Spanish (Huerta, 1959).
The first readability formula for Italian, the Flesch-Vacca (Franchina and Vacca, 1986), was in-troduced in the early seventies and was based on an adaptation of the Flesch index (Flesch, 1946). How-ever, it has been widely replaced by the Gulpease index (Lucisano and Piemontese, 1988), which was introduced in the eighties by the Gruppo Universi-tario Linguistico Pedagogico (GULP) of the Univer-sity of Rome. The Gulpease index takes into account the length of a word in characters rather than in syl-lables, which proved to be more reliable for assess-ing the readability of Italian texts. The index ranges from 0 (lowest readability) to 100 (maximum read-ability).
In recent years, research on English readability has progressed toward more sophisticated models that take into account difficulty at syntactic, seman-tic and discourse level thanks to advances in psy-cholinguistic accounts of text processing (Graesser et al., 2004) and to the availability of a wide range of NPL tools (e.g. dependency and constituency parsers, anaphora resolution systems, etc.) and re-sources (e.g. WordNet). However, for many other languages current approaches for readability assess-ment still rely on few basic factors. A notable ex-ception is the Coh-Metrix-PORT tool (Scarton et al., 2009; Aluisio et al., 2010), which includes 60 read-ability measures for Brazilian Portuguese inspired by the Coh-Metrix (Graesser et al., 2004).
A different approach has been followed by the de-velopers of the DeLite system for German (Gl¨ockner
et al., 2006; von der Br¨uck et al., 2008): the tool computes a set of indices measuring the linguistic complexity of a document through deep parsing and outputs a final readability score obtained by apply-ing the k-nearest neighbor algorithm based on 3,000 ratings from 300 users.
As for Italian, the only work aimed at improving on the performance of standard readability indices has been proposed by Dell’Orletta et al. (2011), who implement a set of lexical and morpho-syntactic fea-tures to distinguish between normal and simplified newspaper articles in a binary classification task. Our work differs from their approach in that we choose a different type of corpus for a different au-dience (i.e. children with different proficiency levels vs. adults with low literacy skills or mild cognitive impairment). We also enrich their feature set in that our indices capture also semantic and discourse as-pects of a text. In this respect, we take advantage of cognitive and psycholinguistic evidence support-ing the idea behind Coh-Metrix that high textual co-herence and cohesion result in improved readability with any type of readers (Beck et al., 1984s; Cataldo and Oakhill, 2000; Linderholm et al., 2000), and that discourse connectives and spatio-temporal informa-tion in a text strongly contribute to cohesion.
3 The corpus
Our goal is to develop a system that can be used in real scenarios, for instance by teachers who want to assess if a text is understandable by children in a certain class. Therefore, we avoid collecting a cor-pus with documents showing different degrees of simplification according to a ‘controlled’ scenario. This strategy was adopted for instance by Crossley et al. (2011), who compared different readability in-dices using news texts manually simplified into ad-vanced, intermediate and beginning difficulty level. Also the experiments on readability assessment of Portuguese texts by Scarton et al. (2009) were con-ducted on a corpus of news articles manually simpli-fied by a linguist according to a natural and a strong simplification level.
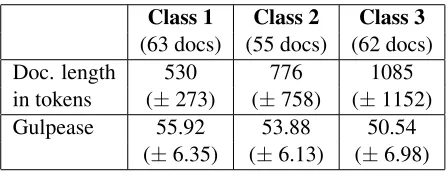
em-Class 1 Class 2 Class 3 (63 docs) (55 docs) (62 docs)
Doc. length 530 776 1085
in tokens (±273) (±758) (±1152)
Gulpease 55.92 53.88 50.54
(±6.35) (±6.13) (±6.98)
Table 1: Corpus statistics. All values are averaged. StDev is reported between parenthesis.
ployed. This means that in Class 1 we collect all documents written for children in elementary schools (aged 6-10), in Class 2 we collect texts for children in middle schools (aged 11-13), and in Class 3 we gather documents written for teenagers in high schools (aged 14-18). The classes contain respectively 63, 55 and 62 documents.
As shown in Table 1, the average length of the documents increases with the school level. How-ever, the single documents show high variability, especially those in Class 3. Texts have been se-lected so as to represent the most common genres and knowledge domains in school texts. Thus, the corpus contains a balanced selection of both narra-tive and expository texts. The latter belong mostly to the following domains: history, literature, biology, physics, chemistry, geography and philosophy. The corpus includes also all official text comprehension tests used in Italy in the INVALSI school proficiency evaluation campaign2.
4 Readability assessment based on Gulpease
We first analyze the behaviour of the Gulpease in-dex in our corpus, in order to assess if this measure is adequate for capturing the readability of the doc-uments. We compute the index by applying to each document the standard formula:
Gulpdoc= 89 +
(300∗#sentsdoc)−(10∗#charsdoc) #tokensdoc
Average Gulpease and standard deviation for each class are reported in Table 1.
2
[image:3.612.74.298.67.153.2]National Institute for the Evaluation of the Educational System by the Ministry of Research and University, http: //www.invalsi.it/invalsi/index.php
Fig. 1 shows the distribution of the Gulpease in-dex in the corpus. On thexaxis the documentidis reported, with document 1–63 belonging to Class 1 (elementary), document 64–118 to Class 2 (middle) and 119–180 to Class 3 (high school). On theyaxis, the Gulpease index is reported, ranging from 41 (i.e. the lowest readability level in the corpus) to 87 (i.e. highest readability).
[image:3.612.316.536.347.506.2]Although the highest readability score is obtained by a document of Class 1, and the lowest scores concern documents in Class 3, the three classes do not seem to be separable based solely on Gulpease. In particular, documents in Class 2, written for stu-dents in middle school, show scores partly overlap-ping with Class 1 and partly with Class 3. Further-more, the great majority of the documents in the cor-pus have a Gulpease index included between 50 and 60 and the average Gulpease does not differ consis-tently across the three classes (Table 1).
Figure 1: Distribution of Gulpease index in the corpus. Documentidonxaxis, and Gulpease onyaxis
For children in the elementary school, a text with a Gulpease index between 0 and 55 usually corre-sponds to the frustration level. For children in the middle school, the frustration level is reached with a Gulpease index between 0 and 35. For high-school students, this level is reached with Gulpease being between 0 and 10.3
3
4.1 Coh-Metrix for English
Coh-Metrix is a computational tool available on-line at http://cohmetrix.memphis.edu that can analyze an English document and produce a list of indices expressing the cohesion of the text. These indices have been devised based on psycholinguistic studies on the mental representation of textual con-tent (McNamara et al., 1996) and address various characteristics of explicit text, from lexicon to syn-tax, semantics and discourse, that contribute to the creation of this representation. Although the tool re-lies on widely used NLP techniques such as PoS tag-ging and parsing, there have been limited attempts to employ it in studies on automatic assessment of text cohesion. Nevertheless, recent works in the NLP community investigating the impact of entity grids (Barzilay and Lapata, 2008) or of discourse relations (Pitler and Nenkova, 2008) on text coherence and readability go in the same direction as research on Coh-Metrix, in that they aim at identifying the lin-guistic features that best express readability at syn-tactic, semantic and discourse level.
The indices belonging to Coh-Metrix are divided into five main classes:
• General Word and Text Information: The in-dices in this class capture the correlation be-tween brain’s processing time and word-level information. For example, many syllables in a word or many words in a sentence are likely to make a document more difficult for the brain to process it. Also, if the type/token ratio is high, the text should be more difficult because there are many unique words to be decoded.
• Syntactic Indices: The indices in this class as-sess syntactic complexity and the frequency of particular syntactic constituents in a text. The intuition behind this class is that high syntactic complexity makes a text more difficult to pro-cess, lowering its readability, because it usually implies syntactic ambiguity, structural density, high number of embedded constituents.
• Referential and Semantic Indices: These in-dices assess the negative impact on readability of cohesion gaps, which occur when the words in a sentence do not connect to other sentences in the text. They are based on coreference and
anaphoric chains as well as on semantic simi-larity between segments of the same document exploiting Latent Semantic Analysis (LSA).
• Indices for Situation Model Dimensions: The indices in this class express the degree of com-plexity of the mental model evoked by a doc-ument (Dijk and Kintsch, 1983) and involves four main dimensions: causality, intentionality, time and space.
• Standard readability indices: They comprise traditional indices for readability assessment including Flesch Reading Ease and Flesch Kin-caid Grade Level.
Although the developers of Coh-Metrix claim that the internal version of the tool includes hundreds of measures, the online demo shows only 60 of them. This is partly due to the fact that some metrics are computed using resources protected by copyright, and partly because the whole framework is still un-der development. We refer to these 60 metrics in or-der to implement the Coh-Metrix version for Italian, that we callCoease.
4.2 Coease: Coh-Metrix for Italian
In the Coh-Metrix adaptation for Italian, we follow as much as possible the description of the single in-dices reported on the official Coh-Metrix documen-tation. However, in some cases, not all implementa-tion details are given, so that we may have slightly different versions of single indices. Besides, one set of indices is based on the MRC Psycholinguis-tic Database (Wilson, 2003), a resource including around 150,000 words with concreteness ratings col-lected through psycholinguistic experiments, which is not available for Italian. In general terms, how-ever, we try to have some indices for each of the classes described in Section 4.1, in order to repre-sent all relevant aspects of text cohesion.
The list of all indices is reported in Table 2. In-dices from 1 to 6 capture some information about the length of the documents in terms of syllables, words, sentences and paragraphs. Syllables are computed using the Perl module Lingua::IT::Hyphenate4.
4
Indices from 7 to 10 focus on familiarityof con-tent words (verbs, nouns, adjectives and adverbs) measured as their frequency in a reference corpus. While in English the frequency list was the CELEX database (Baayen et al., 1995), for Italian we ex-tracted it from the dump of Italian Wikipedia5. The idea behind these indices is that unfamiliar words or technical terminology should have a low frequency in the reference corpus, which is supposed to be a general corpus representing many domains. In-dex 8 is the logarithm of raw frequency of content words, because logarithm proved to be compatible with reading time (Haberlandt and Graesser, 1985). Index 9 is obtained by computing first the lowest fre-quency score among all the content words in each sentence, and then calculating the mean. Index 10 is obtained by computing first the lowest log frequency score among all content words in each sentence, and then calculating the mean. Content words were ex-tracted by running the TextPro NLP suite for Italian (Pianta et al., 2008)6and keeping only words tagged with one of WordNet PoS, namelyv,a,nandr.
Indices 11 and 12 compute the abstractness of nouns and verbs by measuring the distance between the WordNet synset containing the lemma (most fre-quent sense) and the root. Then, the mean distance of all nouns and verbs in the text is computed. We obtain this index using MultiWordNet (Pianta et al., 2002), the Italian version of WordNet, aligned at synset level with the English one.
Indices from 13 to 17 measure thesyntactic com-plexityof sentences based on parsing output. Indices 13-15 are computed after parsing each sentence with the Italian version of Berkeley constituency-based parser (Lavelli and Corazza, 2009)7. NP incidence is the incidence of atomic NPs (i.e. not containing any other NPs) per 1000 words. Higher-level con-stituents index is the mean distance between each terminal word in the text and the parse tree root. Main verb informationneeded for computing index 16 is obtained by parsing each sentence with Malt parser for Italian (Lavelli et al., 2009) and taking the sentence root as main verb. The index accounts for
5http://it.wikipedia.org 6
TextPro achieved 95% PoS tagging accuracy at Evalita 2009 evaluation campaign for Italian tools.
7The parser achieved 84% F1 at Evalita 2011 evaluation
campaign for Italian tools.
the memory load needed by a reader to understand a sentence. Index 17 is calculated by comparing each token to a manual list of negations and computing thetotal number of negations per 1000 words.
Indices 18 and 19 are computed again using TextPro and the output of Berkeley parser. Index 18 is the ratio of words labelled aspronounsto the in-cidence of all NPs in the text. High pronoun density implies low readability, because it makes referential cohesion less explicit.
Indices from 20 to 29 capture the cohesion of sentences by taking into account different types of connectives. In order to compute them, we manu-ally create lists of connectives divided intoadditive, causal,logicalandtemporal. Then, for each list, we identify positive (i.e. extending events) and negative (i.e. ceasing to extend expected events) connectives. For instance, ‘inoltre’ (‘moreover’) is a positive ditive connective, while ‘ma’ (‘but’) is a negative ad-ditive connective. We further compute the incidence of conditional operators by comparing each token to a manual list. In order to create such lists, we stick to their English version by first translating them into Italian and then manually adding some missing con-nectives. However, this does not avoid ambiguity, since some connectives with high frequency can ap-pear in more than one list, for instance ‘e’ (‘and’), which can be both temporal and additive.
Indices 30 and 31 capture syntactic similarityof sentences and are based on the assumption that a document showing high syntactic variability is more difficult to understand. This index computes the pro-portion of intersecting nodes between two syntactic trees by looking for the largest common subtree, so that every node except terminal node has the same production rule in both trees. Index 32 calculates the proportion of adjacent sentences that share at least one argument expressed by a noun or a pro-noun, while indices 33 and 34 compute this propor-tion based on stems and content words. Stems are obtained by applying the Snowball stemmer8 to the lemmatized documents.
Indices 35–40 capture the situation model dimen-sions of the text. Causal and intentional cohesion corresponds to the ratio between causal or inten-tional particles (i.e. connectives and adverbs) and
causal or intentional verbs. The rationale behind this is that a text with many causal verbs and few causal particles is less readable because the con-nections between events is not explicitly expressed. Since no details where given on how these particles and verbs were extracted for English, we devise our own methodology. First, we produce manual lists of causal and intentional particles in Italian. As for causal verbs, we first select all synsets in the En-glish WordNet containing ‘cause to’ in their glosses, and then obtain the corresponding version in Ital-ian through MultiWordNet. Intentional verbs are obtained by first extracting all verbs from English WordNet that belong to the following categories: cognition, communication, competition, consump-tion, contact, creaconsump-tion, emoconsump-tion, motion and percep-tion, and then mapping them to the Italian corre-sponding verbs in MultiWordNet. Temporal cohe-sion is computed as the average of repetitions of tense and aspect in the document. Repetitions are calculated by mapping the output of TextPro mor-phological analysis of verbs to the labels considered for tense, i.e. past, present and future, and for as-pect, i.e. static, completed and in progress. Spa-tial cohesion reflects the extent to which the sen-tences are related by spatial particles or relations, and corresponds to the mean of location and mo-tion ratio score. Locamo-tion score is the incidence of locative prepositions (LSP) divided by LPS plus the incidence of location nouns. Location nouns are ob-tained from WordNet and from the Entity Recog-nizer of TextPro. Motion score is the incidence of motion particles (MSP) divided by MSP plus the in-cidence of motion verbs. Motion verbs information is extracted from WordNet as well. As for motion and locative particles, we first create a manual list, which however contains particles that can express both location and motion (for instance ‘in’). The dis-tinction between the two types of particles is based on the dependency structure of each sentence: if the particle is headed by a motion verb and dominates a location noun, then we assume that it is a motion particle. Instead, if it heads a location noun but is not dominated by a motion verb, then it is a locative particle. We are aware of the fact that this selection process is quite coarse-grained and can be biased by wrong dependency structures, ambiguity of nouns and verbs and limited extension of Italian WordNet.
However, it is a viable solution to approximate the information conveyed by the corresponding indices in English, given that no clear explanation for their implementation is given.
4.3 Additional indices
We implement also three additional indices that are not part of Coh-Metrix for English. They are re-ported in Table 2 with the ID 41–46.
Indices 41 and 42 are based on the Basic Ital-ian Vocabulary (de Mauro, 2000). This resource includes a list of 7,000 words, which were manu-ally classified as highly familiar to native speakers of Italian. We introduce these indices because past ex-periments on Italian readability by Dell’Orletta et al. (2011) showed that, by combining this information with some basic features such as word and sentence length, it was possible to achieve 0.95 accuracy in a binary classification task aimed at distinguishing standard newspaper articles from simplified articles for L2 readers. Index 41 corresponds to the percent-age of tokens whose base form is listed in the Basic Italian Vocabulary, while index 42 is the percentage of (unique) lemmas. The latter is the same feature implemented by Dell’Orletta et al. (2011).
Index 43 is Gulpease, computed following the for-mula reported in Section 4. We add it to our in-dex list in line with Coh-Metrix, which includes also standard readability metrics such as Flesch-Reading Ease and Flesch-Kincaid.
5 The Online System
The Coease indices have been made available online through a Web interface at http:// readability.fbk.eu. This allows users to copy and paste a document in the text field and to compute all available indices, similar to the func-tionalities of the English Coh-Metrix tool. We have normalized each index so that it is comprised be-tween -1 and +1 using the scaling function available in LIBSVM (Chang and Lin, 2011). Low scores ex-press low readability for the given index while high scores correspond to highly readable texts.
(2008). The ten most correlated indices are marked with (*) in Table 2. It is interesting to note that 6 out of 10 indices are not part of the standard Coh-Metrix framework, and account for lexical informa-tion. In all cases, correlation is moderate, being 0.3≤r≤0.6.
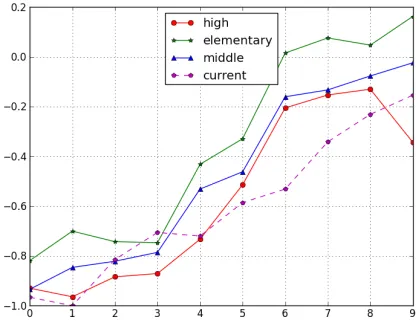
Figure 2: Graphical representation of readability as plot-ted by theCoeaseweb interface. Indexidonxaxis, and normalized value onyaxis
Coease is designed in order to enable users to compute readability of a given document and com-pare it with the average values for the three classes in our reference corpus (Section 3). Therefore, the av-erage normalized score of each index for each class has been computed based on the corpus. Then, every time a new document is analyzed, the output scores are plotted together with the average scores for each of the three classes. This allows a user to compare different aspects of the current document, such as the lexicon or the syntax, with the averages of the three classes. For example, a user may discover that a document is highly complex from the lexical point of view, since its lexical indices are in line with those of high-school texts. However, its syntax may be rather simple, having syntax-based indices similar to those of elementary textbooks. This kind of compar-ison provides information that are generally not cap-tured via supervised classification. If we trained a classifier using the indices as features, we would be able to assign a new document to elementary, mid-dle or high-school level, but a naive user would not be able to understand how the single indices affect
classification. Besides, this graphical representation allows a user to identify documents that should not be classified into a specific class, because its indices fall into different classes. Furthermore, we can de-tect documents with different degrees of readability within each class.
As an example, we report in Fig. 2 the graphical representation returned by the system after analyz-ing an article taken from ‘Due Parole’9 (labeled as ‘current’), an online newspaper for adult L2 learn-ers. The scores are compared with the average val-ues of the 10 most correlated indices, which are re-ported on thex axis in the same order as they are described in Table 2. According to the plot, the ar-ticle has a degree of readability similar to the ‘high-school’ class, although some indices show that its readability is higher (see for instance the index n. 9, i.e. lexical overlap with Class 3 documents).
The current system version returns only the 10 most correlated indices for the sake of clarity. How-ever, it easy configurable in order to plot all indices, or just a subset selected by the user.
6 Conclusions and Future Work
We presentCoease, a system for readability assess-ment of Italian inspired by Coh-Metrix principles. This set of indices improves on Gulpease index in that it takes into account discourse coherence, syn-tactic parsing and semantic complexity in order to account for the psycholinguistic and cognitive rep-resentations involved in reading comprehension.
We makeCoeaseavailable through an online in-terface. A user can easily analyze a document and compare its readability to three difficulty levels, cor-responding to average elementary, middle and high-school readability level. The graphical representa-tion returned by the system makes this comparison straightforward, in that the indices computed for the current document are plotted together with the 10 most correlated indices inCoease.
In the future, we will analyze the reason why lex-ical indices are among the most correlated ones with the three classes. The lower impact of syntactic in-formation, for instance, could be affected by parsing performance. However, this could depend also on how syntactic indices are computed in Coh-Metrix:
we will investigate whether alternative ways to cal-culate the indices may be more appropriate for Ital-ian texts.
In addition, we plan to use the indices as features for predicting the readability of unseen texts. In a classification setting, it will be interesting to see if the 10 best indices mentioned in the previous sec-tions are also the most predictive features, given that some information may become redundant (for in-stance, the Gulpease index).
Acknowledgments
The work described in this paper has been partially funded by the European Commission under the con-tract number FP7-ICT-2009-5, Terence project.
References
Sandra Aluisio, Lucia Specia, Caroline Gasperin, and Carolina Scarton. 2010. Readability assessment for text simplification. In Proceedings of the NAACL HLT 2010 Fifth Workshop on Innovative Use of NLP for Building Educational Applications, pages 1–9, Stroudsburg, PA, USA.
R. H. Baayen, R. Piepenbrock, and L. Gulikers. 1995. The CELEX Lexical Database (release 2). CD-ROM. Richard Bamberger and Erich Vanecek. 1984.
Lesen-Verstehen-Lernen-Schreiben. Jugend un Volk Verlags-gesellschaft.
Regina Barzilay and Mirella Lapata. 2008. Modeling local coherence: An entity-based approach. Computa-tional Linguistics, 34:1–34, March.
I. L. Beck, M. G. McKeown, G. M. Sinatra, and J. A. Loxterman. 1984s. Revisiting social studies text from a text-processing perspective: Evidence of im-proved comprehensibility. Reading Research Quar-terly, 26:251–276.
M. G. Cataldo and J. Oakhill. 2000. Why are poor com-prehenders inefficient searchers? An investigation into the effects of text representation and spatial memory on the ability to locate information in text. Journal of Educational Psychology, 92:791–799.
Chih-Chung Chang and Chih-Jen Lin. 2011. LIBSVM: A library for support vector machines. ACM Transac-tions on Intelligent Systems and Technology, 2:27:1– 27:27. Software available at http://www.csie. ntu.edu.tw/˜cjlin/libsvm.
Scott A. Crossley, David B. Allen, and Danielle S. Mc-Namara. 2011. Text readability and intuitive simplifi-cation: A comparison of readability formula. Reading in a Foreign Language, 23(1):84–101.
Tullio de Mauro. 2000. Il Dizionario della Lingua Ital-iana. Paravia, Torino, Italy.
Felice Dell’Orletta, Simonetta Montemagni, and Giu-lia Venturi. 2011. READ–IT: Assessing Readability of Italian Texts with a View to Text Simplification. In Proceedings of the Second Workshop on Speech and Language Processing for Assistive Technologies, pages 73–83, Edinburgh, Scotland, UK, July. Associa-tion for ComputaAssocia-tional Linguistics.
T. A. Van Dijk and W. Kintsch. 1983. Strategies of dis-course comprehension. Academic Press, New York, US.
Rudolf Flesch. 1946.The Art of plain talk. Harper. V. Franchina and R. Vacca. 1986. Adaptation of Flesch
readability index on a bilingual text written by the same author both in Italian and English languages.
Linguaggi, 3:47–49.
Ingo Gl¨ockner, Sven Hartrumpf, Hermann Helbig, Jo-hannes Leveling, and Rainer Osswald. 2006. An ar-chitecture for rating and controlling text readability. In
Proceedings of KONVENS 2006, pages 32–35, Kon-stanz, Germany, October.
A. Graesser, D. McNamara, M. Louwerse, and Z. Cai. 2004. Coh-Metrix: Analysis of text on cohesion and language.Behavioral Research Methods, Instruments, and Computers, 36:193–202.
Robert Gunning. 1952. The technique of clear writing. McGraw-Hill.
Karl F. Haberlandt and Arthur C. Graesser. 1985. Com-ponent processes in text comprehension and some of their interactions. Journal of Experimental Psychol-ogy, 114(3):357–374.
F. Huerta. 1959. Medida sencillas de lecturabilidad.
Consigna, 214:29–32.
L. Kandel and A. Moles. 1958. Application de l’Indice de Flesch `a la langue franc¸aise. Cahiers d’Etudes de Radio-Television, pages 253–274.
J.P. Kincaid, R.P. Fishburne, R.L. Rogers, and B.S. Chissom. 1975. Derivation of New Readability For-mulas for Navy Enlisted Personnel. Research Branch Report.
Alberto Lavelli and Anna Corazza. 2009. The Berkeley Parser at EVALITA 2009 Constituency Parsing Task. InProceedings of EVALITA Evaluation Campaign. A. Lavelli, J. Hall, J. Nilsson, and J. Nivre. 2009.
MaltParser at the EVALITA 2009 Dependency Parsing Task. In Proceedings of EVALITA Evaluation Cam-paign.
Pietro Lucisano and Maria Emanuela Piemontese. 1988. Gulpease. Una formula per la predizione della diffi-colt`a dei testi in lingua italiana. Scuola e Citt`a, 3:57– 68.
G. H. McLaughlin. 1969. SMOG grading: A new read-ability formula. Journal of Reading, 12(8):639–646. D.S. McNamara, E. Kintsch, N.B. Songer, and
W. Kintsch. 1996. Are good texts always better? Text coherence, background knowledge, and levels of un-derstanding in learning from text. Cognition and In-struction, pages 1–43.
Emanuele Pianta, Luisa Bentivogli, and Christian Gi-rardi. 2002. MultiWordNet: developing an aligned multilingual database. In First International Confer-ence on Global WordNet, pages 292–302, Mysore, In-dia.
Emanuele Pianta, Christian Girardi, and Roberto Zanoli. 2008. The TextPro tool suite. InProc. of the 6th Lan-guage Resources and Evaluation Conference (LREC), Marrakech, Morocco.
Emily Pitler and Ani Nenkova. 2008. Revisiting Read-ability: A Unified Framework for Predicting Text Quality. In Proceedings of the 2008 Conference on Empirical Methods in Natural Language Processing, pages 186–195, Honolulu.
Caroline E. Scarton, Daniel M. Almeida, and Sandra M. Alu´ısio. 2009. An´alise da Inteligibilidade de tex-tos via ferramentas de Processamento de L´ıngua Natu-ral: adaptando as m´etricas do Coh-Metrix para o Por-tuguˆes. In Proceedings of STIL-2009, S˜ao Carlos, Brazil.
Tim von der Br¨uck, Sven Hartrumpf, and Hermann Hel-big. 2008. A Readability Checker with Super-vised Learning using Deep Architecture. Informatica, 32:429–435.
Michael Wilson. 2003. MRC Psycholinguistic Database: Machine Usable Dictionary, Version 2.00.
Rutherford Appleton Laboratory, Oxfordshire, Eng-land.
ID Feature list
General word and text information
Basic Count
1-3 N. of words, sents and parag. in text 4 Mean n. of syllables per content word* 5 Mean n. of words per sentence 6 Mean n. of sentences per paragraph
Frequencies
7 Raw frequency of content words 8 Log of raw frequency of content words 9 Min raw frequency of content words 10 Log min raw frequency of content words
Hypernymy
11 Mean hypernym value of nouns 12 Mean hypernym value of verbs
Syntactic indices
Constituents information
13 Noun phrase incidence
14 Mean n. of modifiers per NP 15 Higher level constituents 16 Mean n. of words before main verb
17 Negation incidence
Pronouns, Types, Tokens
18 Pronoun ratio
19 Type-token ratio
Connectives
20 Incidence of all connectives 21-22 Incidence of pos./neg. additive conn. 23-24 Incidence of pos./neg. temporal conn. 25-26 Incidence of pos./neg. causal conn. 27-28 Incidence of pos./neg.* logical conn. 29 Incidence of conditional operators
Syntactic similarity
30 Tree intersection between adj. sentences 31 Tree intersection between all sentences
Referential and Semantic Indices
Coreference
32 Adjacent argument overlap*
33 Stem overlap between adjacent sentences 34 Content word overlap between adj. sents.
Situation model dimensions
35-36 Causal content and cohesion 37-38 Intentional content and cohesion* 39-40 Temporal and spatial cohesion
Features not included in Coh-Metrix
41 Lemma overlap with VBI (token-based)* 42 Lemma overlap with VBI (type-based)*
43 Gulpease index*
[image:9.612.319.535.66.716.2]44 Lexical overlap with Class 1* 45 Lexical overlap with Class 2* 46 Lexical overlap with Class 3*