ORIGINAL RESEARCH
ADULT BRAIN
A Semiautomatic Method for Multiple Sclerosis Lesion
Segmentation on Dual-Echo MR Imaging: Application in a
Multicenter Context
X L. Storelli,X E. Pagani, XM.A. Rocca, XM.A. Horsfield, XA. Gallo, XA. Bisecco, XM. Battaglini, X N. De Stefano, XH. Vrenken, XD.L. Thomas, XL. Mancini, XS. Ropele, X C. Enzinger, XP. Preziosa, and XM. Filippi
ABSTRACT
BACKGROUND AND PURPOSE: The automatic segmentation of MS lesions could reduce time required for image processing together with inter- and intraoperator variability for research and clinical trials. A multicenter validation of a proposed semiautomatic method for hyperintense MS lesion segmentation on dual-echo MR imaging is presented.
MATERIALS AND METHODS: The classification technique used is based on a region-growing approach starting from manual lesion identification by an expert observer with a final segmentation-refinement step. The method was validated in a cohort of 52 patients with relapsing-remitting MS, with dual-echo images acquired in 6 different European centers.
RESULTS:We found a mathematic expression that made the optimization of the method independent of the need for a training dataset. The automatic segmentation was in good agreement with the manual segmentation (dice similarity coefficient⫽0.62 and root mean square error⫽2 mL). Assessment of the segmentation errors showed no significant differences in algorithm performance between the different MR scanner manufacturers (P⬎.05).
CONCLUSIONS: The method proved to be robust, and no center-specific training of the algorithm was required, offering the possibility for application in a clinical setting. Adoption of the method should lead to improved reliability and less operator time required for image analysis in research and clinical trials in MS.
ABBREVIATIONS:DE⫽dual-echo; PD⫽proton density
A
ssessment of the disease burden using MR images from pa-tients with MS, for research and clinical trials, requires quan-tification of the volume of hyperintense lesions on T2-weighted images.1However, lesion segmentation remains challenging, and the required accuracy and reproducibility are difficult to achieve. Ideally, segmentation should be automated or require minimum operator input to minimize the operator timere-quired and reduce bias2-4; however, manual segmentation is still the “gold standard.”
Though several methods for fully automated MS lesion seg-mentation have been published, their performances are difficult to compare. This is because they are usually validated without a common framework,5 and even if validated within the same framework (such as the MS lesion segmentation challenge pre-sented at the International Conference on Medical Image Com-puting and Computer Assisted Intervention [MICCAI] 20086), the validation is done by using a small dataset of cases and does not include a dual-echo (DE) proton-density (PD)/T2-weighted image dataset. In addition, most methods are optimized and tested on FLAIR MR images that benefit from CSF signal suppres-sion and better contrast between focal lesuppres-sions and the surround-ing tissue7-9compared with the more established techniques that use DE sequences. Large datasets of DE MR images from past
Received March 16, 2016; accepted after revision May 11.
From the Neuroimaging Research Unit (L.S., E.P., M.A.R., P.P., M.F.), and Institute of Experimental Neurology, Division of Neuroscience, Department of Neurol-ogy (M.A.R., P.P., M.F.), San Raffaele Scientific Institute, Vita-Salute San Raffaele University, Milan, Italy; Xinapse Systems (M.A.H.), Colchester, United Kingdom; MRI Center “SUN-FISM” and Institute of Diagnosis and Care “Hermitage-Capo-dimonte” (A.G., A.B.), and I Division of Neurology, Department of Medical, Sur-gical, NeuroloSur-gical, Metabolic and Aging Sciences (A.G., A.B.), Second Univer-sity of Naples, Naples, Italy; Department of Neurological and Behavioral Sciences (M.B., N.D.S.), University of Siena, Italy; Department of Radiology and Nuclear Medicine, MS Centre Amsterdam (H.V.), VU Medical Centre, Amster-dam, the Netherlands; Neuroradiological Academic Unit (D.L.T., L.M.), UCL In-stitute of Neurology, London, United Kingdom; and Department of Neurology (S.R., C.E.) and Clinical Division of Neuroradiology, Vascular and Interventional Radiology, Department of Radiology (C.E.), Medical University of Graz, Austria. This study was partially supported by Fondazione Italiana Sclerosi Multiple (FISM2013/S/1). D.L.T. is supported by the UCL Leonard Wolfson Experimental Neurology Centre (grant PR/ylr/18575).
Please address correspondence to Massimo Filippi, MD, Neuroimaging Research Unit, Institute of Experimental Neurology, Division of Neuroscience, San Raffaele Scientific Institute, Vita-Salute San Raffaele University, Via Olgettina, 60, 20132 Milan, Italy; e-mail: fi[email protected]
Indicates article with supplemental on-line appendix and tables.
studies are available, and their acquisition is still common for both research and clinical trials, so there is still the need to develop methods for lesion segmentation on these data.10
We have previously proposed a semiautomated method based on a region-growing approach for MS lesion segmentation on DE MR images that results in a considerable reduction in the time required for lesion segmentation compared with manual segmen-tation and shows good agreement with the ground truth.11
Most large MR imaging studies of MS involve multiple scan-ning centers with different scanner manufacturers.12Though all centers would use a common scanning protocol with pulse se-quence parameters restricted within certain ranges, there are in-evitable differences in image contrast because of hardware and software differences. The aim of the current study was to analyze the training procedure required by the algorithm and to validate the lesion-segmentation method proposed in a multicenter con-text. The method was validated by comparing the lesion segmen-tations (obtained using the proposed method) with manual seg-mentations across different MR scanner manufacturers.
MATERIALS AND METHODS
BackgroundThe method was presented at the BrainLes MICCAI workshop 201511and validated for a single acquisition center on 20 patients. The On-line Appendix provides the methodologic framework of the lesion-segmentation technique.
MR Imaging Acquisition
The dataset consisted of 52 patients with MS, part of a project on imaging correlates of cognitive impairment in MS, acquired in 6 European centers that are part of the MAGNIMS consortium (Amsterdam, Graz, London, Milan, Naples, and Siena) by using 3T MR imaging scanners from a range of manufacturers (2 scan-ners from Philips Healthcare [Best, the Netherlands], 2 from GE Healthcare [Milwaukee, Wisconsin], and 2 from Siemens [Erlan-gen, Germany]). To be included, patients had to be aged between 20 and 65 years and have a diagnosis of relapsing-remitting MS,13 no relapse or corticosteroid treatment within the month before scanning, and no history of psychiatric conditions (On-line Table 1). Only MR imaging sequences without visually relevant artifacts were selected for the current analysis.
The research protocol was approved by the local ethics review boards of participating centers, and all patients gave written in-formed consent.
A similar MR imaging acquisition protocol was used for all patients: DE TSE; TR⫽4000 –5380 ms; TE1⫽10 –23 ms; TE2⫽
90 –102 ms; echo-train length⫽5–11; 44 contiguous, 3-mm-thick axial sections, parallel to the anterior/posterior commissure plane; matrix size⫽256⫻256; rectangular field of view⫽75%; and field of view⫽250⫻250 mm2.
The characteristics of MR hardware and number of patients acquired at each center are summarized in On-line Table 2.
Analysis of the Training Procedure
The use of different scanners could cause hardware-dependent differences in image quality. In this study, we assumed that pa-tients scanned with the same radiofrequency coils and MR
imag-ing protocol on different scanners from the same manufacturer would have comparable image quality and, therefore, could be grouped together for the analysis.
Manual identification of lesions was used to initialize the al-gorithm, and manual segmentation was used for the training and validation of the proposed method. Both tasks were performed with software for medical image analysis (Jim Version 6.0; Xi-napse Systems, Colchester, United Kingdom). Manual identifica-tion and segmentaidentifica-tion of lesions was performed by an experi-enced rater with 7 years’ experience in MS lesion segmentation. In the case of doubt in lesion identification, a senior rater was consulted.
For image standardization (step 1), a group of 12 patients (2 from each center) with a low lesion load was selected. A high lesion load was avoided because a high number of hyperintense lesions could relevantly alter the shape of the image intensity his-tograms and affect the estimation of the standard parameters. For computation of the standard parameters, scans from healthy pa-tients would be preferable, but these are not always available in a clinical environment.
Because the method required a training step, the selection of a reliable set representative of the entire dataset, in terms of lesion load and sample size for each MR manufacturer, was investigated. Patients were grouped by scanner manufacturer. A threshold function (step 3) was calculated for each group and steadily de-creased the number of patients included in the training set. First, all patients were included, and then at each step, 3 patients were removed from each group. The choice of which patients to re-move was made by attempting to maintain a balanced lesion load (ie, a variation within⫾10%) across the 3 different MR manufac-turers. This analysis was performed to assess the relationship be-tween the sample size and the threshold function for each MR scanner manufacturer to lead to a proper selection of the training set for this method. A straight line was fitted to the seed intensity values plotted against the optimal threshold values, obtaining the threshold function for the initial region growing. The linear rela-tionship between the normalized seed intensity and the optimal threshold values was empirically obtained.
To evaluate the sensitivity of the segmentation results to the slope of the threshold function, 17 simulated threshold functions were generated to initialize the region growing. These functions consisted of a straight line passing from a common point (de-scribed in detail in the Results) with a slope varying from 0.1 to 0.9 in steps of 0.05 (a wider range of values than that found in the training). Lesion segmentation was performed without the refine-ment step to evaluate only the effect of a different slope on the results.
The optimal threshold function was selected from the simu-lated ones by maximizing the dice similarity coefficient between the manually and automatically outlined lesions (as described below).
Moreover, we investigated whether the 2 parameters identify-ing the optimal trainidentify-ing straight line could be estimated directly from the image to be segmented, thus avoiding the need of a training procedure implying the acquisition of an extra group of patients and the manual lesion segmentation.
could be avoided (see Results), the entire dataset could be used as a test dataset, and the optimized procedure was applied to the whole group of patients.
Statistical Analysis
The root mean square error in lesion volume for the proposed method relative to the manual segmentation was computed. The root mean square error values, grouped by scanner manufacturer, were compared to evaluate any performance differences between MR manufacturers. It was assumed that the observations from the 3 manufacturer groups were independent of each other. The Wil-coxon-Mann-Whitney test was used to test for differences in er-rors between the groups. This is a nonparametric test of the null hypothesis (that 2 independent samples come from the same pop-ulation) against an alternative hypothesis. The test was performed pair-wise between the 3 groups: test 1 was performed between the lesion-segmentation errors on the images acquired on Siemens scanners compared with Philips scanners; test 2 was between Sie-mens scanners and GE scanners; test 3 was between GE scanners and Philips scanners. The segmentations produced by the pro-posed method were compared with manual segmentations per-formed by an expert physician by using the dice similarity coeffi-cient. Dice similarity coefficient values range from 0 to 1, where 0 corresponds to no overlap between the 2 segmentations and 1 corresponds to perfect overlap. The positive fraction, false-negative fraction, and true-positive fraction were computed for each lesion to indicate the percentage of voxels correctly or incor-rectly classified as lesion by the method. The “ground truth” for assessing the true- and false-positive rates was the binary lesion mask obtained after manual segmentation, comparing individual lesions pixel-by-pixel between the manual and automatic mask.
RESULTS
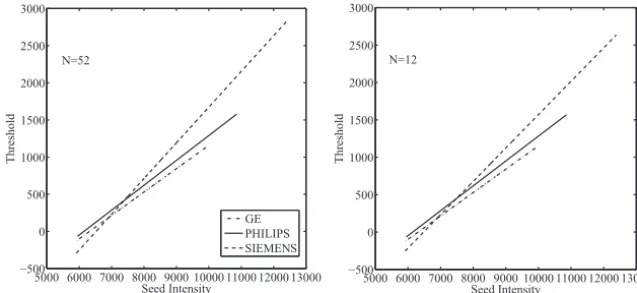
The threshold functions (plots of threshold value against seed intensity) showed a similar trend with decreasing of the number of patients included in the training set: as the sample size de-creased, the fitted lines maintained a similar slope and passed through an approximately similar point (Fig 1). The seed intensity at this “common point” was found to be the intensity of the GM peak on the standardized histogram. This is because the image
standardization process fixed the GM peak for the PD-weighted images to the same intensity value. Thus, this value as seed point would produce similar thresholds during the training and after the fitting operation on the training set these points were interpolated, produc-ing a sproduc-ingle “common point” between the functions. Furthermore, on the y-axis, this point represents the intensity variation on the GM standard intensity distribution that discriminates the le-sion intensity values, which mostly over-lap with GM intensity values, from the surrounding tissue (WM).
The effect of a different slope of the threshold functions on the segmenta-tion results was evaluated. The slope of the threshold function was varied between 0.1 and 0.9, and higher dice similarity coefficient scores were found (dice similar-ity coefficient⬎0.6) at higher values of slope (⬎0.7), though this improvement was not significant.
From those findings, the thresholds used in initial seed grow-ing were expressed as:
T⫽m⫻(Iseedi⫺IGM)⫹GM,
whereTis the threshold for the region growing,mstands for slope (fixed to 0.9),Iseediis the seed intensity value for lesioni; andIGM
andGMwere the intensity of the GM peak and the standard
deviation of the GM distribution on the standard histogram, re-spectively. The equation was used to compute the threshold func-tion, and then the method was performed without training on manual segmentation.
Comparison of data between the different scanners showed that there was no evidence that lesion-segmentation errors came from different distributions. The mean values of segmentation errors for each MR manufacturer were 1.99 mL for GE, 1.59 mL for Philips, and 1.86 mL for Siemens. The statistical test per-formed between the groups revealed no differences of segmenta-tion performance between manufacturers (Test 1,P⫽.65; Test 2, P⫽.44; and Test 3,P⫽.30).
The validation metrics were extracted for the lesion load of each patient, considering each lesion as a connected region in 3D space for the computation of its total volume.Fig 2graphically reports the metrics evaluated for each patient over all lesions. The following were obtained after averaging the metrics over all pa-tients: dice similarity coefficient⫽0.62; root mean square error⫽ 2 mL; true-positive fraction⫽0.76; false-positive fraction⫽0.36; and false-negative fraction⫽0.22.
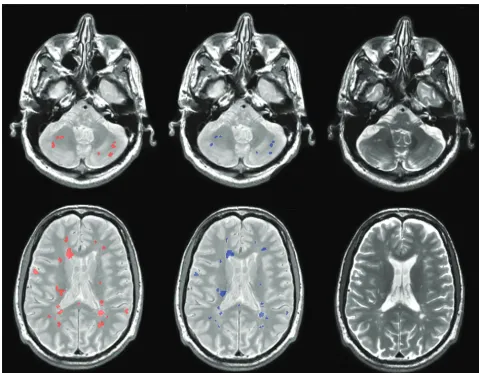
An example lesion-segmentation result is shown inFig 3.
DISCUSSION
Because manual segmentation is time-consuming and subject to inter- and intraobserver variability, automatic segmentation of MS lesions is an active research field with many proposals pre-sented in recent years.5The method validated in this study has several advantages. First, it works on DE MR images. Most
pro-5000 6000 7000 8000 9000 10000 11000 12000 13000 −500
0 500 1000 1500 2000 2500 3000
Seed Intensity
Threshold
GE PHILIPS SIEMENS
5000 6000 7000 8000 9000 10000 11000 12000 13000 −500
0 500 1000 1500 2000 2500 3000
Seed Intensity
Threshold
N=52 N=12
FIG 1. Threshold functions obtained after the training step for each different scanner
[image:3.594.54.373.48.194.2]posed methods segment lesions on FLAIR sequences that benefit from suppression of the CSF signal and better contrast between focal lesions and the surrounding background.7-9,14-16However, much data have been and are currently being acquired for re-search and clinical trials by using DE PD/T2-weighted images. Thus, with use of the proposed method, it should be possible to rapidly analyze these large sets of images. Second, despite the lim-itation of the manual identification of lesions by an expert physi-cian, this initialization ensures the correct identification of all lesions and avoids the problem of the identification of entire false-positive lesions (because only possible misclassification of lesion pixels can occur). This is a common challenge for fully automatic lesion-segmentation methods, which tend to be affected by the image quality.4In the method proposed, we avoid this issue by maintaining manual identification of lesions and automating the segmentation task that is the most time-consuming operation. Some automatic lesion-segmentation tools with available code (LST, SLS, and Lesion-TOADS) expect FLAIR images as input. As a consequence, a comparison with our method would be unfair. Moreover, most proposed methods have been validated on a re-stricted number of cases and within single centers or simulated MR imaging acquisitions.5,17,18In addition, a validation of the method based on data provided by the MICCAI Grand Challenge workshop 2008 would be unfeasible because of the absence of a DE sequence in the dataset.6,19In this study, a validation of the
method against manual segmentation in a multicenter context was presented, proving that the method was robust to scanner differences and that its performance was not dependent on MR software and hardware.
During an initial assessment of the size of the training set needed, it was found that the threshold functions extracted for the initial region-growing algorithm were not noticeably affected by including fewer patients, and there were no significant differences between the threshold functions computed from each scanner manufacturer group. Moreover, using the simulated threshold functions demonstrated that once their intersection point was found, changes to the slope introduced only a small nonsignifi-cant improvement at higher values; thus, the most important fea-ture of the threshold function was the crossing point of the lines, which was a result of the standardization process.
These results allowed us to find an expression for the threshold function used in the initial region-growing part of the algorithm, thus avoiding the training step by using manual segmentation. Because the segmentation results improved when using a higher slope of the threshold function, 0.9 was selected to allow the use of higher thresholds and a less restricted region-growing segmenta-tion. This is because of the stop condition on the threshold value (see equation in the On-line Appendix): a higher threshold im-plies a higher difference between the seed point and thei-th pixel intensity value that stops the region growing, so a larger range of 5 10 15 20 25 30 35 40 45 50
0 0.1 0.2 0.3 0.4 0.5 0.6 0.7 0.8 0.9 1
Patient
DSC
5 10 15 20 25 30 35 40 45 50 0
0.1 0.2 0.3 0.4 0.5 0.6 0.7 0.8 0.9 1
Patient
TPF/FPF
TPF FPF
5 10 15 20 25 30 35 40 45 50 0
0.1 0.2 0.3 0.4 0.5 0.6 0.7 0.8 0.9 1
Patient
FNF
0 10 20 30 40 50 60 70
0 10 20 30 40 50 60 70
Manually Estimated Lesion Load [ml]
Automatic Estimated Lesion Load [ml]
FIG 2. Dice similarity coefficient values (top left), mean true-positive fraction/false-positive fraction values (top right), and mean false-negative
[image:4.594.55.529.50.383.2]intensities are classifiable as lesion (less restricted segmentation). This was made possible because we included an edge detection step in the segmentation that acts as a barrier to stop the region growing even if a too-high threshold is used. Because of noise or artifacts on the images, the 2 stop conditions were used in com-bination for a good result. However, using a high slope for the threshold function might generate a bias between lesions with higher and lower intensity values relative to the crossing point of the straight line; that is, with a high slope, lower-intensity lesions would have lower threshold values, causing a more restricted re-gion growing, whereas the opposite would be observed for higher-intensity lesions. This bias was avoided by applying a threshold refinement step, in which a more robust threshold is computed to restart the region growing, thus correcting too-restricted segmen-tation caused by lower threshold values. Hence, using our equa-tion to find the threshold funcequa-tion, we avoided the training step by using manual segmentation, making the applicability of the proposed technique easier in clinical settings. Regarding the pos-sible bias between different lesion loads, it seemed that the differ-ence between automatic and manual lesion load becomes larger with increasing lesion load (Fig 2). This could be explained by the fact that a high lesion load could be caused by many small lesions or a few but very large lesions. In the first case, a difference of a few
pixels between the automatic and manual-segmented lesion (that is visually undetectable), summed up for all lesions, could result in a relevant difference in the quantification of lesion load be-tween the 2 methods. In the second case, a difference of more pixels (for example at lesion border [again, visually undetect-able]) could result in a relevant difference in lesion-load quanti-fication between manual and automatic segmentation.
The stability and robustness of the method was assessed when working on data from different scanner manufacturers. The ini-tial step in image analysis standardizes the intensity values be-tween the PD-weighted MR imaging scans, allowing the use of fixed intensity parameters. The method was not significantly af-fected by possible hardware or software-dependent differences between MR imaging scanners.
Lesion segmentation performed with the new method showed good agreement with the ground truth (dice similarity coeffi-cient⫽0.62 and true-positive fraction⫽0.76). The difference between the lesion load estimated using the proposed method and with manual segmentation gave a mean error of 19% (root mean square error⫽2 mL), with low misclassification of lesion voxels (false-negative fraction⫽0.22 and false-positive fraction⫽0.36). The evidence of the benefit for operator time required to seg-ment lesions was demonstrated in our previous work.11In the
FIG 3. Example lesion segmentations for 2 patients (rows) from 2 different scanners by the proposed method (red) compared with the expert
[image:5.594.53.533.45.418.2]current study, the important reduction in time for the segmenta-tion task was confirmed. For the lesion loads we considered, the average time for manual lesion segmentation of a single MR im-aging scan was approximately 50 minutes for the segmentation task only, whereas for the new method, the average time for the same task was approximately 55 seconds, a reduction in time of approximately 98.2%.
In cases where lesions have intensity similar to that of CSF, the method gives segmentations that extend beyond the real bound-ary of the lesions. This happened in very few cases in this study and was mainly for periventricular lesions. It may be possible to improve this in the future by introducing further information about lesions, perhaps by using other MR tissue contrasts such as coregistered T1-weighted images. This improvement also could be useful for a more certain lesion boundary delineation in case of diffuse lesions in patients with high lesion load. Notably, the method did not encounter difficulties in segmenting subcortical/ cortical lesions. This is because of the edge-detection step using the high-pass filter; the borders of subcortical/cortical lesions were well defined with respect to the surrounding tissue, different from what happened to periventricular lesions that had intensity values similar to the CSF on DE scans.
The method implemented is based on a 2D region-growing approach because it started from initial seed points positioned in 2D. 2D implementation was chosen because images were not ac-quired by using 3D MR images; therefore, resolution along the z-axis (section thickness) is lower than the axial one. The adapta-tion of the method to a 3D approach could be a future extension when 3D MR images are available to reduce the interaction time of the expert. Similarly, the applicability of the method on differ-ent images (eg, pre- and postcontrast T1-weighted sequences) would require some modifications and retraining of the method for the new contrasts.
The algorithm relies on manual identification of lesions, which must be performed by an expert operator, and the most time-consuming task (ie, outlining each lesion) is fully auto-mated. However, it would be preferable to avoid all manual intervention to remove any operator dependence. In the fu-ture, it might be possible to fully automate T2-hyperintense lesion segmentation by using other MR imaging contrasts such as FLAIR or double inversion recovery sequences.20 Finally, the reproducibility of the method should be evaluated in lon-gitudinal studies.
CONCLUSIONS
In this study, we evaluated the performance and stability of a semiautomatic method for MS lesion segmentation by using DE data acquired from different centers with different scanners com-pared with manual segmentation by an expert physician. The method proved to be robust and stable when working on data from different scanner manufacturers. It emerged also that no center-specific training of the algorithm was required, making the method suitable for direct use on a wide range of images. Adop-tion of the method should lead to improved reliability and less operator time required for image analysis in research and clinical trials in MS.
Disclosures: Maria Assunta Rocca—RELATED:Grant: Fondazione Italiana Sclerosi Multipla (FISM2013/s/1)*;UNRELATED:Grants/Grants Pending: Italian Ministry of Health and Fondazione Italiana Sclerosi Multipla*;Payment for Lectures (including service on speakers bureaus): Biogen Idec, Novartis, Genzyme, Teva Pharmaceutical Industries. Mark A. Horsfield—UNRELATED:Employment: Xinapse Systems, Com-ments: full-time employer;Stock/Stock Options: Xinapse Systems. Nicola De Ste-fano—UNRELATED:Board Membership: Biogen Idec, Merck Serono SA, Novartis;
Consultancy: Schering, Biogen Idec, Teva Pharmaceutical Industries, Novartis, Gen-zyme, Merck;Grants/Grants Pending: Italian Association of Multiple Sclerosis,* No-vartis*;Payment for Lectures (including service on speakers bureaus): Schering,* Biogen Idec,* Teva Pharmaceutical Industries,* Novartis,* Genzyme,* Merck Serono SA.* Hugo Vrenken—UNRELATED: Grants/Grants Pending: Pfizer,* Novartis,* Merck-Serono,* Teva,* Dutch MS Research Foundation*;Payment for Lectures (in-cluding service on speakers bureaus): Novartis.* Massimo Filippi—RELATED:Grant: Fondazione Italiana Sclerosi Multipla (FISM2013/s/1)*;UNRELATED:Board Member-ship: Teva Pharmaceutical Industries;Consultancy: Biogen Idec, Novartis, and Teva Pharmaceutical Industries;Grants/Grants Pending: Biogen Idec,* Teva Pharmaceu-tical Industries,* Novartis,* Italian Ministry of Health,* Fondazione Italiana Sclerosi Multipla,* Cure PSP,* Alzheimer’s Drug Discovery Foundation (ADDF),* the Jacques and Gloria Gossweiler Foundation (Switzerland),* and ARiSLA (Fondazione Italiana di Ricerca per la SLA)*;Payment for Lectures (including service on speakers bureaus): Biogen Idec, Excemed, Novartis, and Teva Pharmaceutical Industries;Other: Springer,
Comments: editor-in-chief of theJournal of Neurology. *Money paid to the institution.
REFERENCES
1. Filippi M, Rocca MA, De Stefano N, et al.Magnetic resonance tech-niques in multiple sclerosis: the present and the future.Arch Neurol 2011;68:1514 –20CrossRef Medline
2. Johnston B, Atkins MS, Mackiewich B, et al.Segmentation of multi-ple sclerosis lesions in intensity corrected multispectral MRI.IEEE Trans Med Imaging1996;15:154 – 69CrossRef Medline
3. Sajja BR, Datta S, He R, et al.Unified approach for multiple sclerosis lesion segmentation on brain MRI.Ann Biomed Eng2006;34:142–51
CrossRef Medline
4. Van Leemput K, Maes F, Vandermeulen D, et al.Automated segmen-tation of multiple sclerosis lesions by model outlier detection.IEEE Trans Med Imaging2001;20:677– 88CrossRef Medline
5. García-Lorenzo D, Francis S, Narayanan S, et al.Review of automatic segmentation methods of multiple sclerosis white matter lesions on conventional magnetic resonance imaging.Med Image Anal2013; 17:1–18CrossRef Medline
6. Styner M, Lee J, Chin B, et al.3D segmentation in the clinic: a grand challenge II: MS lesion segmentation. MIDAS Journal 2008. http://hdl.handle.net/10380/1509
7. García-Lorenzo D, Prima S, Arnold DL, et al.Trimmed-likelihood estimation for focal lesions and tissue segmentation in multi-sequence MRI for multiple sclerosis.IEEE Trans Med Imaging2011; 30:1455– 67CrossRef Medline
8. Khayati R, Vafadust M, Towhidkhah F, et al.Fully automatic seg-mentation of multiple sclerosis lesions in brain MR FLAIR images using adaptive mixtures method and Markov random field model.
Comput Biol Med2008;38:379 –90CrossRef Medline
9. Souplet J, Lebrun C, Ayache N, et al.An automatic segmentation of T2-FLAIR multiple sclerosis lesions. MIDAS Journal 2008. http://hdl.handle.net/10380/1451
10. Erbayat Altay E, Fisher E, Jones SE, et al.Reliability of classifying multiple sclerosis disease activity using magnetic resonance imag-ing in a multiple sclerosis clinic. JAMA Neurol2013;70:338 – 44
CrossRef Medline
11. Storelli L, Pagani E, Rocca MA, et al.A semi-automatic method for segmentation of multiple sclerosis lesions on dual-echo magnetic resonance images.Lect Notes Comput Sci2016;9556:80 –90CrossRef
12. Schnack HG, van Haren NE, Hulshoff Pol HE, et al.Reliability of brain volumes from multicenter MRI acquisition: a calibration study.Hum Brain Mapp2004;22:312–20CrossRef Medline
14. Subbanna N, Precup D, Arnold D, et al.IMaGe: iterative multilevel probabilistic graphical model for detection and segmentation of multiple sclerosis lesions in brain MRI.Inf Process Med Imaging 2015;24:514 –26Medline
15. Jain S, Sima DM, Ribbens A, et al.Automatic segmentation and volumetry of multiple sclerosis brain lesions from MR images. Neu-roimage Clin2015;8:367–75CrossRef Medline
16. Mechrez R, Goldberger J, Greenspan H.Patch-based segmentation with spatial consistency: application to MS lesions in brain MRI.Int J Biomed Imaging2016;2016:7952541CrossRef Medline
17. Freifeld O, Greenspan H, Goldberg J.Multiple sclerosis lesion
detec-tion using constrained GMM and curve evoludetec-tion.Int J Biomed Im-aging2009;2009:715124CrossRef Medline
18. Galimzianova A, Pernusˇ F, Likar B, et al.Stratified mixture modeling for segmentation of white-matter lesions in brain MR images. Neu-roimage2016;124:1031– 43CrossRef Medline
19. Strumia M, Schmidt FR, Anastasopoulos C, et al.White matter MS-lesion segmentation using a geometric brain model.IEEE Trans Med Imaging2016;35:1636 – 46CrossRef Medline