Simple and Effective Solution Methodology for Transit
Network Design Problem
Mahmoud Owais
Civil Engineering Department, Assiut University, Assiut, Egypt
Ghada Moussa
Civil Engineering Department, Assiut University, Assiut, Egypt
Yousef Abbas
Civil Engineering Department, Assiut University, Assiut, Egypt
Mohamed
El-Shabrawy
Civil Engineering Department, El- Mansura
University, El - Mansura, Egypt
ABSTRACT
Transit Network Design Problem (TNDP) is the most important component in Transit planning and operation, in which the overall cost of the public transportation system highly depends on it. The main purpose of this study is to develop a simple and effective solution methodology for the TNDP, which goes beyond previous traditional sophisticated approaches. The solution methodology adopted in this research for the TNDP is based on partitioning the solution into two consecutive stages; Transit route Network Design Problem “TrNDP” stage and frequency setting stage. In the first stage; a deterministic solution for TrNDP is tackled to construct bus routes. The deterministic manner of the TrNDP solution relies on using linear and integer mathematical formulations that can be solved exactly with their standard solvers. In the second stage; bus frequencies are optimized among bus routes (obtained in stage 1) via Genetic Algorithm, for a total bus fleet size representing operator's main cost. The adopted solution methodology has been tested through Mandl’s benchmark transit network problem. The test results showed that the methodology developed in this research is able to provide and effective solution in terms of the number of constructed routes, the direct demand coverage, and the total travel time.
General Terms
Transportation engineering, optimization, transit route design, frequency setting, integer programming, genetic algorithm.
Keywords
Transportation, transportation network design problem, transit route design, frequency setting, direct demand coverage, integer programming, genetic algorithm.
1.
INTRODUCTION
With increasing traffic on roads, more mobility-related problems such as congestion, air pollution, noise pollution, and accidents are created. Public transportation is very important means to reduce traffic congestions, to improve urban environmental conditions and consequently affects people social lives. [1]. Planning, designing and management of public transportation are the key issues for offering a competitive mode that can compete with the private transportation [2]. These transportation planning, designing and management issues are addressed in the Transit Network Design Problem (TNDP) [3]. The TNDP aims to design a set of bus routes and manage their operation in an efficient manner for both users and operators [4].
TNDP is sorted as one of the most difficult problems to be solved in the field of transportation. This might be due to its
high degree of complexity. There are five main sources of complexity that often preclude finding a unique optimal solution for TNDP; Problem formulation, Non-linearity and non-convexity, Combinatorial complexity, NP-hard and Multi objective Nature of TNDP [4-7].
Over the last five decades, the TNDP has been under study for many researchers, most likely because the problem is practically important, theoretically interesting, highly complicated, and multi-disciplinary as well. Yu and Yang, used ant Colony Optimization to generate three types of bus routes to cover transit network demand, namely; skeleton, main and branch routes. Their objective function is to maximize demand coverage density. They tried to simulate ants' behaviour in searching for food to obtain best transit route network. Then, trips were assigned incrementally to transit network to reach an approximate equilibrium. Each portion was assigned to shortest path between origin and destination. After each assignment, the network travel time was updated by shortest hyper path algorithm calculating the expected waiting time and the change in the shortest hyper path [8].
Gao et al., proposed a bi – level programming model for TNDP which incorporated upper level objective function (Bus network design model) and lower objective function (transit equilibrium assignment model). Their solution approach focused on the interaction between supply side and demand side similar to continuous equilibrium network design problem. A solution algorithm based on sensitivity analysis was used for the proposed model [9].
Guan et al., developed a TNDP solution as an integer Mathematical Programming taking into account transit route configuration and transit passengers assignment simultaneously. Their model consisted of three weighted terms representing total route cost, total passenger in – vehicle time and total number of transfers. Their objective function balanced between transit route operator cost and passengers cost through the value of weighted factors. They indicated that the problem could be easily solved by standard branch and bound algorithm, since all model’s variables were integer [10].
Pattnnik et al., implemented a two-phase procedure for TNDP. First phase, a set of feasible bus routes was generated through heuristic procedure and second phase Genetic Algorithm (GA) was applied to select optimal (or near – optimal) bus routes network. Their objective was to minimize the total system cost for users and operator [11].
problems simultaneously taking into account the interaction between them, second approach is to solve route design and frequency setting by separate procedures in a sequential manner [12].
Solving TNDP in one stage usually appears as bi-level problem. It stems from the trend to balance between operator’s decision (upper level) and users reaction (lower level). Upper level would concern with route design problem and lower level would concern with frequency setting and passenger assignment problem. The model tries to take into account the interaction between supply side and demand side. Chakroborty, 2003, suggested that it is an accepted approximation to take frequency setting phase after route design to alleviate the complexity of TNDP. This trend of solution was accepted by many researches [4, 11, 13-19]. The solution methodology adopted in this research for the TNDP is based on partitioning the solution into two consecutive stages; Transit route Network Design Problem “TrNDP” stage and frequency setting of bus service problem stage. In first stage; a deterministic solution for TrNDP is tackled to construct bus routes while achieving the maximum possible direct demand coverage. In Second stage; bus frequencies are optimized among bus routes (obtained in stage 1) via Genetic Algorithm for a total bus fleet representing operator's main cost. The main objective of the route design stage is to maximize direct demand coverage without violating other parameters of design, such as maximum route length and route network directness. The main objective of frequency setting stage is to minimize user's total travel time while taking into account users' reaction to the given transit network routes.
The structure of this paper is as follows. Section 2 provides the principal concepts of proposed methodology to design transit route network. Section 3 gives a simple procedure for bus frequency setting derived from optimal strategies concept. Section 4 Mandl benchmark transit problem is used to evaluate the proposed methodology. Section 5 is the conclusion.
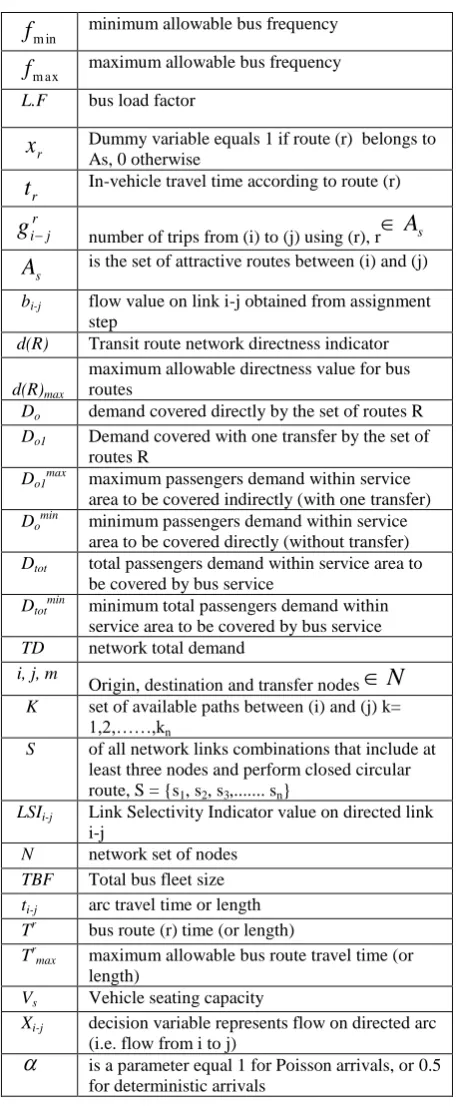
[image:2.595.320.549.66.624.2]The nominations used in the paper are presented in Table 1
Table 1. Nomenclature
j i
d
the transit demand from (i) to (j) expressed astrips per unit time
r j i
t
minimum in vehicle travel time between (i) and (j) for passengers’ demand (di-j) using route (r), r
Rs
j i
t
travel time between node (i) and node (j) through the shortest pathR R=(r1, r2,……,rn) a set of bus routes
a
C
the fixed cost on link (a) (time or length)a
X
flow on link (a) trips per unit timek j i
q
flow on path k connecting node (i) and (j)k a
j i
,
dummy variable, 1 if flow qki-j passes throughlink a, 0 otherwise
A the set of network arcs (links)
ij model decision variable equal to 1 if directed arc i-j is selected in bus route (r) under construction, 0 otherwise
f
r frequency of route (r)m in
f
minimum allowable bus frequencym ax
f
maximum allowable bus frequency L.F bus load factor
x
r Dummy variable equals 1 if route (r) belongs to As, 0 otherwise
t
r In-vehicle travel time according to route (r)r j i
g
number of trips from (i) to (j) using (r), r
A
ss
A
is the set of attractive routes between (i) and (j)bi-j flow value on link i-j obtained from assignment
step
d(R) Transit route network directness indicator d(R)max
maximum allowable directness value for bus routes
Do demand covered directly by the set of routes R
Do1 Demand covered with one transfer by the set of
routes R
Do1max maximum passengers demand within service
area to be covered indirectly (with one transfer) Domin minimum passengers demand within service
area to be covered directly (without transfer) Dtot total passengers demand within service area to
be covered by bus service
Dtotmin minimum total passengers demand within
service area to be covered by bus service TD network total demand
i, j, m
Origin, destination and transfer nodes
N
K set of available paths between (i) and (j) k=1,2,……,kn
S of all network links combinations that include at least three nodes and perform closed circular route, S = {s1, s2, s3,... sn}
LSIi-j Link Selectivity Indicator value on directed link
i-j
N network set of nodes TBF Total bus fleet size ti-j arc travel time or length
Tr bus route (r) time (or length)
Trmax maximum allowable bus route travel time (or
length)
Vs Vehicle seating capacity
Xi-j decision variable represents flow on directed arc
(i.e. flow from i to j)
is a parameter equal 1 for Poisson arrivals, or 0.5 for deterministic arrivals2.
TRANSIT ROUTE NETWORK
DESIGN PROBLEM (TrNDP)
2.1
Problem Statement
2.2
TrNDP objectives
TrNDP objectives would be stated in this simple minimization problem;
minimize ir j
N i j N
j i t
d
(1)s.t.
Do(R) ≥ Domin (2)
Do1(R) ≤ Do1max (3)
Dtot (R) = Do+ Do1 ≥ Dtotmin (4)
d(R) =
TD t t d
N i j N
s r j i
j i
j i
≤ d(R)max (5)
Tr ≤ Tr
max rR (6) (1) represents the general objective of TrNDP of minimizing total routes costs (times) for covered demand. (2-4) represent demand coverage constraints. (5) represents route directness. Route network directness (d(R)) is an indicator to measure bus routes deviation from the shortest path among main transit nodes pairs since; d(R) = 1 indicates that all bus users would take the shortest path along their travel between origin and destination. Value of d(R) which exceeds one, it would indicate the delay caused by the set of bus routes to all users. (6) represents maximum allowable bus route length.
2.3
TrNDP Solution methodology
Approach
Our primary concern in route design phase (route planning side) is to meet both operator and user common point of view (trips should be laid on the shortest path as possible). We would assign transit demand with linear model to get an approximate transit network. This assumption would be valid in case of high frequency service, in which shortest transit line is the attractive one. We wouldn't take into account users' reaction towards bus service (choice) over network routes, because user's reaction would be taken in second stage (frequency setting) after defining bus routes. Then, another linear model is developed to generate a selection criterion on links from approximate assigned transit network. Finally, integer route construction model is adopted to define transit routes to obtain final transit network.
Assignment model would be easily written as follows to get approximate transit network with passenger’s loads on links:
minimize
A a
a a
X
C
(7)s.t.
K k
k j i
q = dij i,jN (8)
a
X =
K k i N j N
k j i k a
j i q
,
aA (9)
a
X
≤ L.F ×f
m ax× Vs (10)k j i
q ≥ 0i,j,k (11)
a
X ≥ 0a (12) K represents the set of shortest paths between node pair (i) and (j), it could be obtained by using Dijkstra’s Algorithm and Yen’s K-shortest Path [20, 21]. Assignment model would be considered an effective solution for TrNDP, while all trips are being assigned to the shortest path or kth shortest path. Each link is associated with certain flow (Xa). If a directed graph is considered, links would be divided into two reversed directions. Each direction is associated with half flow value (bi-j).
In real world, bus begins from its start terminal traversing other nodes in its route (path) till it reaches its end terminal. Buses are routed in an environment to pick – up and deliver passengers demand among – what is called – Transit (O/D) locations. There are some facts; first buses go in a directed path, second the bus paths should meet high demand nodes at first, third bus passenger capacity entering any node is equal to bus passenger capacity out (whatever number of passengers are in or out).
Based on these simple facts, we would try to find one way directed system from bi-directional network, which would work together to give best possible bus routes (paths). So, in the beginning, we would take an arbitrary system of directions. Then, we would consider the flow from assigned step as flow capacity (maximum required bus passenger capacity), which shouldn't be exceeded. We would search for flow directions on network links, which maximize the overall flow of network by the following linear model;
maximize
i j j i
X (13)
s.t.
m m j i
j
i in X out
X ( ) ( ) 0 jN (14)
– bi-j ≤
X
ij≤ bi-j i,jN (15) (13) is linear programming model aims to maximize the overall flow on the network. (14) considers conservation at each network node (flow in = flow out). It should be noted that directed graph is presented at (15), that there are upper and lower bounds of the flows on the links. A negative lower bound on the links flow is permitted during optimization process. This means; if Xi-j takes a negative value, it is an opposite flow direction on that link (i.e. the direction of flow is from (j) to (i)). The resulted network is an optimized directional system with new adjusted flows on links. Theses flows would be named Link Selectivity Indicator (LSI) i.e. Xi-j= LSIi-jfor each link. For a certain link, higher value of LSI
relax the problem into the following integer programming (IP) optimization process;
maximize
N i j N
j i j i LSI
(16)
s.t.
i j
j i j i t
≤ Tr
max (17)
i m
m j j
i
jN (18)
i m m j j i
≤ 2 j N (19)
i m m f f i
=2 (20)
S = {s1, s2, s3,... sn} snN,sn 3 (21)
n n j s
s i
j i
,
sn -1 snS (22)
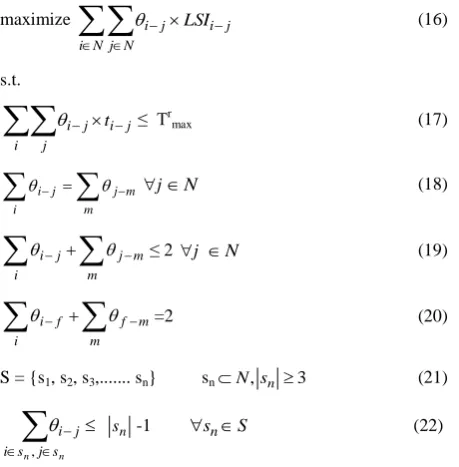
[image:4.595.54.284.98.332.2]Integer programming algorithm presented in (16) is a search tool for constructing a circular closed bus route from directed graph. (17) asserts that bus round trip travel time won’t exceed its maximum allowable time or length, (18) provides a connected bus route [22]. (19) assures that every node will be visited once at most. (20) asserts that bus route under-construction must visit node (f). Node (f) is a fictitious node connected to all network nodes with imaginary links, as depicted in Fig. 1. LSI values on these imaginary links are equal to zero. The only role for this fictitious node f is to create open bus routes.
Fig. 1: Transit network connected with a fictitious node (f)
Equation (21) defines S as the set of all network links combinations that include at least three nodes and perform closed circular route [23]. (22) prevents the possible existence of any group of circular bus routes except the one passing the fictitious node (f).
The set S may be defined as follows; 1- Apply (16-19) before adding the fictitious node to the network. 2- This would result in circular or combination of detached circular routes. 3- The resultant circular (or circulars) will be defined to the set S and be prevented by applying 22). 4- Apply again (16-19), this may result in another circular routes subset of S. 5-This process would be repeated till all S set are defined and there isn't any internal closed circular route can be formed.
(16-22) are used to construct bus routes iteratively and this gives the operator flexibility to discard any unprofitable route from the solution of TrNDP.
2.4
TrNDP solution methodology structure
The structure of the proposed solution methodology for TrNDP can be concluded in the following steps:Step1. Construct coded route network. Step2. Identify travel time (or length) on links.
Step3. Assign nodes transit trips using assignment model (7-12), reaching loaded base – network.
Step4. Assign half loaded links values and assume arbitrary directed graph arrows (N.B the algorithm adjusts the direction later in the process of reaching optimized network directions).
Step5. Optimize the loaded base – network (13-15), reaching optimized directed loaded base – network with LSI values on links.
Step6. Construct the first bus route (16-22), covering the highest LSI summation, set r = 1.
Step7. Subtract the least value of LSI on the constructed route from the route links along its path to get updated network with new LSI values.
Step8. Compute the total demand satisfied by the set of Rth routes (using -0- and -1- transfer), if that demand ≥ Dtotmin (the minimum total demand
needed to be satisfied) terminate route construction process and output the set R routes; otherwise, go step 6.
3.
FREQUENCY SETTING
3.1
Problem definition
In planning side (stage one), we proposed a deterministic solution methodology for TrNDP. It would result in a number of bus routes which satisfy some of TrNDP objectives. These routes main objective is to achieve maximum direct demand coverage for the transit network with a reasonable value of route network directness. The output routes of this stage are considered as the input for the second stage (frequency setting problem).
In the operational side (stage two), two approaches for frequency setting are found in literature namely, capacity free and capacity restraint frequency setting [24]. In this paper, we considered capacity free type (i.e. congestion wasn't taken into consideration).
The planner is interested in setting bus frequency on the network in the most precise way regarding which routes to be used and loaded, according to passengers’ interest. The problem arisen here is transit passenger assignment. It can be considered the major component in transit route frequency setting. It could be defined as the query of passenger flows on transit networks segments. Passenger assignment is a process of predicting passengers’ behavior in selecting bus routes according to route time length and bus frequency for each bus route [25].
passengers’ behavior towards a given supply of transit service [26-28].
In passenger assigning, it is necessary to identify the set of attractive routes for transit passenger for each Origin-Destination node pair, the solution of the following optimization problem will define the set of attractive routes As
[9, 29]. minimize
n r r n r r r f t x f t 1 1 (23)s.t. xr= 0 or 1 rAs
is a parameter equal 1 for Poisson arrivals, or 0.5 for deterministic arrivals
Where the objective function of (23) denotes the total expected travel time between (i) and (j). A route (r) would be considered a part of attractive routes if xr=1. The fraction of passengers (Pr) served by each route (r), considering As is the
set of attractive routes between (i) and (j), would be estimated by using frequency sharing rule [30];
Pr =
As
r r r f f (24)
To alleviate the complexity of determining optimal strategies for transit users, these assumption were made;
1.Passenger would select bus route, among subset of bus routes (attractive routes), boarding the first incoming bus from this subset.
2.Attractive bus routes set, between any node pair, would be considered bus routes within 1.10 long of the least travel time bus route.
3.Passengers arrival is deterministic (the expected waiting time equals to half headways).
4.Passenger wouldn’t transfer, if there is a direct route to his/her destination.
5.Passenger, who would transfer, predetermines a certain transfer node which is the closet possible transfer node to his/her destination node.
6.Arriving bus capacity is enough for waiting passengers. We could relax the model of frequency setting into this optimization problem minimize
s s s A r r A r r j i r N i j Nr Ar j i f t f g 5 . 0 (25) s.t. r j i
g =
s A r r r j i f fd rAs,i,jN (26)
max
min f f
f r (27)
R r r r Tf 2 ≤ TBF (28)
L.F×
j r
j i s rV g
f rR,iN (29)
(25)’s binary variables are removed due to the assumption No.2 (i.e. the attractive routes are determined before the step of frequency setting). The only decision variable in this model becomes each bus route frequency (it is assumed to be continuous using nearest integer rule). (26) splits di-jflow
among attractive routes according to each route frequency. (27) presents minimum and maximum allowable routes frequency. (28) denotes available Total Bus Fleet. (29) asserts that there is enough bus seating capacity at each origin node (i). For one transfer trips (25) would be applied twice, firstly at origin node (i) and secondly at the predetermined transfer node.
3.2
Solution Search Tool
The proposed model at (25) is a nonlinear model, which is difficult to be solved by exact methods, so we would propose Genetic Algorithm (GA) as a stochastic search tool for solving the proposed model. GA is one of the most preferable tools used in solving many transportation engineering applications due to its simple adaptation to the problem. It is used in solving many mathematical programming problems by examining a large part of search space aiming to find optimal or near optimal solution. It depends on the evolutionary theory of genetics, i.e. the next generation would be better than parents. Representing random population of individuals (feasible solution) as binary code (chromosomes) is considered the first generation for GA. Three sequential operators deal with this Generation to produce the next one, these operators namely, Selection, Reproduction and Mutation. The reproduced generation is considered an initial solution for the next generation. The process continues until defined criteria of convergence are met, GA procedure is illustrated in next Pseudo-code [31, 32].
GA Procedure Pseudo-code Create Initial Population
Calculate Fitness value (model 25) for each chromosome Rank the populationi
For k= 1 to Number_of_GA_iterations do For j= 1 to population_size/2 do
Select two parents p1, p2 using roulette wheel selection method
Generate a random number r If r < crossover_probability then
Apply crossover method over p1, p2 to generate two offsprings s1, s2
Else
Let s1 = p1 and s2 = p2 Endif
Generate a random number r2 If r2 < mutation_probability the
Apply mutation method on s1 Apply mutation method on s2 Endif
Insert s1 and s2 into the new_generation_listi
Rank the new_generation_listi
Set populationi = new_generation_listi
Endfor Endfor
4.
COMPUTATIONAL CASE STUDY
4.1
Mandl’s Benchmark transit Network
In order to demonstrate the effectiveness of the solution methodology proposed in this paper, a popular benchmark network is solved (Mandl’s Swiss transit network). Mandl’s Swiss transit network is the most popular transit network that has been utilized by many researchers as a benchmark network to compare their results with Mandl’s solution results. Mandl’s transit network consists of 15 nodes connected by 21 links with a total demand of 15570 trips [4, 7, 13-15, 17-19, 24, 33-35].4.2
Solution procedure for Mandl’s transit
network
As indicated early, the solution methodology proposed in this research for the TNDP is based on partitioning the solution into two consecutive stages: 1) Transit route Network Design Problem “TrNDP” stage and 2) Frequency setting of bus service problem.
In the first stage, TrNDP solution methodology described in section (2.4) is implemented. Equations (7-22) are mainly linear and integer programming models. Therefore, they can be solved with their standard solvers. Bus routes constructions are continued until no improvement happened in the network direct demand coverage. The output from the first stage is used as an input for the second stage. The proposed solution assumes that maximum allowable route time length is 40 min.
In the second stage, the proposed frequency setting optimization problem represented in Equations (25-29) is solved via GA, the minimum and the maximum bus frequency on each bus route are 6 and 30 bus/hr, respectively. Bus vehicle capacity is fixed at 40 seats per bus and bus load factor (L.F) 0.8 ~ 1.25. Transfer penalty is calculated by assuming five minutes as penalty for each trip hasn’t a direct route to its destination. For GA; Number of GA iterations = 200, Population size = 400, crossover probability = 0.75 and mutation probability =0.15. Solution methodology was run on a PC with Intel(R), Core (TC) I7, 2.8 GHz processor and 6 gig of RAM which take about ten minutes for one run execution. Four executions were made using total fleet sizes; 99, 87, 84 and 82.
4.3
Results and Discussions
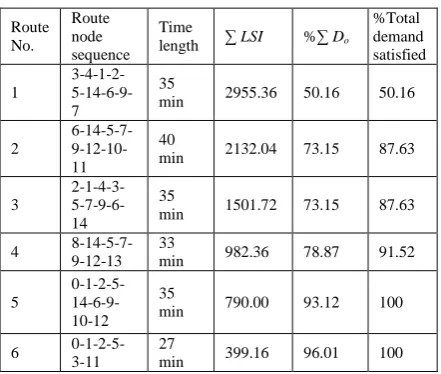
The first stage (Transit route design) resulted in six bus routes. A summary of constructed routes is presented in Table 2. For total fleet size equals to 99 buses (Mandel’s fleet size), the convergence process of GA is shown in Fig. 2.
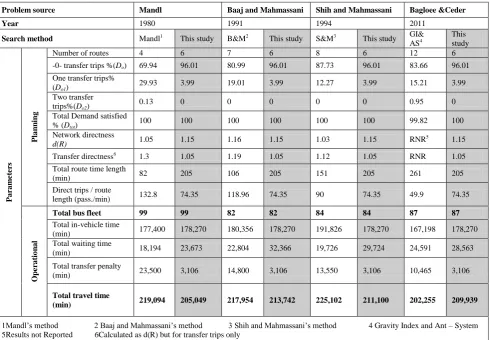
Table 3 presents a comparison between this study analysis results and highlighted previous work that tackled Mandl’s transit network in their solution as a benchmark problem. In Table 3, both planning and operational parameters, for the benchmark transit network, using the proposed solution methodology and previous work are presented. Planning parameters include: number of generated routes, percentage of transfer trips (zero-, one-, and two-transfer), percentage of total satisfied demand, network directness, transfer directness, total route length in min., and direct trips over route length in pass/min. Operational parameters consider: total in vehicle travel time in min, total waiting time in min, total transfer penalty in min, and the total travel time in min which is the summation of all of them. For the sake of fair comparisons,
operational parameters are considered at previous work fleet sizes (operator costs), as shown in Table 3.
The key indicators of good transit planning and operation are to achieve maximum direct demand coverage and a minimum total travel time while keeping good value of other network parameters. These would encourage more people to select public transport and consequently achieving one of the most important goals of transit planning and operation. For the same benchmark transit network, the proposed solution methodology provides a significantly better solution than others in terms of both planning and operational parameters, particularly in percentage of direct demand coverage and the total travel time, which make the transit network more attractive to the users, as shown in Table 2.
Moreover, the number of routes can be consider the most precise criteria -in regard with other parameters of comparison- for judging the efficiency of any search method, in the process of seeking more direct routes. Where, less number of routes reveals the methodology strength in assembling candidate links in one continuous bus route and entails – accordingly – fewer amounts of computational effort of the bus and the driver scheduling part. As shown in Table 2, the proposed solution methodology provides less number of routes than other solutions (except Mandl’s).
Furthermore, at the same fleet size (the same operator cost), the proposed solution methodology achieves the lowest total travel time in almost all cases (fleet sizes). The total travel time is a combination of in-vehicle travel time, waiting time, and transfer penalty. The proposed solution methodology reaches a reasonable in vehicle travel time, due to the good value of route network directness. Moreover, the proposed solution methodology gains the smallest transfer penalties while attained the highest waiting time for all cases (fleet sizes). This is due to the trade-off between waiting time and transfer (passengers are not willing to make transfer, if there is a direct route serving their origin destination).
[image:6.595.319.540.570.757.2]The results of proposed methodology present an efficient solution for TNDP which is attained by simple while efficient procedure. The presented solution methodology can be used as an initial solution for other meta-heuristic ones to improve the results in attempt of reaching global optima. The quality of any meta-heuristics technique depends mainly on the quality of initial solution, besides it acquires for the number of desired routes as input (which isn’t known in advance).
Table 2: Constructed routes summary
Route No.
Route node sequence
Time
length ∑ LSI %∑ Do
%Total demand satisfied
1
3-4-1-2- 5-14-6-9-7
35
min 2955.36 50.16 50.16
2
6-14-5-7- 9-12-10-11
40
min 2132.04 73.15 87.63
3
2-1-4-3- 5-7-9-6-14
35
min 1501.72 73.15 87.63
4 8-14-5-7-9-12-13 33 min 982.36 78.87 91.52
5
0-1-2-5- 14-6-9-10-12
35
min 790.00 93.12 100
6 0-1-2-5-3-11
27
Fig. 2: Convergence process of GA
Table 3: Comparison of Approaches for Mandl’s Benchmark Network problem
Problem source Mandl Baaj and Mahmassani Shih and Mahmassani Bagloee &Ceder
Year 1980 1991 1994 2011
Search method Mandl1 This study B&M2 This study S&M3 This study GI&
AS4
This study
Pa
ra
m
et
er
s
Pl
a
n
n
in
g
Number of routes 4 6 7 6 8 6 12 6 -0- transfer trips %(Do) 69.94 96.01 80.99 96.01 87.73 96.01 83.66 96.01
One transfer trips% (Do1)
29.93 3.99 19.01 3.99 12.27 3.99 15.21 3.99
Two transfer trips%(Do2)
0.13 0 0 0 0 0 0.95 0
Total Demand satisfied
% (Dtot) 100 100 100 100 100 100 99.82 100
Network directness
d(R) 1.05 1.15 1.16 1.15 1.03 1.15 RNR
5 1.15
Transfer directness6 1.3 1.05 1.19 1.05 1.12 1.05 RNR 1.05
Total route time length
(min) 82 205 106 205 151 205 261 205 Direct trips / route
length (pass./min) 132.8 74.35 118.96 74.35 90 74.35 49.9 74.35
Op
er
a
ti
o
n
a
l
Total bus fleet 99 99 82 82 84 84 87 87
Total in-vehicle time
(min) 177,400 178,270 180,356 178,270 191,826 178,270 167,198 178,270 Total waiting time
(min) 18,194 23,673 22,804 32,366 19,726 29,724 24,591 28,563 Total transfer penalty
(min) 23,500 3,106 14,800 3,106 13,550 3,106 10,465 3,106
Total travel time
(min) 219,094 205,049 217,954 213,742 225,102 211,100 202,255 209,939
[image:7.595.55.546.399.739.2]5.
CONCLUSION
Transit Network Design Problem (TNDP) differs from the ordinary network design problem. Network design problem is concerned with network improvements by adding new links or increasing capacity of existing ones. TNDP concerns with finding bus routes and frequencies over the studied network, so it consists of two sub-problems, namely; route network design and frequency setting. In this paper, the adopted approach is to solve these two problems in sequential manner. Providing transport community with simple and effective transit route design technique is the main purpose of this paper. Solution methodology depending only on linear and integer operators was presented to solve Transit route Network design problem. The proposed solution methodology goes beyond pervious traditional heuristics and Meta – heuristics (approximate) approaches. It is highly depended on demand matrix. It is generic method since it confirms to several network routes configurations. It doesn't bias towards any existing transit network. It is flexible; since planner can classify generated bus routes according to demand coverage, which enables operator to execute selected routes according to available existing resources. Frequency setting phase was conducted to evaluate the transit route network configuration in terms of operational parameters. The key indicators of good transit planning and operation are to achieve a maximum direct demand coverage and a minimum total travel time while keeping good value of other network parameters. These would encourage more people to select public transport and consequently achieving one of the most important goals of transit planning and operation.
In future work, elastic demand would be considered, in order to model the changes in the origin-destination matrix according to the supply of public transport. Further, more studies of TNDP with environmental impact would be considered in the future, since the impact of emissions on health and global warming is one of today’s hot topics.
6.
REFERENCES
[1] Cipriani, E., S. Gori, and M. Petrelli, Transit network design: A procedure and an application to a large urban area. Transportation Research Part C, 2012. 20: p. 3-14. [2] Ibeas, Á., et al., Optimizing bus stop spacing in urban
areas. Transportation Research Part E, 2010. 46: p. 446-458.
[3] Farahani, R.Z., et al., A review of urban transportation network design problems. European Journal of Operational Research, 2013. 299(2): p. 281-302. [4] Chakroborty, P., Genetic Algorithms for Optimal Urban
Transit Network Design. Computer – Aided Civil and Infrastructure Eng. Blackwell Publishing, Malden MA 02148, USA, 2003. 18: p. 184–200.
[5] Garey, M.R. and D.S. Johnson, Computers and intractability: A guide to the theory of np-completeness. W.H. Freeman, 1979: p. 5-1045.
[6] Baaj, M.H., The Transit Network Design Problem: An AI-Based Approach, in Department of Civil Engineering, University of Texas, Austin, Texas. 1990.
[7] Gan, A. and F. Zhao, Optimization of Transit Network to Minimize Transfers. Final Report, Research Office Florida Department of Transportation 605 Suwannee Street, MS 30 Tallahassee FL 32399-0450, 2003.
[8] Yu, B., et al., Transit route network design-maximizing direct and transfer demand density. Transportation Research Part C: Emerging Technologies, 2012. 22: p. 58-75.
[9] Gao, Z., H. Sun, and L. Shan, A Continuous Equilibrium Network Design Model and Algorithm for Transit Systems. Transportation Research Part B: Methodological, 2004. 38(3): p. 235-250.
[10]Guan, J.F., H. Yang, and S.C. Wirasinghe, Simultaneous optimization of transit line configuration and passenger line assignment. Transportation Research Part B, 2006. 40: p. 885–902.
[11]Pattnaik, S.B., S. Mohan, and V.M. Tom, Urban Bus Transit Route Network Design Using Genetic Algorithm. Journal of Transportation Engineering, 1998. 124(4): p. 368-375.
[12]Szeto, W.Y. and Y. Wu, A simultaneous bus route design and frequency setting problem for Tin Shui Wai, Hong Kong. European Journal of Operational Research, 2011. 209(2): p. 141-155.
[13]Mandl, C.E., Evaluation and optimization of urban public transportation networks. European Journal of Operation Research, 1980. 5(6): p. 396-404.
[14]Shih, M.-C. and H.Mahmassani, A design methodology for bus transit networks with coordinated operation, in SWUTC/94/60016-1, Center for Transportation, Bureau of Engineering Research. 1994, the University of Texas at Austin, Austin, Texas.
[15]Baaj, M.H. and H.Mahmassani, Hybrid Route Generation Heuristic Algorithm for the Design of Transit Networks. Transportation Research Part C: Emerging Technologies, 1995. 3(1): p. 31-50.
[16]Chakroborty, P., K. Deb, and R.K. Sharma, Networkwide optimal scheduling of urban transit networks using genetic algorithms. Transportation Planning and Technology, 2001. 24(3): p. 209–26. [17]Zhao, F., Large-scale transit network optimization by
minimizing transfers and user cost. Journal of Public Transportation, 2006. 9(2): p. 107–129.
[18]Fan, L. and C. Mumford, A Metaheuristic Approach to the Urban Transit Routing Problem. J Heuristics, 2008. 16: p. 353-372.
[19]Mauttonw, A. and M. Urquhart, A route set construction algorithm for the transit network design problem. Computers and Operations Research, 2009. 36(8): p. 2440-2449.
[20]Dijkstra, E.W., A Note on Two Problems in Connection with Graphs. Numeriche Mathematik, 1959. 1: p. 269-271.
[21]Yen, J.Y., Finding the K Shortest Loopless Paths in a Network. Management Science, 1971. 7(11): p. 712-716. [22]Lownes, N.E. and R.B. Machemehl, Exact and heuristic
[24]Bagloee, S. and A. Ceder, Transit-network design methodology for actual-size road networks. Transportation Research Part B: Methodological, 2011. 45(10): p. 1787-1804.
[25]Desaulniers, G. and M. Hickman, Handbook in OR & MS. Elsevier, (Chapter 2). 2007.
[26]Chriqui, C. and P.Robillard, Common Bus Lines. Hautes Eludes Commercials, Montréal, Québec, Canada, Transportation, 1975. 9(2): p. 115–121.
[27]Spiess, H., On optimal route choice strategies in transit networks. Publication 285, Centre de Recherche sur les Transports, Université de Montréal, 1983.
[28]Marguier, P. and A. Ceder, Passenger Waiting Strategies for Overlapping Bus Routes. Massachusetts Institute of Technology, Cambridge, Massachusetts, Transportation Science, 1984. 18(3): p. 207-230.
[29]Cea, J.D. and E.Fernandez, Transit assignment for congested public transport system: An equilibrium model. Transportation Science, 1993. 27(133–147).
[30]Lampkin, W. and P.D. Saalmans, The Design of Routes, Service Frequencies and Schedules for a Municipal Bus Undertaking: A Case Study. Operation Research Ouarterly, 1967. 18: p. 375-397.
[31]Holland, J.H., Adaptation in Natural and Artificial Systems. The University of Michigan Press, Ann Arbor, MI, 1975.
[32]Goldberg, D.E., Genetic Algorithm in Search, Optimization and Machine Learning. Addison Wesley, Reading, MA, 1989.
[33]Baaj, M.H. and H.Mahmassani, An AI-Based Approach for Transit Route System Planning and Design. Journal of Advance Transportation, 1991. 25(2): p. 187-210. [34]Zhao, F. and X. Zeng, Optimization of transit route
network, vehicle headways and timetables for large-scale transit networks. European Journal of Operational Research, 2008. 186: p. 841–855.