Transmission Congestion Management in Restructured
Power System using Firefly Algorithm
A. Ahamed Jeelani Basha
Assistant Professor Department of EEE Annamalai University
Tamilnadu, India
M. Anitha
Associate Professor Department of EEE Annamalai University
Tamilnadu, India
ABSTRACT
Transmission congestion management is one of the critical and important tasks of the system operator. Transmission line congestion is considered to be more important as it may initiate the cascading outages which forces the system to collapse. This paper presents a transmission congestion management (CM) algorithm by optimal rescheduling of active powers of generators using firefly (FF) algorithm. All the generators in the system need not take part in CM. Generator sensitivity to the congested line and the cost of generation are considered while rescheduling the generators to alleviate congestion. In this paper an efficient FF algorithm is used for solving CM problem. The proposed method has been tested on IEEE 30 bus system and the results of various case studies have been compared with that of RCGA & SA methods. Results prove that FF algorithm is indeed capable of obtaining higher quality solutions for the CM problem.
Keywords
Deregulation, generator sensitivities, simulated annealing, congestion management, firefly algorithm, real coded genetic algorithm.
1.
INTRODUCTION
When the producers and consumers of electric energy desire to produce and consume in amounts that would cause the transmission system to operate at or beyond one or more transfer limits, then the system is said to be congested. Congestion management is one of the fundamental transmission management problems in the deregulated power system. The undesirable effects of the congestion include prevention of new contracts, increase of the electricity cost in some regions of the electricity market, jeopardy to the system security and reliability. Congestion in a transmission system cannot be allowed beyond a short duration as there is an onset of cascading outages with uncontrolled loss of load. Hence an effective control action strategy is necessary to reduce the line overloads to the security limits in the minimum time.
Ashwani Kumar et al have given a detailed bibliographical survey of various congestion management techniques [1]. An OPF-based approach that minimizes cost of congestion and service costs is proposed in [2]. In [3], OPF based technique has been proposed for relieving congestion due to voltage instability and thermal overloads. Many OPF based techniques have been proposed in the literature with generator rescheduling and load curtailment to solve congestion management problem [4]. Ashwani Kumar et al proposed zonal congestion method based on TCDF. The generators involved in congestion have been identified for rescheduling based on active & reactive power flow sensitivity indexes [5,6]. However, it is necessary to compute the sensitivity values for all the buses in the system which in turn results in a large amount of computational effort. In [7], relative electrical
distance (RED) concept is employed to mitigate the transmission overload by real power generation rescheduling. The method minimizes the system losses and maintains good voltage profile. However, the bids of individual generating unit and the rescheduling cost is not considered in this method. Many stochastic methods have also been used in the literature to alleviate transmission line congestion. Sudipta Dutta and Singh [8] proposed a congestion management technique using optimal rescheduling of generators based on generator sensitivities and PSO is used to minimize the deviations of rescheduled generator power output. Jagabondhu Hazra and Sinha [9] proposed a cost efficient congestion management method for pool market using multi objective particle swarm optimization. Sujatha and Kamaraj employed real coded genetic algorithm (RCGA) to find the optimal generation rescheduling for relieving congestion [10]. Many researchers have employed different FACTS devices to relieve congestion in deregulated environment [11-13].
The purpose of this paper is to propose firefly algorithm for selecting the participating generators based on sensitivity factors and to find the optimum rescheduling of their outputs to alleviate congestion in a pool at minimum rescheduling cost. In this work, congestion due to different line outages, generator outage contingencies and wheeling transactions are considered. Most severe lines are identified using N-1 contingency analysis and those lines are considered for analysis. The proposed CM problem is formulated as an optimization problem with many constraints. FF algorithm used as an optimization tool as it is an efficient heuristic algorithm for search and optimization. The proposed method has been tested on IEEE 30-bus system and the effectiveness of the algorithm has been validated by comparing the results with RCGA & SA methods.
2.
PROBLEM FORMULATION
The optimal congestion management of rescheduling based on minimizing redispatch cost can be expressed as
Minimize
g N
g
d g d g i g i
g P C P
C (1) Subject to
Ng
1 g
max k o k g k
gn) P F F
GS
( (2)
l
N .... 2 , 1 k
g max g max g g min g min g
g P P P P P P
P (3)
g
N ... 2 , 1 g
0 P
Ng
1 g
g
(4)
incremental price bids submitted by generators. decremental price bids submitted by generators.
active power increment of generator g due to congestion management.
active power decrement of generator g due to congestion management.
ΔPg real power adjustment at bus g.
The incremental and decremental price bids are the prices at which the generators are willing to adjust their real power outputs. Ng represents the number of participating generators.
the power flow caused by all contracts requesting the transmission service. the line flow limit of the line-K connecting bus i and bus j. Nl is the number of transmission
lines in the system, and are the minimum and maximum limits of generator outputs.
All generators have different sensitivities to the contribution of the congested line. A change in active power flow in a transmission line k connected between buses i and j due to change in active power generation at bus-n by generator g can be defined as a active power generator sensitivity factors . Mathematically GS for line k can be written as.
g G ij k g n P P GS
(5)
The power flow equation on congested line can be written as ) sin( B v v ) cos( G v v G v
P 2 ij i j ij i j i j ij i j
1
ij (6)
Where vi and θi are voltage magnitude and phase angle of bus i respectively. Gij and Bij are conductance and susceptance of
line connected between buses i and j. Neglecting p-v coupling equation (5) can be expressed as,
g G j j ij g G i i ij k gn P P P P GS
(7)
The first terms of the two products in (7) are obtained by differentiating (6) as follows:
) cos( B v v ) sin( G v v P j i ij j i j i ij j i i
ij
(8) i ij j i ij j i j i ij j i j ij P ) cos( B v v ) sin( G v v P (9)
The active power injected at a bus-s can be represented as
S D S G s P P
P (10)
n 1 t t t s st t s st ss v (G cos( ) B sin( ))v
P =
n s t1 t t t s st t s st s ss 2s G v . (G cos( ) B sin( )).v
v (11)
Further calculation can be differentiating (11) as with respecting to s and t,
) ( cos . B ) ( sin . G .( v . v P t s st t s st t s t
s
(12) } v ). ) ( cos . B ) ( sin . G {( . v P t n s t 1 t t s st t s st s s s
(13)The relation between the incremental change in active power at each bus and phase angle of voltages can be written as.
Pn1
Hnn n1 (14)
n n 2 n 1 n n 2 2 2 1 2 n 1 2 1 1 1 n n P ... P P P ... P P P .... P P H (15)Thus [Δθ] = [H]-1. [P] (16) = [M] . [P] (17) where [M] = [H]-1
Since the bus 1 is the reference bus the first row and first column of [M] can be eliminated. Therefore the modified [M] is written as
n1n n 1
n .[ P]
] 1 M [ 0 0 0 (18)
In (18) the modified [M] represents the values of and in (7) to calculate GS values; The generators having large GS value are selected for rescheduling since their contribution to the congested line is more.
3.
FIREFLY ALGORITHM
The firefly algorithm is a meta-heuristic optimization algorithm, inspired by the flashing behavior of fireflies. It was developed by Xin-She Yang [14] at Cambridge University in 2007. The primary purpose for a firefly's flash is to act as a signal to attract other fireflies. There exist three idealized rules based on the major flashing characteristics of fireflies [15]. These are the following: (1) All fireflies are unisex, and they will move towards more attractive and brighter ones regardless their sex. (2) The degree of attractiveness of a firefly is proportional to its brightness which decreases as the distance from the other firefly increases due to the fact that the air absorbs light. If there is not a brighter or more attractive firefly than a particular one, it will then move randomly. (3) The brightness or light intensity of a firefly is determined by the value of the objective function of a given problem. For maximization problems, the light intensity is proportional to the value of the objective function.
3.1 Attractiveness
In the firefly algorithm, the form of attractiveness function β(r) of a firefly is described as a monotonically decreasing function as given by the following function:
) γr exp( β β(r) m 0
, ,
with m1(19)
Where, r is the distance between any two fireflies, β0 is the
initial attractiveness at r = 0, and is the light absorption coefficient, which controls the light intensity.
3.2 Distance
The distance between any two fireflies i and j at xi and xj,
respectively, is determined using the following equation:
d 1 k 2 j,k i,k j iij x x (x x )
r
(20) Where Xi,k is the k
th
2 j i 2 j i
ij (x x ) (y y)
r (21)
3.3 Movement
The movement of a firefly i towards a more attractive (brighter) firefly j is determined by the following equation:
) 5 . 0 α(rand ) x )(x γr ( exp β x
x j i
2 ij 0
i 1
i (22)
Where the first term is the current position of a firefly, the second term is used for considering a firefly’s attractiveness to light intensity seen by adjacent fireflies and the third term is the random movement of a firefly in case there are not any brighter ones.
4.
RESULTS AND DISCUSSION
[image:3.595.296.554.83.248.2]The performance of the proposed FF algorithm for congestion management problem has been tested on IEEE 30-bus system. The test system consists of six generator buses and 24 load buses and 41 transmission lines. The network topology and the data for the IEEE 30-bus system are found in [16]. The total real and reactive load of the system is 283.4 MW and 126.2 MVAR. Incremental and decremental price bids submitted by Generation companies (GENCOs) for congestion management are given in Table 1.
Table 1: Generator price bids
Gen No.
Gen Bus No.
Generator price Bids($/MWhr)
min g
p (MW)
max g
p (MW)
1 1 22 18 0 360.2
2 2 21 19 20 140
3 5 42 38 15 100
4 8 43 37 10 100
5 11 43 35 10 100
6 13 41 39 12 100
The FF algorithm is employed to optimally reschedule the active power of the generators for relieving congestion in the overloaded lines. FF algorithm parameters are as follows: absorption coefficient = 1.0, = 0.2, 0 = 1.0, number of fireflies are taken as 12 and 50 total generation are considered. Simulations were carried out on Intel core 2 Duo (1.8GHz) processor in MATLAB environment.
4.1
Case 1: Line outage
From the literature, it is found that, line outages 1-2, 1–3, 3-4, and 2–5 are considered to be critical line outages [10]. Outage of lines 1-2 has high severity index of 2.371. In this work all the above line outage cases are considered. The following four line outage case studies have been considered for simulation.
A. Outage of line 2-5 and increase of load at buses 2, 3, 4 and 5 by 35%, with load factor (LF) of 1.35 B. Outage of line between buses 1 and 3, the load at bus 19 is
increased by 130% with LF= 2.3
C. Outage of line 3-4 and increase of load at bus 2 by 250%, LF= 3.5
D. Contingency of line 1-2 and load at all buses increased by 30%, LF=1.3
For all the cases, sensitive generators are identified based on generator sensitivity factors and congestion is relieved by rescheduling the sensitive generators using FF algorithm. Optimal congestion cost is calculated using the incremental and decremental bids submitted by the generators. Table 2 depicts the details of congested line, power violation and line limit in all the four cases.
Table 2: Congested line details in case 1
Case
No. of lines conge sted
Con gest ed line
power flow
Line limit
Power violatio n
Total Power violation
A 6
1-2 214.92 130 84.92
217.18
2-4 95.54 65 30.54
2-6 110.88 65 45.88 5-7 115.28 70 45.28 6-7 136.12 130 6.12
6-8 36.44 32 4.44
B 1 1-2 189.12 130 59.12 59.12
C 1 1-2 228.76 130 98.76 98.76
D 3
1-3 190.11 70 120.11
205.44 3-4 186.62 130 56.62
4-6 118.71 90 28.71
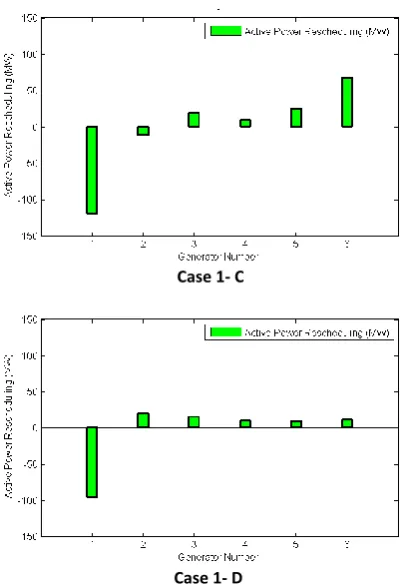
[image:3.595.64.277.326.434.2]FF algorithm is used to relieve congestion in all above cases and the congestion cost obtained in all these cases are given in Table 3. Total congestion cost found by FF algorithm is compared with RCGA and SA methods. The active power rescheduling of generator for congestion management in all these cases are graphically represented in Fig. 1.
Table 3: Comparison of congestion cost obtained from SA, RCGA and FFA
Case
Net adjustments of generator powers (MW)
Total congestion cost ($/hr)
SA [10]
RCGA [10]
FFA SA [10]
RCGA [10]
FFA
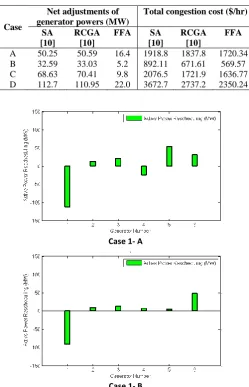
A 50.25 50.59 16.4 1918.8 1837.8 1720.34 B 32.59 33.03 5.2 892.11 671.61 569.57 C 68.63 70.41 9.8 2076.5 1721.9 1636.77 D 112.7 110.95 22.0 3672.7 2737.2 2350.24
Case 1- A
[image:3.595.300.550.342.730.2]Case 1- C
[image:4.595.65.269.73.366.2]Case 1- D
Fig. 1. Amount of power rescheduling of generators for congestion management
[image:4.595.310.539.202.371.2]From the table 3 it is inferred that the proposed FF algorithm is capable of relieving congestion effectively at minimum cost in the all the cases than other methods. This shows the effectiveness of the proposed algorithm in solving CM problem. Moreover, congestion is relieved by generation rescheduling alone, without any load curtailment in all the cases. The convergence characteristics of firefly algorithm for case D is given in Fig. 2. From this figure it is revealed that FF algorithm reaches the optimal solution in early iteration.
Fig. 2. Convergence characteristics of firefly algorithm-case D
4.2 Case 2: Wheeling transactions
In the restructured power market, most of the power transfers are carried out through bilateral and multilateral wheeling transactions. Each bilateral transaction satisfies the following power balance equation:
0 P
P k
dj k
gi k1,2,....tk (23) where
Power injection into the seller bus i for the kth transaction.
Power taken at the buyer bus j for the kth transaction. tk = total number of wheeling transactions.
Multilateral transaction which involves more than one seller and one buyer and is described by the following power balance equation;
0 P P
j k dj i
k
gi
(24) In this case, four simultaneous bilateral wheeling transaction and one multilateral transaction were carried out in the test system and their details are given in Table 4 & 5.Table 4: Details of bilateral transaction
Transaction Bus No. Magnitude of power transfer (MW)
From To
T1 14 22 17
T2 16 08 10
T3 25 05 15
T4 15 24 20
Table 5: Details of multilateral transaction
Power Injected Load
Bus No. Value (MW) Bus No. Value (MW)
18 14 06 10
21 12 12 10
03 08 27 04
30 10
Total 34 Total 34
After implementing these wheeling transactions, it is found that the transmission line connected between the buses 1-2 and 12-15 were congested and power flow results are as shown in table 6. FF algorithm is used to relieve congestion congestion by optimally rescheduling the generators and minimum congestion cost found to be 212.77 $/h
Table 6: Congested line details in case 2
4.2
Case 3: Generator outage
In this case, outage of generator 6 at bus 13 has been carried out with a 10% increases in load at all buses. This results in congestion on two lines as shown in table 7. The total power violation is 64.24 MW.
Table 7: Congested line details in case 3
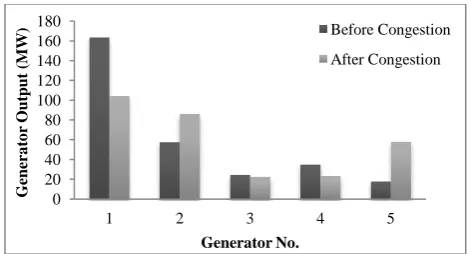
Table 7 shows the congested line and its power flow due to the generator outage. The proposed FF algorithm is used to relieve this congestion and the generator outputs before and after congestion are shown in Fig 3. The minimum congestion cost obtained is 232.65 $/h.
No. of lines congested
Conge sted line
power flow
Line limit
Power violati
on
Total Power violation
2 1-2 181.15 130 51.15 64.24
6-8 45.09 32 13.09
No. of lines congested
Cong ested line
power flow
Line limit
Power violatio n
Total Power violation
2 1-2 170.59 130 40.59 44.70
[image:4.595.63.271.506.636.2]Fig 3. Generator outputs before and after congestion
5.
CONCLUSION
In this paper congestion management problem has been solved using firefly algorithm by optimally rescheduling the active power of generators which are selected based on the generator sensitivity to the congested line. The congestion cost is minimized using firefly algorithm. Only most sensitive generators are rescheduled using the proposed algorithm. This reduces the computational effort and hence the congestion cost. In this paper most severe line outage, generator outage contingencies and wheeling transactions are considered and it is found that FF algorithm is capable of giving optimal solution with less cost in all the cases. This ensure that the proposed algorithm can be employed to large systems also.
6.
REFERENCES
[1] Kumar, S.C.Srivastava and S.N.Singh, 2005, “Congestion management in competitive power market: A bibliographical survey”, Electric Power Systems Research, Vol.76, No. 1-3, pp. 153–164.
[2] F.Jian and J.W.Lamont, 2001, “A combined framework for service identification and congestion management”, IEEE Transactions on Power Systems, Vol.16, No. 1, pp. 56–61.
[3] F.Capitanescu and T.V.Cutsem, 2007, “A unified management of congestions due to voltage instability and thermal overload”, Electric Power Systems Research, Vol. 77, No. 10, pp. 1274–1283.
[4] J.Conejo, A.Milano and R.G.Bertrand, 2006, “Congestion management ensuring voltage stability”, IEEE Transactions on Power Systems, Vol. 21, No. 1, pp. 357-364.
[5] A.Kumar, S.C.Srivastava and S.N.Singh, 2004, “A zonal congestion management approach using real and reactive
power rescheduling”, IEEE Transactions on Power Systems, Vol. 19, No. 1, pp. 554-562.
[6] Ashwani Kumar, S.C.Srivastava and S.N.Singh, 2004, “A zonal congestion management approach using AC transmission congestion distribution factors”, Electric Power Systems Research, Vol. 72, No. 1, pp. 85-93. [7] G.Yesuratnam and D.Thukaram, 2007, “Congestion
management in open access based on relative electrical distances using voltage stability criteria”, Electric Power Systems Research, Vol. 77, No. 12, pp. 1608-1618. [8] Sudipta Dutta and S.P.Singh, 2008, “Optimal rescheduling
of generators for congestion management based on particle swarm optimization”, IEEE Transactions on Power Systems, Vol. 23, No. 4, pp. 1560-1569.
[9] Jagabondhu Hazra and A.K.Sinha, 2007, “Congestion management using multiobjective particle swarm optimization”, IEEE Transactions on Power Systems, Vol. 22, No. 4, pp. 1726–1734.
[10]Sujatha Balaraman and N.Kamaraj, 2010 “Congestion management in deregulated power system using real coded genetic algorithm”, International Journal of Engineering Science and Technology, Vol.2, No.11, pp.6681-6690. [11]Naresh Acharya and N.Mitulananthan, 2007, “Locating
series FACTS devices for congestion management in deregulated electricity markets”, Electric Power Systems Research, Vol. 77, No. 3-4, pp. 352-360.
[12]K.S.Verma, S.N.Singh and H.O.Gupta, 2001, “Location of unified power flow controller for congestion management”, Electric Power Systems Research, Vol.58, No.2, pp.89-96.
[13]S.N.Singh, A.K.David, 2001, “Optimal location of FACTS devices for congestion management”, Electric Power Systems Research, Vol.58, No.2, pp.71-79.
[14]X.S.Yang, 2008, “Nature-Inspired Meta-Heuristic Algorithms”, Luniver Press, Beckington, UK.
[15]X.S.Yang, 2010, “Firefly algorithm, stochastic test functions and design optimisation”, International Journal of Bio-Inspired Computation, Vol. 2, No. 2, pp. 78–84. [16]O.Alsac and B.Stott, 1974, “Optimal load flow with
steady-state security”, IEEE Transactions on Power Apparatus and Systems, Vol.93, No.3, pp. 745-751.
0 20 40 60 80 100 120 140 160 180
1 2 3 4 5
Gener
a
to
r
Ou
tp
u
t
(M
W
)
Generator No.
Before Congestion