© 2016, IRJET | Impact Factor value: 4.45 | ISO 9001:2008 Certified Journal | Page 1402
Manpower Optimization and Method Improvement for a Warehouse
Swapnil Tonape
1, Kapil Patil
2, Prof. Dr. Varsha Karandikar
31
M.Tech. Dept. of Industrial and Production Engineering, Vishwakarma Institute of Technology, Pune.
2M.Tech. Dept. of Industrial and Production Engineering, Vishwakarma Institute of Technology, Pune.
3Professor, Dept. of Industrial and Production Engineering, Vishwakarma Institute of Technology, Pune,
Maharashtra, India.
---***---Abstract -
Warehouses are scientific storage structures especially constructed for the protection of the quantity and quality of stored products. Warehousing may be defined as the assumption of responsibility for the storage of goods. It may be called the protector of national wealth, for the produce stored in warehouses is preserved and protected against rodents, insects and pests, and against the ill-effect of moisture and dampness. The warehousing scheme in India is an integrated scheme of scientific storage, rural credit, price stabilization and market intelligence and is intended to supplement the efforts of co-operative institutions. Between the time an order is released to the warehouse and the time it takes to reach its destination, there is ample opportunity for errors in both accuracy and completeness, not to mention time lost. There is also room for improvement. Industry has come up with innovative solutions, making it possible to attain productivity up to 1,000 picks per person hour.Key Words
:
Manpower optimization, Time study,Method improvement, Layout modification, Material Handling System.
1. INTRODUCTION
The utilization and optimization of the manpower is the need of the project. The flow of the empty and loaded cages in unloading area is not satisfactory. The material was handled 6 to 7 times and then it goes in the cage from the truck. So for reducing the handling of material, we improve the method of unloading. The need of the project is to improve the method for unloading activity in unloading area. There was the problem of excess manpower. The manpower comes in large numbers for working. The available manpower was greater in numbers. The problem for supervisor is to give the work for the number of workers. The manpower distributed for loading, unloading and stacking area. The scope of project is to optimize the manpower of warehouse. The problems identified on shop floor for the method improvement. The scope of the project is to set the target manpower for docks at the loading and unloading stations. The improvement for unloading the trucks is to reduce the excess manpower. The main reason for method improvement is to set the flow of material and handling of the material.
1.1 Manpower Optimization
The manpower for warehouse was not fixed. The manpower comes in the morning that distributed in loading, unloading and stacking area. Many of the times the manpower comes in large numbers. The task for the supervisor is to distribute the manpower for each and every area. The loading side supervisor, unloading side and the stacking area supervisor take the manpower as per their requirement. But many of the times problem arises in the distribution of the manpower. For every day in the morning 15 minutes goes into distribution of the manpower. The total time for 7 docks in unloading area and 9 docks in loading area were loosen by the supervisor because not properly planned the manpower. Every day the activities start after at least 30 min. after shifts actually starts. In unloading area the empty cages were not available in starting of shifts. So that time also loosen by the supervisor for unloading the trucks. Many of the times chaos between workers as well as supervisors for collecting hand pallet truck and empty cages. That was also the reason for loss time of unloading. The next problem for unloading docks is that the unloading of truck activity. The 7 to 8 workers stand in front of docks and the empty cages were stacked in front of them in a row. The minimum 8 empty cages were placed in front of each other and filled cage from long distance from truck. For that activity supervisor needs 7 to 8 people for unloading. The maximum material was handling done on unloading side.
© 2016, IRJET | Impact Factor value: 4.45 | ISO 9001:2008 Certified Journal | Page 1403 material put exactly at which place and which material to be
drawn out from which month.
The problem is that to set the manpower for warehouse at each and every area that means unloading, loading and stacking. The optimization of the manpower is the best solution that to utilize all the docks from loading and unloading side including stacking.
1.2 Material Handling System Improvements
The warehouse design for unloading area was taken into consideration at the time of the Time study for manpower utilization. The time and manpower is to be utilized and design should be done for the warehouse at the unloading docks. Before the study the stacking of the empty cages was not proper. For improper stacking activity takes much time and handling was not proper from unloading docks to stacking area. The problem arises when material unloaded and store into the cages that was not drawn out from first to last cage in a sequence. The filled cages were stucked in that unloading area and create confusion for workers to material to be drowned out and where to be placed.
In that particular activity the tags that are stick on the cages for particular filled cages were also misplaced. The unloading activity has excess manpower and creates confusion was that who will go to place the tags on the cages. A study done for the placing of the cages when truck to be unloaded and truck stand in front of the docks. The empty cages should be placed at the right hand side of the worker who unload the truck and worker should fill the cage by drawing from cage right hand side to left hand side. The left hand side cage of the worker then drawn out by the material handling worker from unloading area to stacking area. The “U” type flow for unloading the truck is the method improvement and improvement in warehouse designing.
2. DATA COLLECTION
In this technique we use the overall time study. The study carried out to observe the time required for loading and unloading of the truck.
There are 7 docks on unloading side and 8 docks on loading side. For unloading side 5 docks are in use. In those 5 docks, 1 dock was the dock level. By using the time study we calculate the overall time required for unloading the truck on each dock that was in use. The manpower used by supervisor for unloading was taken into consideration. The overall data was collected that was truck number, truck weight, total tonnage inside the truck, manpower used by supervisor and the start time of unloading the truck to end time of unloading the truck ( clock time).
In this technique we use the overall time study. The study carried out to observe the time required for loading and unloading of the truck.
[image:2.595.306.562.296.402.2]There are 7 docks on unloading side and 8 docks on loading side. For unloading side 5 docks are in use. In those 5 docks, 1 dock was the dock level. By using the time study we calculate the overall time required for unloading the truck on each dock that was in use. The manpower used by supervisor for unloading was taken into consideration. The overall data was collected that was truck number, truck weight, total tonnage inside the truck, manpower used by supervisor and the start time of unloading the truck to end time of unloading the truck ( clock time).
Table -1: Data collection format of unloading/loading
SR.
NO. DOCK NO. DOCK NO. DOCK NO. DOCK NO. DOCK NO.
1 ST: 9:10 ET: 10:30 Manpower:6 Vehicle No.: ST:8:40 ET:11:20 Manpower:6 Vehicle No.: ST:9:30 ET:1:30 Manpower:6 Vehicle No.: ST:10:00 ET:12:00 Manpower:6 Vehicle No.: ST: 9:25 ET:12:20 Manpower:6 Vehicle No.: 2
ST: ET: Manpower: Vehicle No.:
ST: ET: Manpower: Vehicle No.:
ST: ET: Manpower: Vehicle No.:
ST: ET: Manpower: Vehicle No.:
ST: ET: Manpower: Vehicle No.:
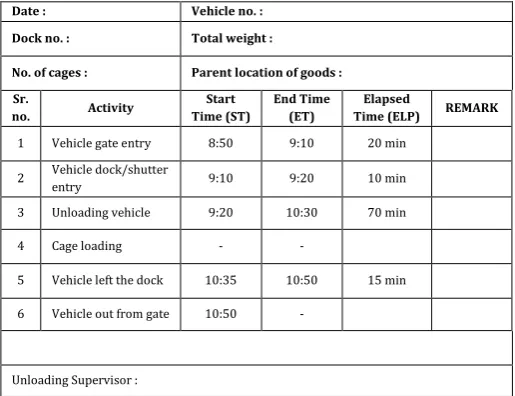
Table -2: Data collection format of unloading/loading
Date : Vehicle no. :
Dock no. : Total weight :
No. of cages : Parent location of goods : Sr.
no. Activity
Start Time (ST)
End Time (ET)
Elapsed
Time (ELP) REMARK
1 Vehicle gate entry 8:50 9:10 20 min
2 Vehicle dock/shutter
entry 9:10 9:20 10 min
3 Unloading vehicle 9:20 10:30 70 min
4 Cage loading - -
5 Vehicle left the dock 10:35 10:50 15 min
6 Vehicle out from gate 10:50 -
Unloading Supervisor :
[image:2.595.308.566.447.645.2]© 2016, IRJET | Impact Factor value: 4.45 | ISO 9001:2008 Certified Journal | Page 1404 Another area to be analyzed was the stacking area, for that
[image:3.595.301.558.121.203.2]purpose we track the cages that are filled with boxes and bags. We differentiate the box cages and bag filled cages to track for unloading station to the stacking area where they stack on vertical racks. They used the 2 race stackers for stacking the cages filled with box and bags. Remaining bags and boxes they were stack on the ground. For boxes stacking and material handling they used 2 manpower and for bags stacking they used only 1 manpower. We track the box cages and bag cages and record the clock time for transportation.
Table -3: Data collection format of stacking
Date : Vehicle no. :
Dock no. : Total weight :
Total shifted cages : Parent location of goods : Sr.
No. Activity
Start Time (ST) End Time (ET) Elapsed Time (ELP) Cage
weight Remark
1 Vehicle dock entry 8:35 9:00 25 min
Material unloading 1st
cage 9:00 9:10 10 min 200 kg
2 Cage movement to rack 9:10 9:12 2 min
Unloading on Rack Cage movement from Rack
3 Cage movement to rack
Unloading on Rack Cage movement from Rack
Last
cage Cage movement to rack
Unloading on Rack Cage movement from Rack
Stacking Supervisor :
The loading activity carried out in 6 to 7 workers. The actual loading is done by 4 workers and material drawn by 2 or 3 workers as per their availability. The loading supervisor gave the order sheet to workers who drawn out the material from stacking area. The actual loading workers start loading when the material was drawn out as per the order given by the supervisor. The waiting for loading for docks was Sat least an hour because time required for drawing material activity takes much time. This activity depends on the number of items given in the order sheet.
3. DATA ANALYSIS
Table -5: Number of manpower for unloading(Before)
Before condition (unloading)
Total average tonnage
Average number
of trucks Dock 2,3,6,7 Dock 4
Total manpower
77 ton/day 20/day 24 5 29
Table -6: Number of manpower for unloading (After)
After condition (unloading)
Total average tonnage
Average number
of trucks Dock 2,3,6,7 Dock 4
Total manpower
[image:3.595.300.562.238.458.2]77 ton/day 20/day 4*4= 16 3 19
Table -7: Number of manpower for stacking (After)
Box cages (data collection for 5 days)
Bag cages (data collection for 5 days)
Total cages 390 390
Average cages 390 / 5 = 78 390 / 5 = 78
Average time per
cage 17 6
Manpower 2 1
Man min for per
cage 17 * 2 = 34 6 * 1 = 6
Shifting time per
day 78 * 34 = 2652 min 78 * 6 = 468
Total shifting time 2652 + 468 = 3120
Manpower required
[image:3.595.31.298.246.478.2]for Stacking area 3120 / 450 (working time) = 6.93 = 7 manpower
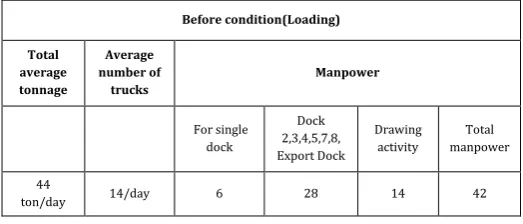
Table -8: Number of manpower for loading (Before)
Before condition(Loading) Total average tonnage Average number of trucks Manpower For single dock Dock 2,3,4,5,7,8, Export Dock Drawing activity Total manpower 44
ton/day 14/day 6 28 14 42
Table -9: Number of manpower for loading (After)
After condition(Loading) Total average tonnage Average number of trucks Manpower For single dock Dock 2,3,4,5,7,8, Export Dock Drawing activity Total manpower 44
ton/day 14/day
44/14=3.14
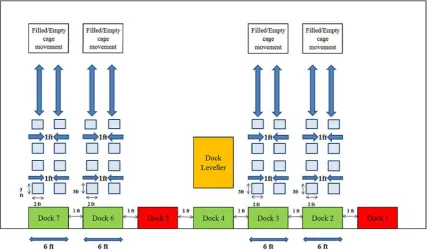
[image:3.595.303.565.497.609.2]© 2016, IRJET | Impact Factor value: 4.45 | ISO 9001:2008 Certified Journal | Page 1405 Fig -1: Present situation of unloading and loading activity with manpower
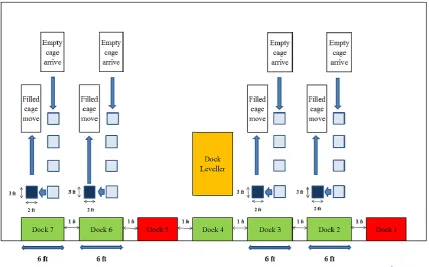
[image:4.595.84.515.423.675.2]© 2016, IRJET | Impact Factor value: 4.45 | ISO 9001:2008 Certified Journal | Page 1406 Fig -3: Proposed situation of unloading and loading activity with manpower
[image:5.595.83.513.384.651.2]© 2016, IRJET | Impact Factor value: 4.45 | ISO 9001:2008 Certified Journal | Page 1407
The above figure shows the present and proposed
situation of warehouse. The yellow colored circle
shows the actual unloading and loading activity
manpower. The red colored circle shows the actual
material handling manpower of unloading and loading
side. The green colored circle shows the actual stacking
manpower of warehouse. The results and savings
related to cost as shown in results.
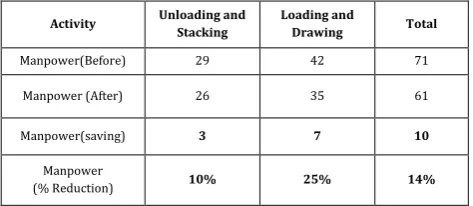
[image:6.595.30.267.273.376.2]4. RESULTS
Table -10: Sample Table format
Activity Unloading and
Stacking
Loading and
Drawing Total
Manpower(Before) 29 42 71
Manpower (After) 26 35 61
Manpower(saving) 3 7 10
Manpower
(% Reduction) 10% 25% 14%
Table -11: Improvement related cost
Manpower Loading Unloading Total Cost per day(Rs.)
Total cost for worker(Rs.)
Before 42 29 71 250 17750
After 35 19 61 250 15520
Table -10: Sample Table format
Savings (Rs.) Savings per Month(Rs.) Savings per Year(Rs.)
2500 62,500 7,50,000
We Select the work to be studied and define the actual procedure. Then weRecordthe relevant facts about the job by direct observation and collect such additional data as needed from appropriate resources that was for time consider for handling the cages. WeExaminethe way job is being performed and challenge its purpose, place, sequence and method of moving the cages. By analyzing the method we Develop the most practical, economic and effective method, drawing on the contribution of those Concerned
By developing the method we Evaluate different alternatives to developing a new improved method comparing the cost effectiveness of the selected new method with the current method of performance.
By considering various methods weDefinethe new method, as a result, in a clear manner and present it to those concerned, that is management, supervisor and workers. Then weInstallthe new method as a standard practice and train the persons involved in applying it. The task for the supervisor and the workers to Maintainthe new method and introduce control procedure to prevent a drifting back to the previous method of work.
5. CONCLUSIONS
The improvements done after implementing the manpower and method improvements in warehouse. The utilization of manpower reduces the cost of excess manpower and increases the total savings for a year as shown above. The benefit related to cost for month and it helps to improve increase in year. The management will take the decision of increasing the business and manufacturing ability in future. This excess manpower can be used for other productive work. Similar technique can be used for manpower optimization in other areas also to improve overall effectiveness of the manpower.
REFERENCES
[1] International Labour Organization (ILO) ,Introduction to
Work Study, Universal Publishing Corp., India. Third Revised Edition, 1986.
[2] Khalil A. El-Namrouty, Mohammed S. AbuShaaban. Seven
Wastes Elimination Targeted by Lean Manufacturing Case Study “Gaza Strip Manufacturing Firms’’, International Journal of Economics, Finance and Management Sciences. Vol. 1, No. 2, 2013.
[3] Nor Diana Hashim, Faculty of Manufacturing Engineering,