© 2016, IRJET | Impact Factor value: 4.45 | ISO 9001:2008 Certified Journal
| Page 2556
Taguchi design optimization of cutting parameters for Surface
Roughness in turning INCONEL
Ch.Deva Raj
1*,
Dr.C.Srinivas
2, P.Mastan Rao
3,D.Suneel
41*Assistant Professor, Department of Mechanical Engineering, R.V.R. &J.C. College of Engineering, Guntur-19, A.P,India. 2 Associate Professor, Department of Mechanical Engineering, R.V.R. &J.C. College of Engineering,Guntur-19, A.P,India. 3 Assistant Professor, Department of Mechanical Engineering, P.V.P. Sidhardtha Engineering College,Vijayawada,A.P,India.
4Student, Department of Mechanical Engineering, R.V.R. &J.C. College of Engineering, Guntur-19, A.P,India.
---***---Abstract -
In this study, the Taguchi method is used to investigate the relation between changes in surface roughness caused on the material surface due the turning operation with respect to different machining parameters. The orthogonal array, the signal-to-noise ratio, and analysis of variance are employed to study the performance characteristics in turning operations of Inconel 718 bars using TiCN – Al2O3 coated cemented carbide insert tools. Three cutting parameters namely, speed, feed rate, and depth of cut are used to find the optimum combination of the cutting parameters to minimize the surface hardness using Taguchi method. Experimental results are provided to illustrate the effectiveness of this approachKey Words: Turning, Taguchi, Inconel 718, S/N Ratio,
ANOVA.
1.INTRODUCTION
In modern industry the goal is to manufacture low cost, high quality products in shorter time. Automated and flexible manufacturing systems along with computerized numerical control (CNC) machines are employed for that purpose .They are capable of achieving high accuracy with very low processing time. Turning is the first most common method for cutting and especially for the finishing machined parts. In a turning operation, it is important task to select cutting parameters for achieving high cutting performance. Usually, the desired cutting parameters are determined based on experience or by use of a handbook.
Cutting parameters are reflected on surface roughness, surface texture and dimensional deviations of the product. Surface roughness, which is used to determine and to evaluate the quality of a product, is one of the major quality attributes of a turning product. Surface roughness is a measure of the technological quality of a product and a factor that greatly influences manufacturing cost. It describes the geometry of the machined surfaces and combined with the surface texture. The mechanism behind the formation of surface roughness is very complicated and process dependent.
To select the cutting parameters properly, several mathematical models [1, 2, 3, 4 and 5] based on statistical regression or neural network techniques have been constructed to establish the relationship between the cutting performance and cutting parameters. Then, an objective function with constraints is formulated to solve the optimal cutting parameters using optimization techniques. Therefore, considerable knowledge and experience are required for this approach. In this study, an alternative approach based on the Taguchi method [6, 7 and 8] is used to determine the desired cutting parameters more effectively.
There were two purposes of this research. The first was to demonstrate a systematic procedure of using Taguchi parameter design in process control of turning machines. The second was to demonstrate a use of the Taguchi parameter design in order to identify the optimum surface roughness performance with a particular combination of cutting parameters in a turning operation. The paper is organized in the following manner. An overview of the parameter design based on the Taguchi method is given first. Then, the parameter design with the multiple performance characteristics is introduced. The experimental detail of using the parameter design to determine and analyze the optimal cutting parameters in turning operations is described next. Finally, the confirmation test and the paper conclude with a summary of this study and the future scope.
2. TAGUCHI METHOD
© 2016, IRJET | Impact Factor value: 4.45 | ISO 9001:2008 Certified Journal
| Page 2557
control factors". In turn, the best levels of control factors are those that maximize the signal-to-noise ratios.
The use of the parameter design of the Taguchi method to optimize a process with multiple performance characteristics includes the following steps [11]:
1. Identify the performance characteristics and select process parameters to be evaluated.
2. Determine the number of levels for the process parameters and possible interactions between the process parameters.
3. Select the appropriate orthogonal array and assignment of process parameters to the orthogonal array.
4. Conduct the experiments based on the arrangement of the orthogonal array.
5. Calculate the total loss function and the s/n ratio. 6. Analyze the experimental results using the s/n ratio
and ANOVA.
7. Select the optimal levels of process parameters. 8. Verify the optimal process parameters through the
confirmation experiment.
2.1. Selection of cutting parameters and their levels
The cutting experiments were carried out on an Johnford T35 CNC lathe using TiN coated tools with the grade of P-20 for the machining of AISI 1030 steel bars. In the tests used inserts were TNMG 160404- MA, TNMG 160408- MA and TNMG 160412- MA. The initial cutting parameters were as follows: insert radius of 0.8 mm, a feed rate of 0.25 mm/rev, and a depth of cut of 1.5 mm. The feasible range for the cutting parameters was recommended by a machining handbook, i.e., insert radius in the range 0.4–1.2 mm, feed rate in the range 0.15–0.35 mm/rev, and depth of cut in the range 0.5–2.5 mm. Therefore three levels of the cutting parameters were selected as shown in Table 1
Inconel 718 is a Gamma Prime (Ni3Nb) strengthened alloy with excellent mechanical properties at elevated temperatures, as well as cryogenic temperatures. Inconel 718 is used in any environment that requires resistance to heat and corrosion but where the mechanical properties of the metal must be retained. The challenge and difficulty to machine Inconel 718 is due to its profound characteristics such as high shear strength, tendency to weld and form build-up edge, low thermal conductivity and high chemical affinity. Inconel 718 also has the tendency to work harder and retain major part of its strength during machining. Due to these characteristics, Inconel 718 is not easy to cut and thus has been regarded as a difficult-to-cut material. Inconel 718 being
a difficult-to-machine material requires hard cutting tool.
3. METHODOLOGY
A methodology was developed to study the influence of cutting parameters on the surface roughness developed after turning of Inconel 718 with TiCN – Al2O3 coated cemented carbide insert.
3.1 Cutting conditions
The work piece considered for the experiment was Inconel 718 and cemented carbide insert with TiCN – Al2O3 coating was used as cutting tool. The ISO designation of the cutting tool insert is TNMG 160408–MT. Turning tests were carried out on a Computer Numerically Controlled (CNC) lathe machine under wet condition using ISO VG68 cutting fluid. The CNC lathe machine, located in “M. Govind & Sons”, Perecharla, Guntur, used for the experimental purpose was of Simple Turn type by ACE Designers Limited. Three cutting parameters (speed, feed rate and depth of cut) were considered with three levels for each cutting parameter. The cutting speeds were 300, 400 and 500 rpm. The feed rates used were 0.05, 0.1 and 0.15 mm/rev. The depths of cut of 0.1, 0.3 and 0.5 mm were used. The cutting parameters and their levels were summarized in Table 1.
Table-1: Experimental factors and their levels
Levels of the experimental
factors
Factors
Speed, N
(rpm) Feed rate, f (mm/rev)
Depth of cut, d (mm)
1 300 0.05 0.1
2 400 0.10 0.3
3 500 0.15 0.5
Three experimental factors and three levels for each factor are considered. So, L9 orthogonal array was taken and the experimental combinations were shown in Table 2
3.2 Experimental procedure
© 2016, IRJET | Impact Factor value: 4.45 | ISO 9001:2008 Certified Journal
| Page 2558
Fig.1: Center drilling of work piece
Fig.2: Work piece setup on CNC
3.3 Evaluation of signal-to-noise ratio
Surface roughness was measured using Talysurf instrument. For each experimental run, an average of three measurements of the surface roughness was taken to use in the multi-criteria optimisation.
Table 2 shows the selected design matrix based on Taguchi L9 orthogonal array consisting of machining conditions and the experimental results of the response − surface roughness. All these data were utilized for the analysis and evaluation of the optimal parameter combination.
To determine the effect each variable has on the output, the signal-to-noise (S/N) ratio needs to be calculated for each experiment conducted. The SN ratio formulae are given below:
Smaller-the better (minimize):
S/NS = -10 * (i)
y = average of the observed data r = number of replications
To obtain optimal machining performance smaller-the-better performance is considered as the characteristic for surface hardness.
Table 3 shows the experimental results for surface roughness and the corresponding S/N ratio using the equation (i). Since the experimental design is orthogonal, it is then possible to separate out the effect of each cutting parameter at different levels. For example, the mean response for the speed at levels 1, 2 and 3 can be calculated by averaging the responses for the experiments 1–3, 4–6 and 7–9 respectively. The mean responses for each level of the other cutting parameters were computed in the similar manner and shown in Table 3. The delta values represent the algebraic difference between the maximum and minimum mean values of the levels for each factor. In the similar manner, the mean S/N ratios for each factor at each level and also the total mean S/N ratio of the nine experiments were calculated and shown in Table 4. The variation of responses of the S/N ratios and the means for each factor was shown in Figures 3 and 4 respectively. The graphs were obtained using the software Minitab 15.
Table 2: Machining conditions and responses
Run no.
Cutting parameters response Output
S/N ratio Speed
N (rpm)
Feed rate f (mm/rev
)
Depth of cut
d (mm)
SR (μm)
1 300 0.05 0.1 1.23 1.7981
2 300 0.10 0.3 1.26 2.0074
3 300 0.15 0.5 1.24 1.8684
4 400 0.05 0.3 1.25 1.9382
5 400 0.10 0.5 1.30 2.2788
6 400 0.15 0.1 1.25 1.9382
7 500 0.05 0.5 1.35 2.6066
8 500 0.10 0.1 1.67 4.4543
9 500 0.15 0.3 1.22 1.7272
Table 3: Response table for means
Levels
Factors Speed
N (rpm)
Feed rate f (mm/rev)
Depth of cut d (mm)
1 1.24333 1.27667 1.38333
2 1.2667 1.41 1.2433
3 1.41333 1.23667 1.29667
Delta 0.17000 0.17333 0.14000
[image:3.595.49.279.297.452.2] [image:3.595.307.562.412.603.2]© 2016, IRJET | Impact Factor value: 4.45 | ISO 9001:2008 Certified Journal
| Page 2559
Fig. 3 Response graph for S/N ratio
Fig. 4 Response graph for means
Table 4: Response table for S/N ratios
Levels
Factors Speed
N (rpm)
Feed rate f (mm/rev)
Depth of cut
d (mm)
1 1.89132 2.11433 2.73021
2 2.05176 2.91354 1.89094
3 2.92940 1.84461 2.25133
Delta 1.03808 1.06893 0.83927
Rank 2 1 3
3.4 Optimal combination
Regardless of the category of the performance characteristics, a greater S/N value corresponds to a better performance. Therefore, the optimal level of the machining parameters is the level with the greatest S/N value. Based on the analysis of the S/N ratio from Table 4 and Fig 3, the S/N ratio was maximum at 1st level of speed, 3rd level of feed rate and 2nd level of depth of cut. Hence, the optimal combination for minimizing the surface roughness is 300 rpm speed, 0.10 mm/rev feed rate and 0.3 mm depth of cut.
4. RESULTS AND DISCUSSIONS
4.1 Analysis of Variance
The purpose of ANOVA is to determine which cutting parameters significantly affect the quality characteristic (here, surface roughness). ANOVA tests the null hypothesis that the population means of each level are equal, versus the alternative hypothesis that at least one of the level means are not all equal. The sums of squared deviations are calculated by using the following
SST = SSF + SSe (ii) Where,
SST = 2 (iii) SST = Total sum of the squared deviations about the mean S/N ratio
SSF = Sum of the squared deviations of S/N ratio due to each factor
SSe = Sum of the squared deviations of S/N ratio due to error
γj = S/N ratio for the jth experimental run γm = Mean S/N ratio
The ANOVA for the S/N ratios was shown in Table 5. The following formulae are used for ANOVA calculations:
MSS = SS/DOF
F = MSS/MSE
Contribution % = SS/SST (iv) Where,
MSS = Mean sum of squares
Table 5: Results of ANOVA
Machi ning para meter
Degre es of freed om (DOF)
Sum of square (SS)
Mean sum
of squar es(MS S)
F P bution Contri (%)
N 2 0.0509 0.050 1.70 0.371 31.77 f 2 0.0494 0.049 1.65 0.378 30.81 d 2 0.0299 0.029 1.00 0.501 18.68 Error
(e) 2 0.0300 0.030 Total
(T) 8 0.1603
© 2016, IRJET | Impact Factor value: 4.45 | ISO 9001:2008 Certified Journal
| Page 2560
the variation. For a factor with a high percentage contribution, there is a greater influence on the performance.
4.2 Confirmation test
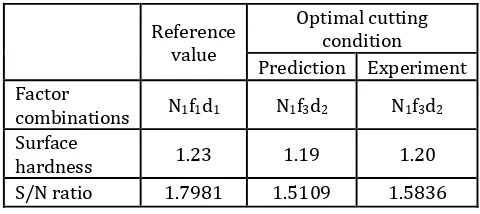
[image:5.595.41.281.323.430.2]For the optimal combination, N1f3d2, a confirmation experiment was performed for 300 rpm speed, 0.15 mm/rev feed rate and 0.3 depth of cut. The predicted S/N ratio for the optimal combination was –1.5109 and the surface roughness for the predicted S/N ratio was 1.19. Surface roughness test when performed on the work piece for this optimal combination was found to be 1.20. The S/N ratio for this value of surface roughness was -1.5836 which was in close proximity with the predicted value. The results show that using the optimal parameter settings (N1f3d2) causes a lower surface roughness.
Table 4: Results of confirmation test
Reference value
Optimal cutting condition Prediction Experiment Factor
combinations N1f1d1 N1f3d2 N1f3d2 Surface
hardness 1.23 1.19 1.20
S/N ratio 1.7981 1.5109 1.5836
5. CONCLUSION
This paper presents the optimization of the surface roughness during the turning of Inconel 718 with TiCN – Al2O3 coated cemented carbide insert by using Taguchi method of DOE. The surface roughness was optimized for minimum and the factors accountable for it were 300 rpm speed, 0.15 mm/rev feed rate and 0.3 mm depth of cut. The effectiveness of this approach was verified by the confirmation test and analysis of variance (ANOVA). The predicted and the experimental S/N ratios and Surface roughness were measured of the optimal combination, and the results were in close proximity.
REFERENCES
[1.] Taguchi G. (1990), Introduction to quality engineering. Tokyo: Asian Productivity Organization;
[2.] Ross PJ.(1988), Taguchi techniques for quality engineering. New York:McGraw-Hill;
[3.] Phadke MS.(1989), Quality engineering using robust design. Englewood Cliffs (NJ): Prentice-Hall;
[4.] Disney BJ, Pridmore WA.(1989) Taguchi methods: applications in world industry. UK: IFS Publications; [5.] Yang H, Tarng YS (1998). Design optimization of cutting
parameters for turning operations based on the Taguchi method. J Mater Process Technol ;84:122–9.
[6.] Abuelnaga AM, El-Dardiry MA.(1984) Optimization methods for metal cutting. Int J Mach Tool Design Res;24(1):11–8.
[7.] Chryssolouris G, Guillot M.(1990) A comparison of statistical and AI approaches to the selection of process parameters in intelligent machining. ASME J Eng Ind ;112:122–31.
[8.] Chua MS, Rahman M, Wong YS, Loh HT(1993). Determination of optimal cutting conditions using design of experiments and optimization techniques. Int J Mach Tools Manuf ;33(2): 297–305.
[9.] Montgomery DC.(1997) Design and analysis of experiments. 4th ed. New York: Wiley;
[10.] Fisher RA.(1925) Statistical methods for research worker. London: Oliver & Boyd;