Mammographic image Classification using Gabor Wavelet
Prof. S. M. Salve
Assistant Professor,
Department of Computer Science & Engineering P. E. S. College of Engineering
Aurangabad- 431001, Maharashtra, India
Abstract— Breast cancer is the most common type of cancer in women. Mammography is used for early detection and diagnosis of breast diseases. This system is developed for classification of digital mammograms as Benign or Malign. The proposed system can be divided into various phases as preprocessing, feature extraction, and classification. The preprocessing takes an image and perform image enhancement using histogram equalization and median filter to remove noise and unwanted text written on it. Then feature extraction phase extracts the most prominent and distinguishable features from objects and images which further can be used to represent various classes of objects. Gabor wavelet features are given as an input to classifier that assigns them to the class that they represent. After extraction of desired features Principal Component Analysis (PCA) is used for dimensionality reduction. Then extracted features are fed to Support Vector Machine Classifier which classifies the images into normal or abnormal (benign or malignant) images. The system output is checked on the database of 322 images, originating from the MIAS database.
Keywords: Gabor Wavelet, Support Vector Machine.
I. INTRODUCTION
Breast cancer is the most common cause of cancer in women and the second most common cause of cancer death in women in the U.S. The chance of a woman having invasive breast cancer some time during her life is about 1 in 8. The chance of dying from breast cancer is about 1 in 35. A numerous mammograms are generated daily in hospitals and health check centers. Thus, Physicians and radiologists have more and more images to manually analyze. After analyzing a number of images, the process of diagnosing them becomes wearisome, and therefore, more susceptible to errors. A computer-aided diagnosis (CAD) system can be used to assist the physician’s work and to reduce mistakes. Thus, building CAD systems to be used in medical care is becoming highly important, and this helps the radiologists use the result as a “second opinion” to assist them, speeding up the diagnosing task. Based on current incidence rates, 12.4 percent of women born in the United States today will develop breast cancer at some time during their lives. This
estimate, from the most recent SEER Cancer Statistics Review, is based on breast cancer statistics for the years 2007 through 2009.
Several techniques have been proposed to analyze mammogram images. Tai Sing Lee [1] has proposed a method that computes the frame bounds for the particular case of 2D Gabor wavelets which derived the conditions under which a set of continuous 2D Gabor wavelets provide a complete representation of any image, and also find self-similar wavelet parameterizations which allow stable reconstruction by summation as though the wavelets formed an orthonormal basis. Snehal A. Mane, Dr. K. V. Kulhalli [2] developed a system for diagnosing the breast cancer from mammogram images in two stages. In the first stage, features are extracted to discriminate between textures representing clusters of microcalcifications and texture representing normal tissue. The original mammogram image is decomposed using wavelet decomposition and gabor features are extracted from the original image Region of Interest (ROI). With these features individual microcalcification clusters is detected. Then the ability of these features in detecting microcalcification is done using Backpropagation Neural Network (BPNN). The proposed classification approach is applied to a database of 322 dense mammographic images, originating from the MIAS database.
The proposed system focuses on the solution of two problems. One is how to detect tumors as suspicious regions with a very weak contrast to their background and another is how to extract features which categorize tumors. There are five main phases: image pre-processing, extraction of features from mammographic images using Gabor Wavelet, dimensionality reduction using PCA and classification using Support Vector Machine (SVM) classifier. Image Preprocessing is done by applying two dimensional median filter and histogram equalization so as to get more enhanced image. Then Gabor features are extracted from the images which are reduced by Principal Component Analysis. Further Support Vector Machine (SVM) classifier is used to classify the tumor as Benign or Malignant or Normal.
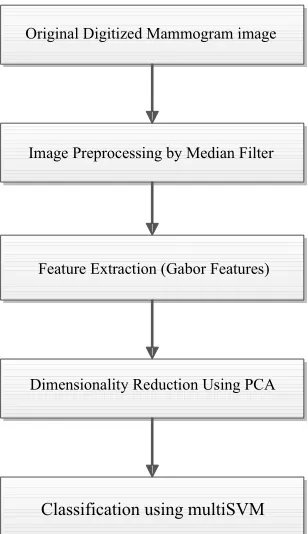
The detection of tumors in mammogram is divided into three main stages. The first step involves an enhancement procedure, image enhancement techniques are used to improve an image, where to increase the signal to noise ratio and to make certain features easier to see by modifying the colors or intensities. Then the intensity adjustment is an image’s intensity values to a new range. Then the Gabor based features are extracted from the mammogram. Then the next stage involves the classification using multiclass SVM classifier. Figure 1 depicts the proposed system.
Figure 1: Flowchart of proposed system
2.1 Image Preprocessing
Image pre-processing techniques are necessary to find the orientation of the mammogram, to remove the noise and to enhance the quality of the image [3]. Before any image-processing algorithm can be applied on mammogram, preprocessing steps are very important in order to limit the search for abnormalities without undue influence from background of the mammogram. Digital mammograms are medical images that are difficult to be interpreted, thus a preparation phase is needed in order to improve the image quality and make the segmentation results more accurate. A preprocessing phase of the images is used to improve the
quality of the images and make the feature extraction phase more reliable. It minimizes the computational cost and also finds the ROI (region of interest). In breast imaging pre-processing is very necessary because those parts which are not part of breast can misguide the algorithm for classification. The aim of preprocessing is an improvement of the image data that suppresses undesired distortions or enhances some image features relevant for further processing and analysis task. This will affect the performance of the proposed method. Median filtering is a nonlinear operation often used in image processing to reduce "salt and pepper" noise. A median filter is more effective than convolution when the goal is to simultaneously reduce noise and preserve edges. 2D Median filter is used for filtering. It performs median filtering of the matrix in two dimensions. Each output pixel contains the median value in the M-by-N neighborhood around the corresponding pixel in the input image. MEDFILT2 pads the image with zeros on the edges, so the median values for the points within [M N]/2 of the edges may appear distorted.
Histogram equalization is used to make contrast adjustment so that the image abnormalities will be better visible. Histogram equalization is a technique for adjusting image intensities to enhance contrast. Through this adjustment, the intensities can be better distributed on the histogram. This allows for areas of lower local contrast to get better contrast. This technique corresponds to redistribution of gray levels in order to obtain uniform histogram. In this case every pixel is replaced by integral of the histogram of the image in that pixel [4]. Histogram equalization accomplishes this by efficiently spreading out the most frequent intensity values. The method is useful in images with backgrounds and foregrounds that are both bright or both dark. In particular, the method can lead to better views of bone structure in x-ray images, and to better detail in photographs that are over or under-exposed [5]. The function HISTEQ enhances the contrast of images by transforming the values in an intensity image, or the values in the color map of an indexed image, so that the histogram of the output image approximately matches a specified histogram. The enhanced image after applying median filter and histogram equalization is shown in figure 2.
Original Digitized Mammogram image
Image Preprocessing by Median Filter
Feature Extraction (Gabor Features)
Dimensionality Reduction Using PCA
(a) (b) Figure 2: (a) input image (b) Filtered image
2.2 Feature Extraction
The feature extraction and selection from an image plays a critical role in the performance of any classifier. Higher accuracy of the classifier can be achieved by the selection of optimum feature set. Use of all the pixel values in classification creates a computational overhead because image is a large data set. To improve the efficiency of the classifier dimensionality reduction is a good approach. There are many techniques for feature extraction for example, texture features, Gabor features, feature based on wavelet transform, principal component analysis and spectral mixture analysis. Feature extraction is the determination of a feature vector from a pattern. For pattern processing problems to be tractable requires the conversion of patterns to features that are abridged representation of patterns, ideally including only main information.
2.2.1 Gabor Wavelets
Nowadays, wavelets have been used quite frequently in image processing. They have been used for feature extraction, denoising, compression, face recognition, and image super-resolution. The decomposition of images into different frequency ranges permits the isolation of the frequency components introduced by “intrinsic deformations” or “extrinsic factors” into certain sub-bands. This process results in isolating small changes in an image mainly in high frequency sub-band images. 2D Gabor wavelets have been widely used in computer vision applications and modeling biological vision, since recent studies have shown that Gabor elementary functions are suitable for modeling simple cells in visual cortex [6]. Other nice property is provided by their optimal joint resolution in both space and frequency, suggesting simultaneously analysis in both domains [7]. A complex Gabor wavelet (filter) is defined as the product of a Gaussian kernel with a complex sinusoid. A 2D Gabor wavelet transform is defined as the convolution of the image I(z):
( ) ( ') ( ') '
k k
J z
I z zz dz(1)
with a family of Gabor filters (functions):
2
2 2
( ) exp exp ( ) exp
2 2
T T
T T
k
k k k
z Z Z i k z
(2)
Where z = (x, y) and k is the characteristic wave vector:
( cos
sin
)
Tk
kv
kv
(3) with(4)
The parameters ν and μ define the frequency and orientation of the filter. The effects of these parameters on the classification performance will be evaluated in next Section. All the images also include the locations of any abnormalities that may be present. The existing data in the collection consists of the location of the abnormality (like the centre of a circle surrounding the tumor), its radius, breast position (left or right), type of breast tissues (fatty, fatty glandular and dense) and tumor type if exists (benign or malign). To discard irrelevant (background) information like breast contour, patches of 140 × 140 pixels surrounding the abnormality region can be extracted from the original 1024 × 1024 pixels images. The patch size assures that, for most abnormal cases not only the abnormality region is captured but also the surrounding area, providing information about the abnormality shape. For the normal case, the patches can be extracted from random position inside the breast area. In order to reduce the computational load each image is down sampled to a final size of 30 × 30 pixels. The mammographic data can be split into two disjoint sets to test the generalization ability of the classifier with Gabor features as its input. Once desired features are extracted, Principal Component Analysis (PCA) is applied to it.
correlated variables into a set of values of linearly uncorrelated variables called principal components. The number of principal components is less than or equal to the number of original variables. PCA is done by eigenvalue decomposition of a data covariance (or correlation) matrix or singular value decomposition of a data matrix, usually after mean centering (and normalizing or using Z-scores) the data matrix for each attribute. The results of a PCA are usually discussed in terms of component scores, sometimes called factor scores (the transformed variable values corresponding to a particular data point), and loadings (the weight by which each standardized original variable should be multiplied to get the component score) [9].
2.3 Classification block
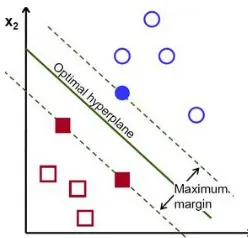
[image:4.612.100.224.505.624.2]Support vector machines (SVM) are based on the Structural Risk Minimization principle [10] from statistical learning theory. SVM is also applied on different real world problems such as face recognition, cancer diagnosis and text categorization. The idea of structural risk minimization is to find a hypothesis h with the lowest true error. Vapnik connects the bounds on the true error with the margin of separating hyper planes. In their basic form, support vector machines find the hyper plane that separates the training data with maximum margin. SVM is a useful technique for data classification. A classification task usually involves with training and testing data which consist of some data instances. Each instance in the training set contains one “target value" (class labels) and several “attributes" (features). The standard SVM (figure 2) takes a set of input data, and predicts, for each given input, which of two possible classes the input is a member of which makes the SVM a non-probabilistic binary linear classifier.
Figure 2: Support Vector Machine with a hyper plane
Since an SVM is a classifier, then given a set of training examples, each marked as belonging to one of two categories, an SVM training algorithm builds a model that predicts whether a new example falls into one category or
the other. More formally, a support vector machine constructs a hyper plane or set of hyper planes in a high or infinite dimensional space, which can be used for classification, regression or other tasks. Intuitively, a good separation is achieved by the hyper plane that has the largest distance to the nearest training data points of any class (so-called functional margin), since in general the larger the margin the lower the generalization error of the classifier.
Multiclass SVM aims to assign labels to instances by using support vector machines, where the labels are drawn from a finite set of several elements. The dominant approach for doing so is to reduce the single multiclass problem into multiple binary classification problems [11]. Common methods for such reduction include: [12] Building binary classifiers which distinguish between one of the labels and the rest (one-versus-all) or between every pair of classes (one-versus-one).
Classification of new instances for the one-versus-all case is done by a winner-takes-one-versus-all strategy, in which the classifier with the highest output function assigns the class (it is important that the output functions be calibrated to produce comparable scores). For the one-versus-one approach, classification is done by a max-wins voting strategy, in which every classifier assigns the instance to one of the two classes, then the vote for the assigned class is increased by one vote, and finally the class with the most votes determines the instance classification.
III. EXPERIMENTAL RESULTS
Performance measures
The performance of the classifier can be tested by calculating and analysis of accuracy, sensitivity and specificity for malignancy detection. They are defined as follows:
True Positive (TP): Areas called cancer and prove to be cancer. Tumors classified by the system as malignant and classified as malignant by the expert are true positives.
False Positive (FP): Areas called cancer that proves to be normal. Tumors classified by system as malignant and classified as benign by the expert are false positives.
False Negative (FN): Areas that are called normal and prove to be cancer. Tumors classified by system benign and classified as malignant by the expert are false negative.
True Negative (TN): Areas that are called normal and prove to be normal. Tumors classified by the system as benign and classified as benign by the expert are false positives.
Accuracy (Recognition Rate):
Number of classified mass / number of total mass
(
TP TN
) / (
TP TN FP FN
)
(9)Sensitivity (Recall/True Positive Rate):
Number of correct classified malignant mass /number of total malignant mass
(
TP
) / (
TP FN
)
(10)Specificity (True Negative Rate):
Number of correct classified benign mass / number of total benign mass
(
TN
) / (
TN FP
)
(11)Accuracy, sensitivity and specificity of Gabor Wavelet and DWT are given in Table 3.
Method Accuracy (%) Sensitivity (%) Specificity (%)
Gabor Wavelet 86% 89% 85%
The recognition performance obtained by Gabor Wavelet might not be satisfactory as the highest recognition rate does not exceed 86%. However, two main conclusions can be drawn from our experiments. Firstly, Gabor features seem to posses less accuracy, but true positive recognition rate is high. Secondly, Recognition Rate of Discrete Wavelet Transform is high, but true positive rate and true negative rate is less.
IV. CONCLUSION
The proposed system is developed for diagnosing the breast cancer from mammogram images. In first phase preprocessing on mammogram image is done which minimize the computational cost and maximize the probability of accuracy. To summarize the developed method, the initial step, based on gray level information of image enhancement and segments the breast tumor. In second phase Gabor Wavelet are extracted. These extracted features are used for classification of mammogram into malignant and benign. The multiclass SVM classifier is used for classification. Gabor features can be obtained by convolving patches representing tumor or tumor-free areas for recognition purpose. The recognition rate obtained by Gabor Wavelet is 86%. The accuracy of the Gabor Wavelet is less but its ability to correctly label positive class is high as its sensitivity is 89%. Higher accuracy can be obtained by increased number of samples with known classes and a very small number of test samples.
REFERENCES
[1] Tai Sing Lee, “Image Representation Using 2D Gabor Wavelets”, IEEE transactions on pattern analysis and machine intelligence, vol. 18, no. 10, october 1996.
[2] Snehal A. Mane, Dr. K. V. Kulhalli “Gabor Wavelet analysis for mammogram in Breast Cancer Detection”, International Journal on Recent and Innovation Trends in Computing and Communication 2015 ISSN: 2321-8169 Volume: 2 Issue: 4 [3] Samir Kumar Bandyopadhyay, pre-processing of Mammogram Images, International Journal of Engineering Science and Technology, Vol. 2(11), 2010, 6753-6758. [4]Thangavel. K, Roselin., Mammogram Mining with Genetic Optimization of Ant-Miner Parameters, R, International Journal of Recent Trends in Engineering, Vol 2, No. 3, November 2009.
cassification, International Journal of Engineering Science and Technology, Vol. 2(6), 2010, 2071-2076.
[6] O. R. Zaiane, M. L. Antonie, A. Coman, “Mammography Classification by an Association Rule-based Classifier”, In Third International ACM SIGKDD workshop on multimedia data mining (MDM/KDD’2002) in conjunction with eighth ACM SIGKDD, pp. 62–69, 2002.
[7] Ioan Buciu, A. Gacsadi, “Gabor Wavelet Based Features for Medical Image Analysis and Classification”, 2009 IEEE [8] H. S. Sheshadri, A. Kandaswamy,“Breast Tissue Classification Using Statistical Feature Extraction Of Mammograms”, Medical Imaging & Information Sciences, 23(3), pp. 105–107, 2006.
[9] R. Swiniarski, H. K. Lim, J. H. Shin, A. Skowron, ”Independent Component Analysis, Principal Component Analysis and Rough Sets in Hybrid Mammogram Classification”, Proc. of 2006 International Conference on Image Processing, Computer Vision, Pattern Recognition, Vol. II, pp. 640–645, 2006.
[10] Vapnik, V., “Statistical Learning Theory”, Wiley, 1998. [11] Duan, Kai-Bo; and Keerthi, S. Sathiya (2005). "Which Is the Best Multiclass SVM Method? An Empirical Study". Proceedings of the Sixth International Workshop on Multiple Classifier Systems.
[12] Hsu, Chih-Wei; and Lin, Chih-Jen (2002). "A Comparison of Methods for Multiclass Support Vector Machines". IEEE Transactions on Neural Networks.