© 2016, IRJET ISO 9001:2008 Certified Journal Page 945
Experimental Study of Effect of Bed Resistance on Velocity Profiles in
Rectangular Channel
Lakshmi Mitra
1, Prof. (Dr.) Mimi Das Saikia
21
M.Tech. Student, Department of CE, AdtU University, Panikhaiti, Guwahati-26, Assam, India
2
Professor, Department of CE, AdtU University, Panikhaiti, Guwahati-26, Assam, India
---***---Abstract -
The distribution of velocity in an open channel isnot uniform due to the presence of free surface, the bed material of the channel, the discharge, the slope of the channel etc. A number of experiments have been done for three different bed materials with different discharges. The bed materials are the original bed material i.e. smooth iron bed, grass carpet and PVC. Velocity at different sections and different depths are taken with the help of pitot tube. From the experiment, it is found that the maximum velocity appears to occur at the free surface of the channel, and the average velocity for all the cases is coming almost 0.75 to 0.95 of the surface velocity.
Key Words:
Open channel flow, Manning’s “n”, velocity distribution, surface velocity, average velocity, discharge, bed material.1. INTRODUCTION
The main difference in the velocity distribution at a cross section between laminar and turbulent flow is the location of the maximum velocity along the longitudinal bed slope (x-direction, or stream wise direction). For most turbulent flow situations, the maximum stream wise velocity occurs somewhat below the water surface, while in laminar flow, the maximum velocity occurs at the water surface. However, this distinction may not hold true for turbulent flow with shallow water depth and high velocities, in which case the maximum velocity may be near or at the water surface. When the water level in the main channel increases it enters in the plain area which results flood in the area. The velocity in the main channel and the flood plain area is not same. Velocity distribution is important in rivers for bank protection, navigation, water intakes and sediments transport and deposition on the bank. It is very important in sewerage system for predicting which sewers are overloaded. As Manning’s “n” is a function of flow velocity, the velocity also depends upon the roughness of the bed material. If there is vegetation in the bed of a channel then the velocity in the bed of the channel becomes very less. Vegetated or grassed channels are the most complicated to design because of the roughness of the channel. According to Chow, the measured maximum velocity in ordinary channel appears to occur at free surface. The average velocity is measured as:
Average Velocity,
Surface velocity Vs is related to Vav as:
Where,
Vav = Average velocity, Vs = Surface Velocity
V0.2 = Velocity below at a distance 0.2of depth,
V0.8 = Velocity below at a distance 0.8of depth
K = Coefficient which varies from 0.8 to 0.95
.
The roughness of the channel causes the curvature of vertical velocity distribution curve to increase. The influence of surface wind on velocity distribution is practically zero also the sides of channel have no influence on velocity distribution in the central zone. Central zone exists in rectangular channel only when B>5 to 10 times of depth of flow.
© 2016, IRJET ISO 9001:2008 Certified Journal Page 946 Fig – 2: Effect of Roughness in velocity distribution profile
2.
Literature Review :
Hooper Frank F. and Kohler Steven L. (2000) explained that the velocity distribution in natural stream depends upon the shape of the, size of the channel, roughness of the channel and slope of the channel. He also explained that the mean velocity is taken as the average of velocities at the 0.2 and 0.8 of depth. Yen B. C. (2002)found that the velocity in open channel is effected by theroughness of the bed and wall material of the channel, the cross sectional area as well as the slope of the channel. Plant William J. at.el. in 2003 measured the surface velocity by microwave sensor and computed the discharge using mean velocities using the surface velocity along with the measured depth. In 2008 Marjang Nat developed a turbulent model for computing surface velocity coefficient and discharge for prismatic open channel by using three dimensional hydraulic modelling. Dabrowski W. D and Polak U. (2010) described how to compute the the critical depth position in a flume throat and suggested an improved method for computation of flow rate measurement accurately. Patel K. (2012) examined the different velocity profile in open channel by considering the different roughness constant and different flow rate and described the hydraulic model and testing of different hydraulic structure in open channel flow. Bousmar D. (2013) investigated that in case of compound-channel, theoretical head in the subsections and experimental discharge distribution between subsections clearly gives the result that this discharge distribution should also be accounted for as an upstream boundary condition. He suggested that the criteria of a minimum length to floodplain width ratio L/B > 35.
Yonesi H. A. et.al. (2013) did experiments and found the velocity distribution at the entrance, middle and end of the channel and with the help of experimental data about the discharge between the main channel and floodplain, roughness coefficient, depth, average velocity he evaluate the slope of the channel and again he compared the result
with the prismatic channel. Faruque M. A. A. (2014) carried out lot of laboratory experiments and found the effect of roughness and Reynolds number on mean velocity in both outer and inner scaling.
3.
Laboratory Experiment
In water recourses laboratory of Assam downtown University a number of experiments are conducted in a channel with 6m length, 0.30m wide and 0.46m deep. Three discharges Q1 = 3.84 x 10⁻³ cum/sec, Q2 = 3.67 x 10⁻³ cum/sec and Q3 = 1.2 x 10⁻³ cum/sec each with original bed material, grass carpet and PVC are taken (fig 3, 4 & 5). The velocity in each case is measured with the help of Pitot tube Table 1 represents the different experimental cases the three discharges with three different bed materials.
.
TABLE - 1
No. Discharge(m3/sec) Material
Case-1 Case-2 Case-3
Q1=3.84 x 10⁻³
Original Bed
Material Grass Carpet PVC Case-4 Case-5 Case-6
Q2=3.67 x 10⁻³
Original Bed
Material Grass Carpet PVC Case-7 Case-8 Case-9
Q3=1.2 x 10⁻³
Original Bed
[image:2.595.303.569.284.732.2]Material Grass Carpet PVC
Fig –3: Flow in the original bed
material of the channel
Fig–4: Flow through grass
carpet
Fig –5: Flow through PVC
© 2016, IRJET ISO 9001:2008 Certified Journal Page 947 Fig 6 shows the variation of the coefficient “K” at discharge
[image:3.595.36.289.170.306.2]Q1. It is observed from the graph that the variation in “K” is maximum in case of grass carpet which is approximately 22% and in case of original bed material it is approximately 8% while it is minimum in PVC which is approximately 3%.
Fig – 7: Coefficient “K” for discharge Q2 with different bed material
Fig 7 shows the variation of the coefficient “K” at discharge Q2. From the graph it is observed that the variation in “K” is maximum in case of grass carpet which is approximately 13% and in case of original bed material it is approximately 12% while it is minimum in PVC which is approximately 10%.
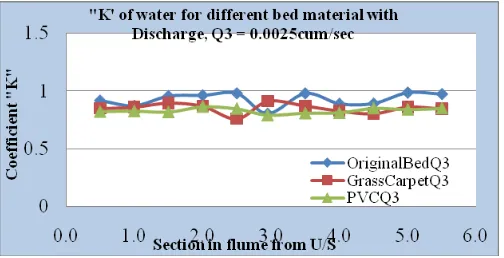
Fig - 8: Coefficient “K” for discharge Q3 with different bed material
Fig 8 shows the variation of the coefficient “K” at discharge Q3. From the graph it is observed that the variation in “K” is maximum in case of grass carpet which is approximately 13% and in case of original bed material it is approximately 12% while it is minimum in PVC which is approximately 10%.
[image:3.595.311.557.345.531.2]Fig – 9: Velocity Distribution for Q1 with Different Bed Material
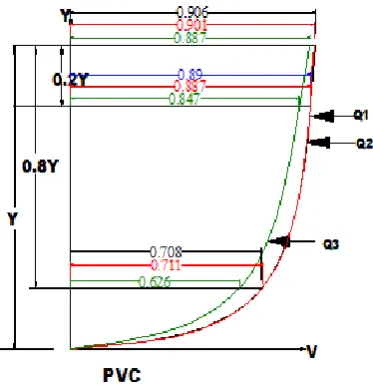
[image:3.595.37.289.434.563.2]© 2016, IRJET ISO 9001:2008 Certified Journal Page 948 Fig – 11: Velocity Distribution for Q3 with Different Bed
Material
Fig No. 12 Velocity Distribution for Original Bed Material with Different Discharge
Fig – 13: Velocity Distribution for Grass Carpet with Different Discharge
Fig -14: Velocity Distribution for PVC with Different Discharge
4.
Observations and Discussion
[image:4.595.39.245.362.554.2] [image:4.595.309.496.366.560.2]© 2016, IRJET ISO 9001:2008 Certified Journal Page 949 varying bed material of the channel affects the coefficient
“K”.In the velocity distribution, from the graph (from Fig 9 to Fig 11) it is found that for the original bed material has rough surface and the curve is coming smooth for PVC. It is also observed that for grass carpet the velocity is minimum at the bottom of the channel and is maximum at the surface. The grass carpet is acting as vegetation in the channel. Due to dense vegetation, the Manning’s “n” is also more which proves that if Manning’s “n” is more the velocity will be less. A graph of velocity distribution for the same material with different discharges are also been plotted and found that as the discharge decreases the velocity distribution becomes smooth for the original bed material and for the grass carpet (Fig 12 & Fig 13) which conclude that the velocity distribution also depends upon the discharge. For PVC it is smooth for all the discharge (Fig 14).
5. CONCLUSIONS
The velocity distribution and coefficient “K” for a channel of fixed slope mainly depends upon the discharge and the bed material of the channel. As the original bed of the channel has a combination of different material the velocity distribution shows rough bed whereas the velocity distribution for the PVC shows a smooth bed even for the grass carpet also the velocity distribution is coming smooth. As the discharge decreases, the depth of water decreases and due to the effect of roughness of the bed, the average velocity decreases which results in decreasing the value of “K”. Since some part of the original bed material is rough so percentage of variation in coefficient “K” becomes more.
REFERENCES
[1] Browski W. D and Polak U. “Flow Rate Measurements By
Flumes” Fourteenth International Water Technology Conference, IWTC 14 2010, Cairo, Egypt, 2010
[2] Bousmar D., Riviere N., Proust S., Paquier A., Morel R.,
Zech Y., “Upstream discharge distribution in compound-channel Flumes”, HAL Id: hal-00842385, 2013.
[3] Daboussi Olfa, Hafsia Zouhaier and Moussa Mahmoud,
“SECOND ORDER MODELLING OF COMPOUND OPEN-CHANNEL FLOWS”
[4] Faruque M. A. Al et.al, “Open Channel Flow Velocity
Profiles for Different Reynolds Numbers and Roughness Conditions”, International Journal of Research in Engineering and Technology, Volume: 03 , 2014
[5] Hooper Frank F. and Kohler Steven L., “Measurement of
Stream Velocity and Discharge” Manual of Fisheries Survey Methods II, Chapter-19, 2000
[6] Marjang Nat, “Calculated Surface Velocity Coefficients for
Prismatic Open Channels by Three-Dimensional Hydraulic Modeling” DigitalCommons@USU, 2008
[7] Patel Kaushal, “Mathematical Model of Open Channel Flow
for Estimating Velocity Distribution through Different Surface Roughness and Discharge”, International Journal of Advanced Engineering Technology, E-ISSN 0976-3945, IJAET/Vol.III/ Issue I/January-March, 2012/252-253.
[8] Patra K.C., et.al. Analysis of Depth Averaged Velocity in
Meandering Compound Channels
[9] Plant William J. et.al. , “Stream flow Properties from Time
Series of Surface Velocity and Stage” , Journal of Hydraulic Engineering, 2003
[10] Pu J. H., “Universal Velocity Distribution for Smooth and