M E T H O D
Open Access
A high-throughput approach to identify genomic
variants of bacterial metabolite producers at the
single-cell level
Stephan Binder, Georg Schendzielorz, Norma Stäbler, Karin Krumbach, Kristina Hoffmann, Michael Bott and
Lothar Eggeling
*Abstract
We present a novel method for visualizing intracellular metabolite concentrations within single cells ofEscherichia coliandCorynebacterium glutamicumthat expedites the screening process of producers. It is based on transcription factors and we used it to isolate new L-lysine producing mutants ofC. glutamicumfrom a large library of
mutagenized cells using fluorescence-activated cell sorting (FACS). This high-throughput method fills the gap between existing high-throughput methods for mutant generation and genome analysis. The technology has diverse applications in the analysis of producer populations and screening of mutant libraries that carry mutations in plasmids or genomes.
Background
Since the first demonstration of microbial product for-mation more than a century ago [1], vitamins, antibiotics, nucleotides, amino acids and organic acids have been produced in ever increasing quantities. For example, about three million tonnes of sodium glutamate are pro-duced each year as a small microbial molecule. Bacterial synthesis is increasingly also used for the production of small molecules not naturally made by bacteria, such as pharmaceutical intermediates [2,3] or biofuels [4]. The combination of the successful application of microbial synthesis, progress in synthetic biology and changes in the global economy that necessitate intensified use of renewable raw materials indicates that microbial metabo-lite production will continue to expand.
Microorganisms are not naturally designed for profit-able metabolite formation, however, and there is an unre-lenting need to optimize strains and pathways. Current strain improvement strategies make use of a variety of methods for engineering and isolating microbial variants with the desired traits. These techniques fall into two major categories:‘rational’methods, which involve the targeted alteration of known genetic information; and
‘random’approaches, which are typically based on the creation of mutant libraries containing nondirected changes in genotype with subsequent screening for phe-notypes of interest. Both approaches have been successful but the use of mutant libraries has proven to have dis-tinct advantages. The reason is that the exact genomic mutations necessary to adapt the cellular metabolism for increased product synthesis are often difficult to predict, and that‘rational’methods are restricted to known tar-gets. Random approaches with subsequent screening for the phenotype of interest enable us to overcome these difficulties. They have made possible the commercial-scale production of a variety of compounds, such as the unrivaled formation of succinate byEscherichia coli[5] or riboflavin byBacillus subtilis[6]. Random and combi-natorial approaches were also profitably used for the development of plasmid-encoded targets for the optimi-zation of pathway flux inE. coli. This has been demon-strated with amorpha-4,11-diene production [2], which is an artemisinin precursor that is effective for the treat-ment of malaria, or with taxadiene production [3], an intermediate of the anticancer compound taxol.
However, with few exceptions, the evaluation of methods that utilize random approaches currently requires the culti-vation of individual clones to determine production prop-erties. This presents an obstacle. While high-throughput
* Correspondence: [email protected]
Institut für Bio- und Geowissenschaften, IBG-1: Biotechnologie, Forschungszentrum Jülich GmbH, D-52425 Jülich, Germany
(HT) techniques for introducing genetic diversity and for product analysis or sequencing are well developed [7], comparable strategies for the identification and isolation of high-producer bacterial cells are still lacking. The opportu-nity to directly monitor product formation within single cellsin vivowould add a new dimension to the characteri-zation and development of microbial producers.
Here, we present examples of the monitoring of intra-cellular metabolite concentrations in single bacterial cells and demonstrate in an HT screen the isolation of new bacterial producer cells, as well as the identification of novel mutations based on whole-genome sequencing. The sensors we use are based on transcription factors (TFs) that regulate the transcriptional output of a target promoter in response to a cytosolic metabolite. Whereas the use of TFs to construct whole-culture biosensors for the detection of environmental small-molecule pollutants has long been established [8], this same approach has remained largely untranslated with respect to single-cell analysis and library screening. TFs are naturally targeted to a variety of small ligands, ranging from amino acids to sugars, sugar phosphates, vitamins, antibiotics, oxoacids and lipids [9]. They can also be engineered to obtain altered specificity [10,11], as recently summarized in a comprehensive review [12]. Coupling transcription of the target gene to a reporter protein provides a molecular device for recognition. This has already been successfully applied for screening in plate-based assays using colony color or colony size [10,13], for instance. Here we make full use of intracellular recognition of a specific metabo-lite in single cells by applying an autofluorescent protein as reporter and also fluorescence-activated cell sorting (FACS). This enables the isolation in HT screens of new bacterial small-molecule producers with random muta-tions introduced into the genome that enhance produc-tion of the molecule of interest, and we present an example of this.
Results
Schematic of approach
The workflow for HT selection of genomic variants of metabolite producers consists of the following steps: a) design of a suitable metabolite sensor, b) generation of genetic diversity in genomes of cells carrying the sensor, c) screening of the mutant library and selection of single producer cells via FACS, d) verification and characteri-zation of mutants, and e) sequencing for target identifi-cation. We developed sensors for intracellular detection of basic amino acids, as well as of L-serine and O-acetyl-serine, and demonstrated the feasibility of the approach by isolating bacteria producing L-lysine from a library of randomly mutagenized wild-type (WT) cells, culminating in the identification of new useful muta-tions by whole-genome sequencing.
Design of L-lysine sensor
To develop a sensor suitable for intracellular L-lysine detection, we focused on the LysR-type transcriptional regulator (LTTR) LysG ofCorynebacterium glutamicum. This protein senses elevated concentrations of basic amino acids, causing transcription of its target genelysE, which encodes a basic amino acid exporter [14]. To explore the application of this native regulatory device to the conversion of an intracellular metabolite concentra-tion into an optical output, we characterized the interac-tion of LysG with its target region upstream oflysEin a series of electrophoretic mobility shift assays (Figure S1 in Additional file 1). These data were used to construct the metabolite sensor pSenLys shown in Figure S2 in Additional file 1. It contained lysG, together with the LysG-binding site in front of thelysEpromoter driving transcription ofeyfpcoding for enhanced yellow fluores-cent protein (EYFP). In addition, Ptac-drivencrimsonwas incorporated as a second fluorescence protein in the vec-tor backbone. All strains and plasmids are listed in Table S1 in Additional file 1.
Characterization of L-lysine sensor
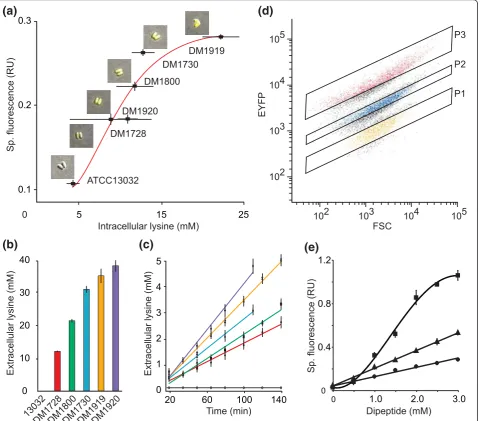
The WT ofC. glutamicumdoes not excrete L-lysine but there is a genealogy of defined mutants that exhibit increased L-lysine productivity [15]. We determined the cytosolic L-lysine concentration by silicone oil centrifu-gation and the response of pSenLys in these strains. The WT had a cytosolic L-lysine concentration below 5 mM, while the defined producers had steady-state concentra-tions ranging from roughly 8 to 25 mM (Figure 1a). A clear increase in specific EYFP fluorescence in cultures is seen with increasing cytosolic L-lysine concentration. As evident from microscopic inspection (insets in Figure 1a), pSenLys is a tool for visualizing cytosolic L-lysine con-centrations also within single cells. The range of the cyto-solic L-lysine concentration covered translates into a dynamic range of signal output of 8.3-fold.
had not previously been taken into consideration. As demonstrated for the production of antibiotics [16], amino acids [17], and biofuels [4], small-molecule pro-duction depends on export proteins. The ability to manipulate export activities permits cytosolic concentra-tion of the substrate to be increased or decreased, which may be helpful, for example, when using strains that
display high productivity and high cytosolic concentra-tions of substrate.
To isolate single cell producers by HT flow cytometry, it is essential that the cells can be separated according to their fluorescent properties. To demonstrate that this is the case with pSenLys, sensor-carrying cells of WT, DM1728, and DM1919 grown in glucose minimal medium
0.4 0.8 1.2
1.0 2.0 3.0
0
Dipeptide (mM)
Sp. fluorescence (RU)
0
5
4
3
2
1
0
20 60 100 140
Extracellular lysine (mM)
Time (min) 40
30
20
10
0
Extracellular lysine (mM)
13032
DM1728DM1800DM1730DM1919DM1920
102 103 104 105 105
104
103
102
EYFP
FSC
P1 P2 P3
Intracellular lysine (mM)
Sp. fluorescence (RU)
0 0.3
0.2
0.1
5 15 25 ATCC13032
DM1728
DM1800 DM1730
DM1919
DM1920
(d)
(a)
[image:3.595.60.541.90.511.2](b)
(c)
(e)
Figure 1Characterization of lysine sensor and lysine-producing recombinant cells. (a) Cytosolic L-lysine concentration inC. glutamicum WT and five defined lysine producer strains, all carrying pSenLys, and specific fluorescence (Sp. fluorescence) of the cultures. Error bars give the means of three independent cultures for each strain. Fitting the data to the Hill equation describes the signal transfer function by annappof 3.19
were mixed in a 1:1:1 ratio to give a total of 4 × 10⁷cells ml-1. This cell population was analyzed via FACS at a rate of 103events per second. Clear differentiation of the popu-lation was achieved on the basis of intensity of the EYFP signal (Figure 1d). Three further qualities were assessed (Table S2 in Additional file 1): 1) the sorting specificity achieved using gates P1 to P3 resulted in the selection of≥ 89% of the L-lysine producer expected within the respec-tive gate; 2) the recovery of viable single cells for each gate was≥84%; 3) when DM1728 was mixed with a 10,000-fold excess of WT cells and then re-isolated, 92% of the prepared cells were DM1728.
LysG recognizes L-arginine and L-histidine in addition to L-lysine [14]. Peptide addition is a proven method to increase the cytosolic pool of a specific amino acid in C. glutamicum or E. coli [18,19]. The fluorescence response ofC. glutamicumcarrying pSenLys to exogen-ously applied Lys-Ala is similar to endogenexogen-ously synthe-sized L-lysine (Figure 1e). The fluorescence response due to Arg-Ala supply was substantially greater, and that to His-Ala was greater still, which may indicate a higher affi-nity of these ligands for LysG.
Further metabolite sensors
To assess the general utility of TFs for reporting on small-molecules at the single-cell level, we constructed pSenArg based on ArgP ofE. colicontrollingargOtranscription as a function of cytosolic L-arginine [20]. When pSenArg was assayed for dipeptide responsiveness, the addition of Arg-Ala resulted in fluorescentE. colicells (Figure 2, left),
with fluorescence increasing in proportion to the dose of dipeptide (Figure S3 in Additional file 1). As additional metabolite sensors, pSenSer and pSenOAS were constructed (Table S1 in Additional file 1), suitable for L-serine (Figure 2, middle), andO-acetyl-L-serine detec-tion inC. glutamicum(Figure 2, right), respectively.
Generation of genetic diversity and library screening To demonstrate the feasibility of metabolite sensors for HT screening of mutant libraries, we introduced chromo-somal mutations into the WT ofC. glutamicumcarrying pSenLys by treatment with MNNG (N-methyl-N’ -nitro-N-nitrosoguanidine), one of the most effective chemical mutagens for creating genetic diversity [21]. While the separation of mixtures of defined producers could be achieved using FACS (Figure 1d), direct processing of the mutagenized library with FACS was not successful. We used a liquid culture recovery and enrichment step taking into account that metabolically active cells require 2 h for Crimson synthesis (Figure S4 in Additional file 1), and that cells derived from the glycerol stock have to be incu-bated for 6 h on minimal medium to establish host-speci-fic EYFP fluorescence. The suspension of mutagenized cells from glycerol stock (200μl) was diluted into minimal medium containing IPTG (isopropyl-b -D-thiogalactopyra-noside and, after 2 h, 6.5 × 10⁶Crimson-positive cells were sorted in minimal medium. After cultivation for a further 22 h, 350 EYFP positive cells were spotted onto minimal medium plates. Of these, 270 grew into colonies within 48 h.
pSenSer
E. coli
C. glutamicum
[image:4.595.56.544.470.664.2]pSenArg
pSenOAS
Producer verification
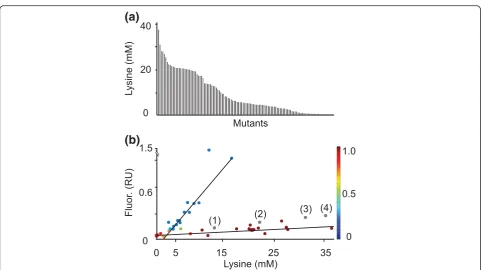
The 270 colonies were used to inoculate microtiter plates, to enable HT screening of cultures using 0.75 ml minimal medium. L-lysine was detected in culture supernatants of 185 clones. Re-cultivation of 120 clones (Figure 3a) revealed that the L-lysine concentration ran-ged from 0.2 to 37 mM. Four clones accumulated 3.6 to 5 mM L-lysine plus 0.6 to 0.8 mM L-arginine and one clone 24.9 mM L-lysine plus 0.6 mM L-arginine. None of the mutants accumulated L-histidine, possibly due to the length of this pathway and its tight regulation.
[image:5.595.57.539.363.633.2]Of the 120 mutants, 40 were selected randomly, and their culture fluorescence and growth recorded (Figure S5 in Additional file 1). Using an expectation maximization algorithm [22], two clusters relating specific fluorescence to L-lysine accumulation were apparent (Figure 3b). The cluster represented by the lower curve showed characteris-tics similar to the defined recombinant strains used in Figure 1a, which are included in Figure 3b as gray dots and numbered in parentheses. This cluster includes the mutants of main interest. Mutants in the other cluster show in part extreme fluorescence at a comparatively low
extracellular L-lysine accumulation. Since we screened for high fluorescence, it is possible that mutants with reduced L-lysine export activity - and therefore increased intracel-lular L-lysine concentration - accumulated. This finding warrants further exploration. Cellular export activity is influenced by a number of parameters, including the lipid environment of carriers and the composition of the outer membrane [4,16], which may cause mutants to excrete metabolites at different rates than the WT does.
Gene analysis in 40 mutants
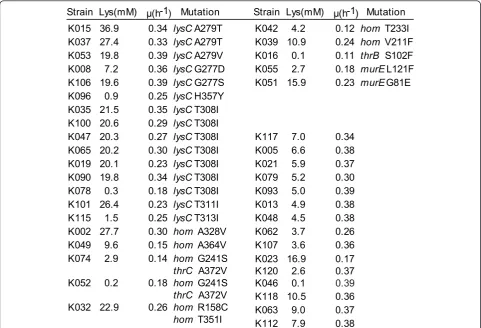
We sequencedlysC, which encodes aspartate kinase in the 40 mutants described above (Figures 4 and 5a). To date, all L-lysine producers described have a mutation inlysC, preventing feedback inhibition of aspartate kinase activity by the concerted action of L-lysine plus L-threonine [23]. In 15 of the mutants that we found,lysCwas mutated, including seven cases of the known mutationlysC-T308I, which is located in the regulatoryb-subunit of the aspar-tate kinase [23]. New mutations - lysC-H357Y, lysC-T313I,lysC-G277D, andlysC-G277S - that also affect the regulatory subunit (Figure S6 in additional file 1) were
1.5
0.6
0 5 15 25 35
Fluor
. (
RU
)
Lysine (mM) (1) (2)
(3) (4) 1.0
0.5
0 0
40
20
0
Lysine
(mM
)
Mutants
(a)
(b)
found. We also sequencedhomin all 40 mutants, since reduced homoserine dehydrogenase activity reduces L-threonine availability in cells and thus also reduces kinase activity (Figure 5a). Current approaches to engineering L-lysine synthesis rely on just a singlehommutation [15]. Seven of the mutants isolated in this study carry novel mutations inhom(Figure 4).
In the remaining 18 mutants, neitherlysCnorhomwas mutated. We therefore sequencedthrBandthrCas further genes of L-threonine synthesis (Figure 5a). In strain K016 the mutationthrB-S102F was identified and in strain K074 the mutation thrC-A342V was found (Figure 4). The introduction of four selected mutations into the WT chro-mosome resulted in significant L-lysine concentrations (Table S3 in Additional file 1), demonstrating that these new mutations cause increased L-lysine formation.
Genome sequence of mutant K051
We performed whole-genome sequencing on strain K051, which has no mutation inlysC,hom,thrB, orthrC
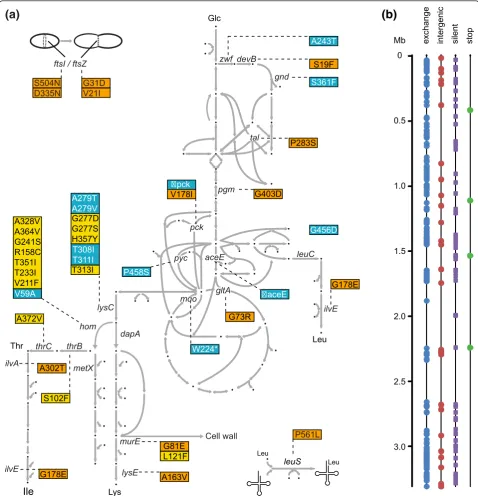
yet accumulates L-lysine up to a concentration of 15.9 mM. Paired-end sequencing on an Illumina HiSeq 2000 provided more than 20 million reads. Trimming and mapping to the WT genome (NC_000913) [15] resulted in a 260-fold coverage (Table S4 in Additional file 1). The genome sequence of strain K051 has been deposited at the European Nucleotide Archive under accession number HE802067. Within K051, 268 SNPs are manifest. They are unevenly distributed in the genome (Figure 5b). The number of SNPs is within the range observed for E. colitreated with MNNG [24]. All of the SNPs identi-fied are transitions, as expected with this mutagen, the majority of them resulting in amino acid exchanges (Fig-ure 5b; Table S1 in Additional file 2). In addition, NCgl0863, which carries the amino acid exchange G54D, was partially duplicated, with the variant copy placed 6,108 bp distant from NCgl0863 in an intergenic region.
We searched the mutations in K051 for genes known to increase L-lysine production and to participate in the pathway from glucose uptake up to L-lysine excretion
Lys(mM) ȝ(h-1) Mutation Strain Lys(mM) ȝ(h-1) Mutation
Strain
K015 36.9 0.34 lysC A279T K042 4.2 0.12 hom T233I
K037 27.4 0.33 lysC A279T K039 10.9 0.24 hom V211F
K053 19.8 0.39 lysC A279V K016 0.1 0.11 thrB S102F
K008 7.2 0.36 lysC G277D
K023 16.9 0.17
K106 19.6 0.39 lysC G277S K051 15.9 0.23 murE G81E
K096 0.9 0.25 lysC H357Y
K118 10.5 0.36
K035 21.5 0.35 lysC T308I
K063 9.0 0.37
K100 20.6 0.29 lysC T308I
K112 7.9 0.38
K047 20.3 0.27 lysC T308I K117 7.0 0.34
K065 20.2 0.30 lysC T308I K005 6.6 0.38
K019 20.1 0.23 lysC T308I K021 5.9 0.37
K090 19.8 0.34 lysC T308I K079 5.2 0.30
K078 0.3 0.18 lysC T308I K093 5.0 0.39
K101 26.4 0.23 lysC T311I K013 4.9 0.38
K115 1.5 0.25 lysC T313I K048 4.5 0.38
K002 27.7 0.30 hom A328V K062 3.7 0.26
K049 9.6 0.15 hom A364V K107 3.6 0.36
K074 2.9 0.14 hom G241S
thrC A372V
K055 2.7 0.18 murE L121F
K052 0.2 0.18 hom G241S
thrC A372V
K120 2.6 0.37
K032 22.9 0.26 hom R158C
hom T351I
[image:6.595.57.539.89.417.2]K046 0.1 0.39
(Figure 5a). Specific mutations inzwfandgndin the pen-tose phosphate pathway are known to increase L-lysine formation due to an increased supply of NADPH [25]; K051 has mutations indevBandtalthat could also be
effective. K051 also has mutations inpckandgltA, genes encoding phosphoenolpyruvate carboxykinase and citrate synthase, where reduced activities are known to increase the supply of pyruvate and oxaloacetate for L-lysine zwf
tal
pgm
pck
pyc aceE
gltA
hom lysC
lysE ilvE
gnd devB
leuC
mqo
murE ilvA
dapA thrC thrB
metX
Cell wall
Lys
Ile
Thr Leu
Glc
A279T A279V
G277D G277S H357Y
T313I
T308I T311I
A243T
aceE
S19F
V178I
pck
G456D
G73R
V59A
A328V A364V G241S R158C T351I T233I V211F
A372V
A302T
G178E A163V
G81E L121F
P458S
G403D
S361F
P283S
S102F
W224*
ilvE
G178E
0
0.5
1.0
1.5
2.0
2.5
3.0
Mb exchange intergenic silent sto
p
(b)
Leu
leuS Leu
P561L
ftsI / ftsZ
S504N D335N
[image:7.595.58.537.89.586.2]G31D V21I
(a)
synthesis [26,27]. Also, mutations of branched-chain amino acid metabolism have been demonstrated to increase lysine formation, and K051 carries a mutation in ilvE, as well as in the Leu-tRNA synthetase LeuS. Of par-ticular interest was themurEmutation (murE-G81E) in K051. This gene encodes UDP-N-acetylmuramyl-tripep-tide synthetase, an enzyme that utilizes D, L-diaminopi-melate as a substrate, as does the D, L-diaminopiL-diaminopi-melate decarboxylase, in L-lysine synthesis.
Influence ofmurEmutations on L-lysine synthesis
To determine whether themurE-G81E mutation identi-fied could generate increased L-lysine formation, we introduced it by allelic replacement into DM1132, DM1728, DM1730, DM1800, and DM1933. The new strains were cultivated in parallel to their ancestor strains in shake flask cultivations and final L-lysine con-centrations were determined after 48 h. As shown in Figure 6, the mutation caused strong L-lysine accumula-tion when introduced into the WT DM1132 and also DM1728, the strains that have few mutations and which form comparatively little L-lysine. Yet even with the best producer available, strain DM1933, a significant increase in L-lysine accumulation was determined. Given this finding, we sequencedmurEin the remaining mutants isolated by our HT technology that had no identified mutation (Figure 4), and foundmurE-L121F in strain K055. Introduction of this specific mutation into the five defined L-lysine producers yielded increased L-lysine accumulation, too (Figure 6). Whether the increases with the two murE mutations identified were due to increased availability of D, L-dia-minopimelate for L-lysine synthesis, or whether a global regulatory effect pushes synthesis of D, L-diaminopime-late remains to be studied.
Discussion
The key requirement for visualization of single cells with elevated concentrations of a small molecule of interest is the availability of suitable in vivo sensor systems with sufficient sensitivity and specificity. There are a large number of options for developing customized reporters sensing intracellular metabolites. They are based on nat-ural molecular recognition, allosteric switching, and gene regulation behavior of proteins and RNA. Every system has its own specific advantages and disadvan-tages, and the reader is referred to recent reviews on the numerous ideas and ongoing developments in the field [12,28-33]. Whereas protein sensors based on periplas-mic binding proteins and Förster resonance energy transfer (FRET) in principle enable concentration deter-minations in real time, use of TFs relies on expression of the reporter gene. This delay between ligand binding and the corresponding phenotypic change is not a
disadvantage in developing or characterizing recombi-nant cells since stable genetically encoded genotypes are sought. With respect to the use of TFs in metabolite sensing for screening purposes, the present work based on LysR of C. glutamicum is the first example where the responsiveness of the optical output to an existing intracellular metabolite concentration is given, and where a TF-based sensor is used in an HT screen apply-ing FACS for the isolation of new bacterial small-mole-cule producers.
The responsiveness of TFs previously characterized is deduced from the external addition of the effector mole-cule and whole culture response. Although this may only be of limited significance for screening, it is disad-vantageous for precise characterization since various processes such as active uptake, active export, diffusion and degradation of effector might result in a different cytosolic concentration than that present extracellularly. In the case of LysG-based pSenLys, we determined a detection range of 4 to 25 mM intracellular L-lysine. Sensor responsiveness is characterized by an analog-like response that, when fitted to the Hill equation, is described bynappof 3.19 ± 1.45. It enables the differen-tiation of WT from medium- and high-level producer cells (Table S2 in Additional file 1). As our intracellular determinations and the comparison of the isogenic strains with one copy and two copies of lysErevealed, the effective range of detection may be extended by altering export activity. This could be of relevance for further improvement of good producers. Sensor response and its usefulness will depend on the interplay between the cytosolic concentration of the small-mole-cule and export activity, as well as on the affinity of the sensor to the effector and target promoter site.
Thus, sensors for a significant number of small mole-cules of biotechnological or pharmaceutical importance are within reach.
Whereas the WT ofC. glutamicumdoes not excrete L-lysine, cytosolic sensing and FACS as an efficient screen enabled the rapid isolation of 185 new mutants accumu-lating L-lysine in the culture supernatant. The current number of genes where mutations cause increased L-lysine synthesis is about 12 [37,38]. These mutations serve to increase flux through the L-lysine pathway itself, or to increase the pyruvate and oxaloacetate pool, or the NADPH supply. However, there are still unknown muta-tions to be discovered, since it is known that in an L-lysine-producing mutant developed over decades in classical screenings, many genes of biosynthesis pathways exhibit increased expression [39], and in a similarly derived L-arginine producer, arginine biosynthesis genes are highly expressed in a manner not achievable by plas-mid-encoded expression [40]. Our approach provided
alleles of known genes, and this is very useful for geno-mic reconstruction of producers where advantageous mutations are combined, and alleles may result in differ-ent productivity [2,41]. The number of 268 SNPs presdiffer-ent in K051 is too great to study their individual impact on product formation, but new possibilities might be offered when more genome sequences become available. Striking was themurEmutation present in K051. We suggest that the catalytic activity of UDP-N-acetylmuramoyl-L-alanyl-D-glutamate:meso-diaminopimelate ligase in MurE-G81E is reduced, with the consequence that more D, L-diami-nopimelate is available for L-lysine synthesis. MurE of C. glutamicumis similar to MurE of Mycobacterium tuberculosisandE. coli, the crystal structures of which are known [42]. From these, it can be deduced that G81E is close to the nucleoside part of UDP-MurNAc-L-Ala-D-Glu, and L121F in the second mutant identified is close to the ATP-binding site. Thus, a reduced activity is meaningful, and in line with the increased L-lysine
80
60
40
20
0
murE
(WT)
murE
L121F
murE
G81E
DM1
132
DM1728 DM1800 DM1730 DM1933
Extracellular lysine
(mM
[image:9.595.58.540.87.450.2])
formation obtained with all strains when themurE muta-tions were introduced in their genomes. It is also in line with the reduced growth rates of these new recombinants (Table S5 in Additional file 1), since less D, L-diaminopi-melate is channeled towards cell wall synthesis. An alter-native to simple mass balance effects is that a lack of cell wall building blocks initiates a global response that has a positive effect on biosynthesis.
We applied one of our transcriptional sensors for HT screening of a mutant library with chromosomal muta-tions, but the same principle may also be explored for HT screening of cells carrying plasmid libraries. This is attractive, since many pharmaceuticals currently pro-duced microbially, such as amorpha-4,11-diene, taxa-diene and lycopene, use plasmid-encoded biosynthesis pathways, for example, in E. coli [2,3,13]. Use of an appropriate sensor combined with FACS-assisted screening may significantly accelerate the development of producers for such small molecules, too. The HT selection routine for mutant isolation closes the gap between HT generation of mutant libraries and HT sequencing technologies, and further applications of sen-sing small molecules in sen-single cells are in progress, such as the verification of producer population homogeneity and time-lapse microscopy ofC. glutamicumin micro-fluidic chips [43].
Conclusions
This work examines visualization of the intracellular con-centration of small molecules at the single cell level by the use of specific TFs. It opens up various possibilities to characterize and analyze single cells in populations with respect to their cytosolic small molecule concentra-tion. We have demonstrated that the visualization of L-lysine combined with HT sorting of genomic mutant libraries via FACS enables the isolation of new mutants. Together with whole-genome sequencing, this therefore establishes rapid access to new mutations to achieve more efficient product formation. In addition to the screening of cells with genomic mutations, the system is also suitable for screening cells with plasmid libraries to identify more efficient product accumulation.
Materials and methods
Sensor plasmid construction
The regulatory units were synthesized (LifeTechnologies GmbH, 64293 Darmstadt, Germany) and cloned into pJC1 using the restriction sites BamHI and SalI. An overview of the sensor plasmids is shown in Figure S2 in Additional file 1. The entire plasmid sequences were deposited at EMBL under the accession numbers HE583184 (pSenLys), HE583185 (pSenArg), HE583186 (pSenSer), and HE583187 (pSenOAS1).
FACS analysis and cell sorting
Cells were diluted to an optical density below 0.1 and immediately analyzed by a FACS ARIA II high-speed cell sorter (BD Biosciences, Franklin Lakes, NJ USA 07417) using excitation lines at 488 and 633 nm and detecting fluorescence at 530 ± 15 nm and 660 ± 10 nm at a sample pressure of 70 psi. Data were analyzed using BD DIVA 6.1.3 software. The sheath fluid was sterile fil-tered phosphate-buffered saline. Electronic gating was set to exclude non-bacterial particles on the basis of for-ward versus side scatter area. For sorting of Crimson- or EYFP-positive cells the next level of electronic gating was set to exclude non-fluorescent cells. Background was estimated using non-induced C. glutamicum for sorting of Crimson-positive cells. When sorting EYFP-positive cells, non-producing C. glutamicumcells were used.
Mutagenesis and library screening
C. glutamicumATCC13032 carrying pSenLys was grown in 5 ml BHI complex medium (Difco Laboratories Inc., Detroit, MI 48201, USA) containing 25μg ml-1 kanamy-cin to an optical density of 5 to ensure exponential growth. Whole-cell mutagenesis was done by the addi-tion of MNNG dissolved in dimethyl sulfoxide (DMSO) to a final concentration of 0.1 mg ml-1and incubation for 15 mintes at 30°C. The treated cells were washed twice with 45 ml NaCl, 0.9% (w/v), resuspended in 10 ml BHI and regenerated for 3 h at 30°C and 180 rpm. Mutant cells were stored at -30°C as cryostocks in BHI contain-ing 40% glycerol (w/v). Of the initial cells, 46.2% survived the MNNG treatment and among the surviving cells approximately 16% were auxotrophs. For FACS screen-ing, the mutant stock population containing 7.5 × 10⁸ viable cells per ml was diluted 1:100 in 20 ml minimal medium containing 0.1 mM IPTG to induce expression of the far-red fluorescent protein Crimson, which was taken as an indicator of metabolically active cells. After 2 h of cultivation, 6.5 × 10⁶cells were analyzed by FACS and 2 × 10⁶ Crimson-positive cells collected in fresh 20 ml minimal medium without IPTG. After cultivation for a further 22 h, 1.8 × 10⁷cells were screened and 350 EYFP-positive cells spotted on Petri dishes containing minimal medium. Colonies grown after 48 h at 30°C were further analyzed.
HT cultivation and culture fluorescence analysis
and fluorescence. The medium used for FP cultivations was the MOPS-buffered salt medium CGXII [45], with 4% glucose as substrate and 25μg ml-1kanamycin to select for maintenance of pSenLys. For offline cultiva-tions, FPs were cultivated on a Microtron high-capacity microplate incubator operating at a shaker speed of 990 rpm, throw ø 3 mm (Infors AG, CH-4103 Bottmingen, Switzerland). Shake flask cultivations were used to com-pare the consequences of the murE mutations for L-lysine accumulation (Figure 4b); these were done in 500 ml baffled Erlenmeyer flasks with 50 ml medium. The medium was the same as used in FP cultivations, except that the phosphate concentration was reduced by half. Cells pregrown in CGXII medium were used as inocula for all cultivations.
Amino acid quantification
Amino acids were quantified as theiro-phthaldialdehyde derivatives via high-pressure liquid chromatography using a uHPLC 1290 Infinity system (Agilent, Santa Clara, CA 95051, USA) equipped with a Zorbax Eclipse AAA C18 3.5 micron 4.6 × 75 mm and a fluorescence detector. As eluent, a gradient of 0.01 M Na-borate buffer pH 8.2 with increasing concentrations of methanol was used, and detection of the fluorescent isoindole derivatives was at
lex= 230 nm andlem= 450 nm.
Determination of cytosolic amino acid concentrations and amino acid export rates
Cells were pregrown as for FP cultivations for 24 h. They were washed once with fresh CGXII medium at room temperature and transferred into new medium in FPs to give an initial optical density of 10, which corresponds to 3.0 mg (dry weight) ml-1. Cultures were incubated at 30°C on the Microtron high-capacity microplate incubator as above. Samples were processed at regular intervals to sepa-rate extra- and intracellular fluid by silicone oil centrifuga-tion [46]. For the resulting fraccentrifuga-tions, amino acids were quantified as described above. The intracellular volume used to calculate the internal amino acid concentration was 1.6μl mg (dry weight)-1. When peptides were added (Figure 1e; Figure S3 in Additional file 1) mixtures of di-peptides at a final concentration of 3 mM were used, such as 1 mM Arg-Ala plus 2 mM Ala-Ala, to ensure that a constant supply of Arg-Ala-derived Arg is present over time in the cytosol at the lower Arg-Ala concentrations.
Epifluorescence microscopic analysis
Fluorescence imaging was performed using a fully motor-ized inverted microscope (Nikon Eclipse Ti) equipped with a focus assistant (Nikon PFS), Apo TIRF 100× Oil DIC N objective, NIKON DS-Vi1 color camera, ANDOR LUCA R DL604 camera, Xenon fluorescence light source and standard filters for EYFP detection (lex= 490 to 510
nm;lem= 520 to 550 nm). Differential interference con-trast (DIC) microscopy images as well as fluorescence images were captured and analyzed using the Nikon NIS Elements AR software package. Prior to analysis, cells were fixed on soft agarose-covered glass slides.
Additional material
Additional file 1: Supplementary Tables S1 to S4 and Figures S1 to S6. Table S1: strains used. Table S2: quality assessment of sorting cells carrying pSenLys. Table S3: L-lysine formation with mutations introduced by reverse engineering. Table S4: statistics on whole-genome sequencing of strain K051. Table S5: growth rates ofmurEmutants. Figure S1: isolation of LysG and characterization of the LysG binding site. Figure S2: the vector pSenLys and general configuration of sensor plasmids. Figure S3: peptide-dose response curves with sensor-carryingE. coliandC. glutamicum. Figure S4: development of Crimson and EYFP signals in mixtures of ATCC13032 with DM1728 over time. Figure S5: growth curves and fluorescence of 40 mutant cultures. Figure S6: structural presentation of LysC and localization of mutations identified.
Additional file 2: All mutations ofC. glutamicumstrain K051.
Abbreviations
bp: base pair; EYFP: enhanced yellow fluorescent protein; FACS: fluorescence-activated cell sorting; FP: Flowerplate; HT: high throughput; IPTG: isopropyl-β-D-thiogalactopyranoside; MNNG: N-methyl-N’ -nitro-N-nitrosoguanidine; SNP: single nucleotide polymorphism; TF: transcription factor; WT: wild type.
Acknowledgements
This work was funded by the German Federal Ministry of Education and Research, FlexFit project, support code 0315589A. We thank Jessica Schneider, Thomas Bekel and Stephan Hans for support in genome analysis, Peter Droste for his introduction to the Omix software, Katharina Nöh for statistical analyses, Jan Marienhagen for useful discussions, Alexander Grünberger for preparation of microscopic pictures, and Tino Polen for help with data analysis.
Authors’contributions
SB performed experimental studies and the FACS analyses. GS constructed sensors and did the graphic work. NS and KH contributed to sensor construction. The determination of pool concentrations and export rates was done by KK, MB contributed to manuscript writing, and LE designed the project and wrote the paper. All authors have read and approved the manuscript for publication.
Competing interests
The authors declare that they have no competing interests.
Received: 2 April 2012 Revised: 16 May 2012 Accepted: 28 May 2012 Published: 28 May 2012
References
1. Demain AL, Adrio JL:Strain improvement for production of
pharmaceuticals and other microbial metabolites by fermentation.Prog Drug Res2008,65:253-289.
2. Tsuruta H, Paddon CJ, Eng D, Lenihan JR, Horning T, Anthony LC, Regentin R, Keasling JD, Renninger NS, Newman JD:High-level production of amorpha-4,11-diene, a precursor of the antimalarial agent artemisinin, inEscherichia coli.PLoS One2009,4:e4489.
4. Dunlop MJ, Dossani ZY, Szmidt HL, Chu HC, Lee TS, Keasling JD, Hadi MZ, Mukhopadhyay A:Engineering microbial biofuel tolerance and export using efflux pumps.Mol Syst Biol2011,7:487.
5. Zhang X, Jantama K, Moore JC, Jarboe LR, Shanmugam KT, Ingram LO: Metabolic evolution of energy-conserving pathways for succinate production inEscherichia coli.Proc Natl Acad Sci USA2009, 106:20180-20185.
6. Abbas CA, Sibirny AA:Genetic control of biosynthesis and transport of riboflavin and flavin nucleotides and construction of robust biotechnological producers.Microbiol Mol Biol Rev2011,75:321-360. 7. Mardis ER:A decade’s perspective on DNA sequencing technology.
Nature2011,470:198-203.
8. Gu MB, Mitchell RJ, Kim BC:Whole-cell-based biosensors for environmental biomonitoring and application.Adv Biochem Eng2004, 87:269-305.
9. Binder S, Mustafi N, Frunzke J, Bott M, Eggeling L:Sensors for the detection of intracellular metabolites. WIPO Patent Application WO/ 2011/138006.[http://patentscope.wipo.int/search/en/detail.jsf?docId= WO2011138006&recNum=37&docAn=EP2011002196&queryString=ALL:nmr% 2520AND%2520DP:2011&maxRec=7293].
10. Tang S-Y, Cirino PC:Design and application of a mevalonate-responsive regulatory protein.Angew Chem Int Ed Engl2010,50:1084-1086. 11. Galvão TC, de Lorenzo V:Transcriptional regulators à la carte:
engineering new effector specificities in bacterial regulatory proteins.
Curr Opin Biotechnol2006,17:34-42.
12. Gredell JA, Frei CS, Cirino PC:Protein and RNA engineering to customize microbial molecular reporting.Biotechnol J2011,7:477-499.
13. Klein-Marcuschamer D, Ajikumar PK, Stephanopoulos G:Engineering microbial cell factories for biosynthesis of isoprenoid molecules: beyond lycopene.Trends Biotechnol2007,25:417-424.
14. Bellmann A, Vrljic M, Pátek M, Sahm H, Krämer R, Eggeling L:Expression control and specificity of the basic amino acid exporter LysE of Corynebacterium glutamicum.Microbiology2001,147:1765-1774. 15. Ohnishi J, Mitsuhashi S, Hayashi M, Ando S, Yokoi H, Ochiai K, Ikeda M:A
novel methodology employingCorynebacterium glutamicumgenome information to generate a new L-lysine-producing mutant.Appl Microbiol Biotechnol2002,58:217-223.
16. Nikaido H:Molecular basis of bacterial outer membrane permeability revisited.Microbiol Mol Biol Rev2003,67:593-656.
17. Eggeling L:Microbial Metabolite Export in Biotechnology.Encyclopedia of Industrial Biotechnology: Bioprocess, Bioseparation, and Cell Technology Hoboken, NJ: John Wiley & Sons, Inc.; 2009.
18. Tavori H, Kimmel Y, Barak Z:Toxicity of leucine-containing peptides in Escherichia colicaused by circumvention of leucine transport regulation.
J Bacteriol1981,146:676-683.
19. Bellmann A, Vrljic M, Patek M, Sahm H, Kramer R, Eggeling L:Expression control and specificity of the basic amino acid exporter LysE of Corynebacterium glutamicum.Microbiology-Sgm2001,147:1765-1774. 20. Nandineni MR, Gowrishankar J:Evidence for an arginine exporter
encoded by yggA (argO) that is regulated by the LysR-type transcriptional regulator ArgP inEscherichia coli.J Bacteriol2004, 186:3539-3546.
21. Adelberg EA, Mandel M, Ching Chen GC:Optimal conditions for mutagenesis by N-methyl-N’-nitro-N-nitrosoguanidine in K12.Biochem Biophys Res Commun1965,18:788-795.
22. Geoffrey McLachlan DP:Finite Mixture ModelsHoboken, NJ: John Wiley & Sons, Inc.; 2000.
23. Yoshida A, Tomita T, Kuzuyama T, Nishiyama M:Mechanism of concerted inhibition ofα2β2-type hetero-oligomeric aspartate kinase from
Corynebacterium glutamicum.J Biol Chem2010,285:27477-27486. 24. Studier FW, Daegelen P, Lenski RE, Maslov S, Kim JF:Understanding the
differences between genome sequences ofEscherichia coliB strains REL606 and BL21(DE3) and comparison of theE. coliB and K-12 genomes.J Mol Biol2009,394:653-680.
25. Ikeda M, Ohnishi J, Hayashi M, Mitsuhashi S:A genome-based approach to create a minimally mutatedCorynebacterium glutamicumstrain for efficient L-lysine production.J Ind Microbiol Biotechnol2006,33:610-615. 26. Petersen S, de Graaf AA, Eggeling L, Möllney M, Wiechert W, Sahm H:In
vivo quantification of parallel and bidirectional fluxes in the anaplerosis ofCorynebacterium glutamicum.J Biol Chem2000,275:35932-35941.
27. van Ooyen J, Noack S, Bott M, Reth A, Eggeling L:Improved L-lysine production withCorynebacterium glutamicumand systemic insight into citrate synthase flux and activity.Biotechnol Bioeng2012,109:2070-2081. 28. Zhang J, Lau MW, Ferré-D’Amaré AR:Ribozymes and riboswitches:
modulation of RNA function by small molecules.Biochemistry2010, 49:9123-9131.
29. East AK, Mauchline TH, Poole PS:Biosensors for ligand detection.Adv Appl Microbiol2008,64:137-166.
30. van der Meer JR, Belkin S:Where microbiology meets microengineering: design and applications of reporter bacteria.Nat Rev Microbiol2010, 8:511-522.
31. Tracy BP, Gaida SM, Papoutsakis ET:Flow cytometry for bacteria: enabling metabolic engineering, synthetic biology and the elucidation of complex phenotypes.Curr Opin Biotechnol2010,21:85-99. 32. Zhang F, Keasling J:Biosensors and their applications in microbial
metabolic engineering.Trends Microbiol2011,19:323-329. 33. Liang JC, Bloom RJ, Smolke CD:Engineering biological systems with
synthetic RNA molecules.Mol Cell2011,43:915-926.
34. Tang S-Y, Fazelinia H, Cirino PC:AraC regulatory protein mutants with altered effector specificity.J Am Chem Soc2008,130:5267-5271. 35. de Las Heras A, de Lorenzo V:Cooperative amino acid changes shift the
response of the sigma-dependent regulator XylR from natural m-xylene towards xenobiotic 2,4-dinitrotoluene.Mol Microbiol2011,79:1248-1259. 36. Krueger M, Scholz O, Wisshak S, Hillen W:Engineered Tet repressors with
recognition specificity for the tetO-4C5G operator variant.Gene2007, 404:93-100.
37. Kelle R, Hermann T, Bathe B:L-lysine production.InHandbook of Corynebacterium glutamicum.Edited by: Eggeling L, Bott M. Boca Raton, FL: CRC Press, Taylor 2005:465-488.
38. Becker J, Zelder O, Hafner S, Schroder H, Wittmann C:From zero to hero -design-based systems metabolic engineering of Corynebacterium glutamicum for L-lysine production.Metab Eng2011,13:159-168. 39. Hayashi M, Ohnishi J, Mitsuhashi S, Yonetani Y, Hashimoto S-I, Ikeda M:
Transcriptome analysis reveals global expression changes in an industrial L-lysine producer ofCorynebacterium glutamicum.Biosci Biotechnol Biochem2006,70:546-550.
40. Ikeda M, Mitsuhashi S, Tanaka K, Hayashi M:Reengineering of a Corynebacterium glutamicumL-arginine and L-citrulline producer.Appl Environ Microbiol2009,75:1635-1641.
41. Mockel B, Eggeling L, Sahm H:Threonine dehydratases of Corynebacterium glutamicumwith altered allosteric control: their generation and biochemical and structural analysis.Mol Microbiol1994, 13:833-842.
42. Bertrand JA, Auger G, Fanchon E, Martin L, Blanot D, van Heijenoort J, Dideberg O:Crystal structure of UDP-N-acetylmuramoyl-L-alanine:D-glutamate ligase fromEscherichia coli.EMBO J1997,16:3416-3425. 43. Grunberger A, Paczia N, Probst C, Schendzielorz G, Eggeling L, Noack S,
Wiechert W, Kohlheyer D:A disposable picolitre bioreactor for cultivation and investigation of industrially relevant bacteria on the single cell level.
Lab Chip2012,12:2060-2068.
44. Huber R, Ritter D, Hering T, Hillmer A-K, Kensy F, Müller C, Wang L, Büchs J: Robo-Lector - a novel platform for automated high-throughput cultivations in microtiter plates with high information content.Microb Cell Fact2009,8:42.
45. Stolz M, Peters-Wendisch P, Etterich H, Gerharz T, Faurie R, Sahm H, Fersterra H, Eggeling L:Reduced folate supply as a key to enhanced L-serine production byCorynebacterium glutamicum.Appl Environ Microbiol 2007,73:750-755.
46. Klingenberg M, Pfaff E:Means of terminating reactions.InOxidation and Phosphorylation. Volume 10.Edited by: Ronald W. Estabrook MEP: Academic Press; 1967:680-684.
doi:10.1186/gb-2012-13-5-r40