F r e q u e n c y w e i g h ti n g s b a s e d o n
s u bj e c tiv ely d o m i n a n t s p e c t r a l
r a n g e s
To rij a M a r ti n e z , AJ, Fli n d ell, I H, S e lf, R H a n d To rij a M a r ti n e z,
An t o ni o J
T i t l e
F r e q u e n c y w ei g h ti n g s b a s e d o n s u bj e c tiv ely d o mi n a n t
s p e c t r al r a n g e s
A u t h o r s
To rij a M a r ti n e z, AJ, F li n d e ll, I H, S elf, R H a n d To rij a
M a r ti n e z, An t o ni o J
Typ e
C o nf e r e n c e o r Wo r k s h o p I t e m
U RL
T hi s v e r si o n is a v ail a bl e a t :
h t t p :// u sir. s alfo r d . a c . u k /i d/ e p ri n t/ 5 3 2 4 1 /
P u b l i s h e d D a t e
2 0 1 5
U S IR is a d i gi t al c oll e c ti o n of t h e r e s e a r c h o u t p u t of t h e U n iv e r si ty of S alfo r d .
W h e r e c o p y ri g h t p e r m i t s , f ull t e x t m a t e r i al h el d i n t h e r e p o si t o r y is m a d e
f r e ely a v ail a bl e o nli n e a n d c a n b e r e a d , d o w nl o a d e d a n d c o pi e d fo r n o
n-c o m m e r n-ci al p r iv a t e s t u d y o r r e s e a r n-c h p u r p o s e s . Pl e a s e n-c h e n-c k t h e m a n u s n-c ri p t
fo r a n y f u r t h e r c o p y ri g h t r e s t r i c ti o n s .
Frequency weightings based on subjectively
dominant spectral ranges
Antonio J. Torija, Ian H. Flindell, Rod Self
ISVR, University of Southampton, SO17 1BJ Southampton, UK.
Summary
The optimisation of frequency weightings for the assessment of environmental and transportation noise has been an enduring research theme, with no real consensus achieved, other than increasing acknowledgement that the widespread adoption of the A-frequency weighting is an essentially arbitrary choice. Based on the results of 4 illustrative case studies, we propose a simple hypothesis that the 'best' frequency weighting in any specific context depends on which part of the frequency spectrum is subjectively dominant. This hypothesis helps to explain why different frequency weighting schemes appear to work 'best' in different situations and allows the selection of frequency weightings for use in assessment procedures to be carried out on a more rational and possibly less partisan basis. Further work is of course necessary to develop and extend our hypothesis to a wider range of different circumstances.
PACS no. 43.50.Rq, 43.50.Qp, 43.50.Lj
1.
Introduction
1The significant influence of frequency spectrum-related factors on perceived annoyance has been highlighted by several studies carried out on transportation noise [1,2].
Even with the extensive attention in the literature, and widespread adoption in standards and regulations, still there is a lack of consensus about the frequency filter to be applied for evaluating transportation noise. Based on the physical dominance of the different frequency ranges: low (20-250Hz), mid (315-2000 Hz) and high (2500-20000 Hz) frequencies; diverse and, often opposing results regarding the most influential spectral region on perceived annoyance have been found by different research studies [2-6]. Because of this disparity of results, authors have pointed out one or another of the existing frequency weightings as the most appropriate for assessing transportation noise annoyance. All these findings seem to indicate that still there is an open debate, and that the adoption of the A-frequency weighting by most national standards is an essentially arbitrary choice.
On the other hand, since the main purpose of transportation noise assessment is to estimate the magnitude of community annoyance, the issue arising should not be the identification of the
physically dominant frequency spectrum range, but the identification of the one perceived as subjectively dominant.
The hypothesis underlying this research is that the 'optimal' frequency weighting in any specific context depends on which part of the frequency spectrum is subjectively dominant, and it is based on the findings presented by Torija and Flindell [7], where it was stated that whichever is the physically dominant part of the frequency spectrum is not necessarily a good guide to what part of the spectrum will be perceived as subjectively dominant.
In order to illustrate this hypothesis the results of 4 laboratory studies are presented and discussed. Thus, the performance of the application of A- and D-weighting filters is analyzed for assessing annoyance evoked by (i) urban road traffic noise under outdoor and indoor conditions and (ii) by urban traffic noise with low and high low-frequency content after the erection of different noise barriers.
2.
Road traffic noise under outdoor and
indoor conditions
2.1. Laboratory study under outdoor conditions
middle/high-frequency 3rd-octave bands (Fig. 1), was used as the basis for all sounds reproduced in the listening tests. Three frequency filters were applied for boosting or cutting the low-
frequency (LF),
mid-frequency (MF), or high-frequency (HF)
ranges. Twelve filtered sounds were produced
by applying each filter with -9dB, -3 dB,
+3dB and +9 dB relative gain setting.
Figure 1. Frequency spectra of master recording road traffic noise stimuli used in outdoor and indoor laboratory studies.
A five point semantic scale, according to
standard ISO/TS 15666 [8]: “Not at all”,
“Slightly”,
“Moderately”,
“Very”,
and
“Extremely”, was used for assessing perceived
annoyance.
2.2. Laboratory study under indoor conditions
In [9] a continuous urban road traffic noise was filtered for simulating typical frequency dependent attenuation of double glazing sealed units made up from 3mm glass, 3 mm air gap, and 3 mm glass, according to the valued reported in [10]. Moreover, artificial reverberation at 0.5 second reverberation time was added to increase the subjective realism of the intended indoor simulation. The outdoor and indoor frequency spectra are shown at Fig. 1. Low pass and high pass shelf filters were applied for boosting or cutting the
LF, or mid/high-frequency (MHF)
ranges by +9 dB, +3 dB, -3 dB, and -9 dB to
the simulated indoor filtered sound, thereby
producing 8 different sounds for the listening
tests.
In this laboratory study, the perceived
annoyance was assessed using the relative
magnitude
estimation
(RME)
method.
According to this method, the participants
rated subjective annoyance of each stimulus
numerically against a defined reference sound
which was given an arbitrary rating of 100 (so
that each reported annoyance value was
referred to 100).
2.3. A- and D-weighting for assessing road traffic noise annoyance
In Fig. 2, it is observed that the application of the D-filter (right) for frequency weighting the sound level achieves higher correlations with reported annoyance than the A-filter (left) for the specific sounds used in [7]. In [7], for the filtered road traffic sounds tested, and under outdoor conditions, the MF and especially HF contents were found to be subjectively dominant. However, as indicated by the results shown in Fig. 2, the relatively high LF content in urban road traffic noise should not be neglected. Under outdoor conditions, the D-weighting better accounts for the difference in contribution to road traffic evoked subjective annoyance of LF, MF and HF ranges. Meanwhile, the A-weighing underestimates the contribution of LF and HF ranges, as can be seen in Fig. 2 – left (triangle and circle symbols). Fig. 3 shows the linear relationship between A- and D-weighted sound levels and reported annoyance for the stimuli used in the listening test presented in [9]. In [9], even under conditions where LF content was physically dominant (indoor conditions), it was found that changes in LF content made smaller contributions to reported annoyance than might be inferred from such physical dominance. Indeed, under the tested indoor conditions, equivalent changes in LF and MHF content led to similar changes in reported annoyance. Under these conditions, and as it is seen in Fig. 3, the A-weighting filter accounts for the difference in contribution to subjective annoyance between LF and MHF ranges, while D-weighting filter overestimates the contribution of LF.
-10 0 10 20 30 40 50 60 70
31,5 50 80 125 200 315 500 800 1250 2000 3150 5000 8000
12500
Sound
L
evel
(d
B)
1/3rd-octave Bands (Hz) Road Traffic Outdoor Road Traffic Indoor
EuroNoise 2015 31 May - 3 June, Maastricht
A.J. Torija et al.: Frequency...
[image:3.595.57.292.220.452.2]Figure 2. Linear relationship between the A-weighted (left) and D-weighted (right) sound levels and perceived annoyance. Triangle, square and circle symbols correspond to LF, MF and HF filter gain, respectively.
Figure 3. Linear relationship between the A-weighted (left) and D-weighted (right) sound levels and perceived annoyance. Triangle and circle symbols correspond to LF and MHF filter gain, respectively.
3.
Urban road traffic noise with noise
barriers
3.1. Stimuli and procedure
For this laboratory study, two master recordings of continuous urban road traffic noise were selected,
one with relatively high LF content (similar to the MF content), hereafter called RT1, and another one with relatively low LF content (as compared to the MF content), hereafter called RT2. These two master recordings were used as the basis for synthesising all the experimental sounds for the listening tests.
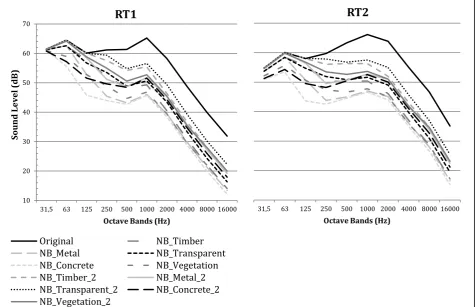
To each of these two road traffic sounds, a series of frequency filters were applied for simulating the insertion loss (IL) generated by the presence of a selection of 10 noise barriers. The IL provided for each of the noise barriers was obtained from [11]. It should be noted that in [11], only 5 noise barriers were presented, so that the other 5 noise barriers simulated here were derived by keeping the same spectral pattern but reducing the simulated IL by 6 dB. In Fig. 4, the frequency spectra of each of the original master recording and of each of the filtered sound are shown. The 30 participants in this listening experiment assessed the annoyance evoked by all the filtered sounds using the RME method. Thus, for each master road traffic sound, RT1 and RT2, the participants rated subjective annoyance of each of the 10 stimuli (road traffic sounds filtered to simulate the presence of the 10 noise barriers) numerically against the reference sounds which were give
an arbitrary rating of 100.
3.2. A- and D-weighted sound levels vs. perceived annoyance
As can be seen in Table I, for the road traffic noise with low LF content (RT2), the application of A and D filters for the frequency weighting of the sound level achieves similar results in assessing the perceived annoyance of the 10 filtered noise barrier sounds.
PA = 0,1104·LAeq - 4,6554 R² = 0,5019
1,5 2 2,5 3 3,5 4 4,5
55 60 65 70 75 80
Per ceived Ann oy ance (F ive -Poi nt s Sca le Un it s (1 to 5 ))
A-weighted Sound Level (dBA)
PA = 5,66·LAeq - 187,44 R² = 0,97
PA = 4,30·LDeq - 166,23 R² = 0,84 60 80 100 120 140 160
40 50 60 70 80
R elat ive M agn it u d e Es ti m at io n o f Per cei ve d Ann oyan ce Sound Level
PA = 0,11·LAeq - 4,66 R² = 0,50
1,5 2 2,5 3 3,5 4 4,5
55 60 65 70 75 80
Per ceived Ann oy ance (F ive -Poi nt s Sca le Uni ts (1 to 5))
A-weighted Sound Level (dBA)
PA = 0,17·LDeq - 9,43 R² = 0,78
60 65 70 75 80 85
D-weighted Sound Level (dBD)
EuroNoise 2015
31 May - 3 June, Maastricht
[image:4.595.58.537.62.273.2] [image:4.595.59.290.370.610.2]Figure 4. Frequency spectra of the original and frequency filtered sounds to simulate the presence of the different noise barriers, for master urban road traffic noises 1 (RT1 – high LF content) and 2 (RT2 – low LF content).
However, when the road traffic noise has high LF content (RT1), higher correlations with reported annoyance are obtained by using the D-weighting filter than by using the A-weighting filter. These results are consistent with the results presented in Section 2.3, i.e. for typical road traffic noise under outdoor conditions, the frequency regions subjectively dominant are MF, and especially HF, but if there is a strong component in the LF region, this should not be neglected.
With high LF content, simulation of the presence of the different noise barriers made the LF region subjectively more important, and as observed in Table I, the A-weighting filter then underestimated the effect of the LF contribution, whilst the D-weighting filter was able to give a better representation of the LF contribution.
Table I. Results of the Linear Regression analysis (N=10) for estimating perceived annoyance from A-weighted and D-A-weighted sound levels. p≤ 0.05.
RT1
R2 Adjusted
R2 Standard Error of the Estimate
A-weighting 0.83 0.81 3.66 D-weighting 0.90 0.89 2.80
RT2
R2 Adjusted
R2 Standard Error of the Estimate
A-weighting 0.97 0.97 2.32 D-weighting 0.97 0.97 2.45
4.
Conclusions
In this paper, 4 case studies are presented to illustrate the hypothesis that the 'optimal' frequency weighting in any specific context depends on which part of the frequency spectrum is subjectively dominant. According to the results presented here, the selection of the most appropriate frequency weighting filter should not be made solely on the basis of which frequency region is physically dominant, but should also take into subjective dominance into account.
10 20 30 40 50 60 70
31,5 63 125 250 500 1000 2000 4000 8000 16000
So
u
n
d
L
ev
el
(d
B)
Octave Bands (Hz)
RT1
Original NB_Timber
NB_Metal NB_Transparent
NB_Concrete NB_Vegetation
NB_Timber_2 NB_Metal_2
NB_Transparent_2 NB_Concrete_2 NB_Vegetation_2
31,5 63 125 250 500 1000 2000 4000 8000 16000
Octave Bands (Hz)
RT2
EuroNoise 2015 31 May - 3 June, Maastricht
A.J. Torija et al.: Frequency...
[image:5.595.58.535.66.373.2] [image:5.595.304.546.440.607.2]Differences in the relative contributions to subjective annoyance made by different spectral regions, i.e. low-, mid- and high-frequencies, are important for the selection of optimum frequency weightings.
This finding may help to explain why different frequency weighting curves appear to work 'best' in different situations, but could also inform the selection of frequency weightings for use in assessment procedures to be carried out on a more rational and possibly less biased basis.
Of course, further work would be necessary to develop and extend this research hypothesis to a wider range of different circumstances, i.e. across a wider range transportation and other noise sources and contexts.
Acknowledgement
This work is funded by the University of Malaga and the European Commission under the Agreement Grant no. 246550 of the seventh Framework Programme for R & D of the EU, granted within the People Programme, «Co-funding of Regional, National and International Programmes» (COFUND), and the Ministerio de Economía y Competitividad (COFUND2013-40259).
References
[1] G. Leventhall: A review of published research on low frequency noise and its effect. Report for Department for Environment, Food and Rural Affairs (DEFRA),
May 2003. Available at
http://archive.defra.gov.uk/environment/quality/noise/ research/lowfrequency/documents/lowfreqnoise.pdf. (date last viewed 11/06/14).
[2] H. G. Leventhall: Low frequency noise and annoyance. Noise and Health 6 (2004) 59-72.
[3] M. E. Nilsson: A-weighted sound pressure level as an indicator of perceived loudness and annoyance of road-traffic sound. Journal of Sound and Vibration 302 (2007) 197-207.
[4] G. R. Watts: A comparison of noise measures for assessing vehicle noisiness. Journal of Sound and Vibration 180 (1995) 493-512.
[5] N. J. Versfeld, J. Vos: Annoyance caused by sounds of wheeled and tracked vehicle. Journal of the Acoustical Society of America 101 (1997) 2677-2685. [6] J. Kim, C. Lim, J. Hong, S. Lee: Noise-induced
annoyance from transportation noise: Short-term responses to a single noise source in a laboratory. Journal of the Acoustical Society of America 127 (2009) 804-814.
[7] A. J. Torija, I. H. Flindell: Differences in subjective loudness and annoyance depending on the road traffic noise spectrum. Journal of the Acoustical Society of America 135 (2014) 1-4.
[8] ISO, Acoustics-Assessment of noise annoyance by means of social and socio-acoustic surveys.
ISO/TS15666:2003(E). 2003, ISO: Geneva, Switzerland.
[9] A. J. Torija, I. H. Flindell: The subjective effect of low frequency content in road traffic noise. Journal of the Acoustical Journal of America 137 (2015) 189-198. [10] J. D. Quirt: Sound transmission through windows II.
Double and triple glazing. Journal of the Acoustical Society of America 74 (1983) 534-542.
[11] J. Y. Hong, H. S. Jang, J. Y. Jeon: Evaluation of noise barriers for soundscape perception through laboratory experiments. Proceedings of the Acoustics 2012, Nantes, France, 2012, pp. 2159-2162.
EuroNoise 2015
31 May - 3 June, Maastricht