R E S E A R C H
Open Access
Assembly of 500,000 inter-specific catfish
expressed sequence tags and large scale
gene-associated marker development for
whole genome association studies
Shaolin Wang
1, Eric Peatman
1, Jason Abernathy
1, Geoff Waldbieser
2, Erika Lindquist
3, Paul Richardson
3,
Susan Lucas
3, Mei Wang
3, Ping Li
1, Jyothi Thimmapuram
4, Lei Liu
4, Deepika Vullaganti
4, Huseyin Kucuktas
1,
Christopher Murdock
2, Brian C Small
2, Melanie Wilson
5, Hong Liu
1, Yanliang Jiang
1, Yoona Lee
1, Fei Chen
1,
Jianguo Lu
1, Wenqi Wang
1, Peng Xu
1, Benjaporn Somridhivej
1, Puttharat Baoprasertkul
1, Jonas Quilang
1,
Zhenxia Sha
1, Baolong Bao
1, Yaping Wang
1, Qun Wang
1, Tomokazu Takano
1, Samiran Nandi
1, Shikai Liu
1,
Lilian Wong
1, Ludmilla Kaltenboeck
1, Sylvie Quiniou
2, Eva Bengten
5, Norman Miller
5, John Trant
6, Daniel Rokhsar
3,7,
Zhanjiang Liu
1*, the Catfish Genome Consortium
Abstract
Background:Through the Community Sequencing Program, a catfish EST sequencing project was carried out through a collaboration between the catfish research community and the Department of Energy’s Joint Genome Institute. Prior to this project, only a limited EST resource from catfish was available for the purpose of SNP identification.
Results:A total of 438,321 quality ESTs were generated from 8 channel catfish (Ictalurus punctatus) and 4 blue catfish (Ictalurus furcatus) libraries, bringing the number of catfish ESTs to nearly 500,000. Assembly of all catfish ESTs resulted in 45,306 contigs and 66,272 singletons. Over 35% of the unique sequences had significant similarities to known genes, allowing the identification of 14,776 unique genes in catfish. Over 300,000 putative SNPs have been identified, of which approximately 48,000 are high-quality SNPs identified from contigs with at least four sequences and the minor allele presence of at least two sequences in the contig. The EST resource should be valuable for identification of microsatellites, genome annotation, large-scale expression analysis, and comparative genome analysis.
Conclusions:This project generated a large EST resource for catfish that captured the majority of the catfish transcriptome. The parallel analysis of ESTs from two closely related Ictalurid catfishes should also provide powerful means for the evaluation of ancient and recent gene duplications, and for the development of high-density microarrays in catfish. The inter- and intra-specific SNPs identified from all catfish EST dataset assembly will greatly benefit the catfish introgression breeding program and whole genome association studies.
* Correspondence: [email protected]
1The Fish Molecular Genetics and Biotechnology Laboratory, Department of Fisheries and Allied Aquacultures and Program of Cell and Molecular Biosciences, Aquatic Genomics Unit, 203 Swingle Hall, Auburn University, Auburn, AL 36849, USA
Background
Catfish is the major aquaculture species in the United States, accounting for over 60% of all US aquaculture production. While channel catfish (Ictalurus punctatus) accounts for the majority of commercial aquaculture production, the closely related blue catfish (Ictalurus furcatus) possesses several economically important traits that led to the production of an inter-specific hybrid (channel catfish female × blue catfish male) available for commercial use [1]. This specific hybrid shows strong heterosis and superior performance traits in disease resistance, growth rate, feed conversion efficiency, pro-cessing yields, and seinability. Channel catfish is also an important model species for the study of comparative immunology, reproductive physiology, and toxicology. The channel catfish immune system is among the best characterized of any fish species, with decades of research leading to identification and characterization of catfish immune genes [2,3], establishment of clonal functionally distinct lymphocyte cell lines [4], characteri-zation of much of the machinery of catfish innate [5,6] and adaptive immunity and production of panels of spe-cific monoclonal antibodies for detection of catfish immunocytes [7-9].
Genome research requires the development of a num-ber of resources that facilitate both structural and func-tional analysis of the genome. Many of the required resources have been developed in catfish, including a large number of polymorphic markers [10,11], linkage maps [12-14], bacterial artificial chromosome (BAC) libraries [15,16], physical maps [17,18], and BAC end sequences (BES) [19,20]. However, expressed sequence tag (EST) resources were low from catfish [21-26], hin-dering both functional and comparative genome analysis in catfish. Large numbers of ESTs have been produced for most model species as well as a number of agricultu-rally important species [27-32], including cattle (1.5 mil-lion), swine (1.4 milmil-lion), chicken (600,000), Atlantic salmon (471,000), and rainbow trout (281,000). The availability of such EST resources has allowed efficient gene discovery and gene identification in these species, and rapid progress has been made through comparative genome analysis in understanding structural, organiza-tional, and functional properties of the genomes of these species.
A whole genome sequence is not available for most aquaculture species. In the absence of the whole genome sequence of catfish, we initiated this large-scale EST project to provide transcriptomic resources in channel catfish and blue catfish. These ESTs will serve as resources for gene discovery and gene identification, supply the framework for high-density microarray plat-forms, provide a foundation for the analysis of
full-length cDNAs, and assist in the identification of genetic markers such as microsatellites and single nucleotide polymorphisms (SNPs). In this study, we have taken a unique inter-specific approach. The inter-specific approach will help develop markers that are inter-speci-fic and species speciinter-speci-fic. These resources will also be of great use for comparative genome analysis. The inter-specific EST approach to produce parallel EST resources from two closely related Ictalurid species will allow the resolution of some of the most difficult issues in teleost genome research, such as paralog confusions involving duplicated genomes [33-35]. Here we report the genera-tion and analysis of nearly 500,000 ESTs from catfish, including 354,377 ESTs from channel catfish and 139,475 ESTs from blue catfish.
Results
cDNA libraries and EST sequencing
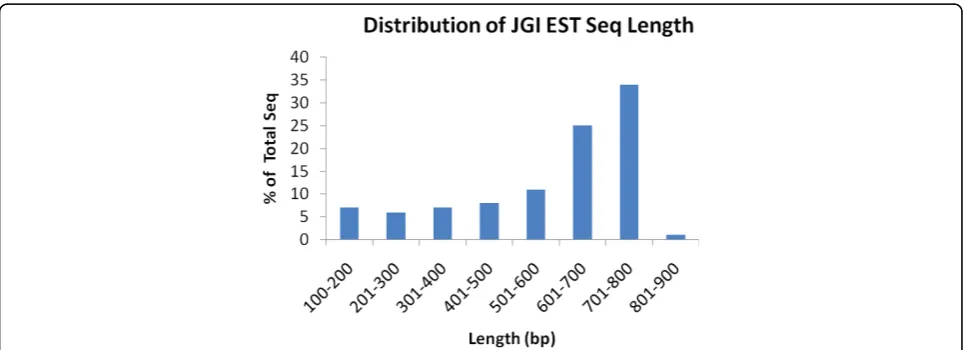
Twelve cDNA libraries were constructed from various tis-sues, organs, and cell lines, including four blue catfish libraries and eight channel catfish libraries (Table 1). More than 600,000 sequencing reactions were attempted to sequence a total of 307,296 cDNA clones from both ends. A total of 438,321 ESTs were generated from this project, of which 128,711 sequences were from blue catfish and 309,610 were from channel catfish (Table 1). Of these EST sequences, 219,831 were sequenced from the 5’end of the transcripts, and 218,490 were sequenced from the 3’end. A total of 194,136 clones had paired reads from both 5’ and 3’ends of the same transcripts. The lengths of the ESTs range from 100 to 877 bp, with an average length of 576 bp and a median length of 655 bp (Figure 1). Addition of these sequences to the 10,764 blue catfish ESTs and 44,767 channel catfish ESTs in GenBank before the start of this project increased the number of catfish ESTs to almost a half million sequences (139,475 blue catfish ESTs and 354,377 channel catfish ESTs; Table 1). The ESTs from blue catfish and channel catfish have been deposited in GenBank under accession numbers [GenBank: FC996013-FC999999, FD000001-FD380635 and GH640296-GH693994].
EST assembly
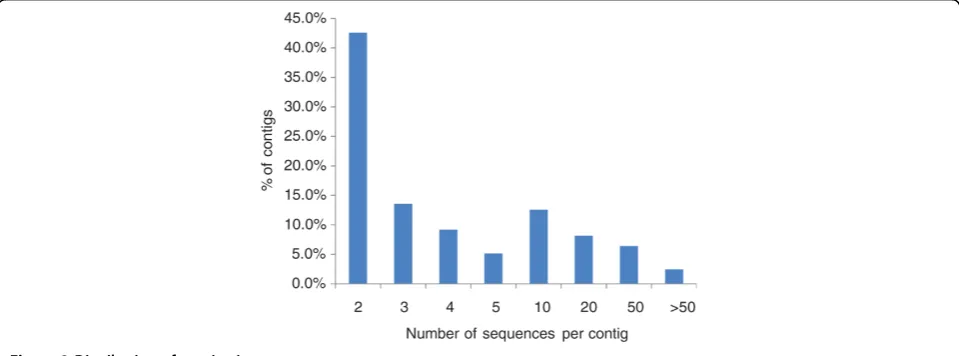
In order to identify inter-specific SNPs, we also con-ducted the assembly of all available 493,852 ESTs from blue catfish and channel catfish. This assembly allowed the formation of 45,306 contigs (66,272 singletons), from which potential inter-specific SNPs could be iden-tified. The number of inter-specific contigs was signifi-cantly larger than that from either species, potentially due to the formation of new contigs of related tran-scripts that were singletons in either species (see Dis-cussion). A majority of contigs contained only two (43%) or three (13%) sequences (Figure 2), and average contig depth was nine sequences. With the ESTs being sequenced mostly from normalized libraries, the vast majority of contigs had 50 or fewer sequences. How-ever, some extremely large contigs were found. The
largest contig, containing 7,208 sequences, putatively identified as apolipoprotein, was repeatedly sequenced from all libraries, and was prevalent in the pre-existing non-normalized libraries in GenBank. As previously reported [37], contig depth is one of the two most important factors affecting EST-derived SNP qualities. Therefore, the information on contig depth is highly useful.
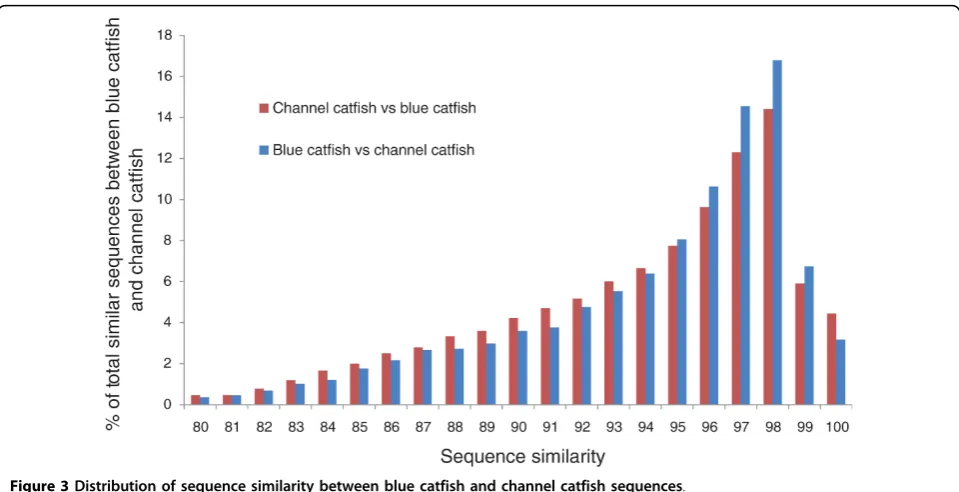
[image:3.595.56.539.101.319.2]To assess the similarity between blue catfish and channel catfish sequences, the consensus sequences from each species were compared to each other using BLASTN at a stringency of 1E-10. Of blue catfish and channel catfish sequences with a minimal 200-bp matching region, sequence similarity ranged from 77% to 100%, with an average similarity of 95%. Over 50% of
Table 1 cDNA library information and sequencing summary
Library Species Nature of library Organ, tissue, or cell line Total sequences
CBFH Blue catfish Normalized Stomach, muscle, olfactory tissue and trunk kidney 37,314
CBZC Blue catfish Normalized Stomach, muscle, olfactory tissue and trunk kidney 30,902
CBNH Blue catfish Normalized Head kidney, gill, intestine, spleen, skin and liver 9,323
CBZF Blue catfish Normalized Head kidney, gill, intestine, spleen, skin and liver 51,172
Subtotal 128,711
CBCZ Channel catfish Non-normalized Mixed leukocytes of parallel blood leukocytes 16,168
CBFA Channel catfish Normalized Catfish whole fry library 63,602
CBNG Channel catfish Normalized Kidney, gill, intestine, spleen, skin and liver 2,982
CBZB Channel catfish Normalized Kidney, gill, intestine, spleen, skin and liver 57,772
CBNI Channel catfish Normalized Stomach, muscle, olfactory tissue and trunk kidney 17,023
CBZA Channel catfish Normalized Stomach, muscle, olfactory tissue and trunk kidney 61,320
CBPN Channel catfish Subtracted Liver, pituitary, ovary and testis 62,058
CBPO Channel catfish Normalized Peripheral blood leukocytes stimulated with LPS 28,685
Subtotal 309,610
NCBI Blue catfish 10,764
NCBI Channel catfish 44,767
Total 493,852
Library names were designated by the Joint Genome Institute. LPS, lipopolysaccharide.
[image:3.595.57.547.345.520.2]blue catfish and channel catfish homologous sequences have similarity levels over 95% (Figure 3).
Gene identification and annotation
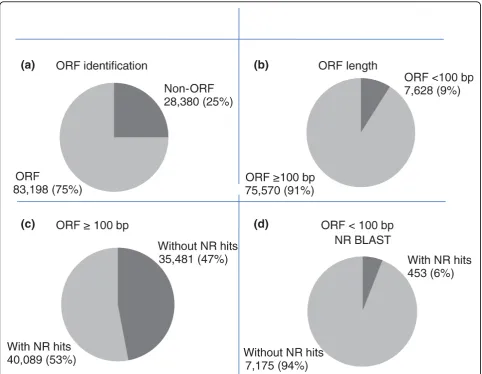
Putative gene identification was conducted either byab initioidentification of open reading frames (ORFs) or by BLASTX similarity search of public protein databases. Of the 111,578 total unique catfish sequences (total cat-fish EST assembly), ORFs were detected from 83,198 (75%) unique sequences, with an average ORF length of 450 bp (minimum = 51 bp, maximum = 14,674 bp; Fig-ure 4), and the remaining 28,380 sequences (25%) con-tained no ORFs (Figure 5a). These ORF-less ESTs were likely ESTs sequenced within the untranslated regions (UTRs) or within intron-retaining cDNAs.
There was a positive correlation between the length of ORF and BLASTX match. Of the identified ORFs, 91% had a length of more than 100 bp. Within these ORFs, 53% had significant (1E-10) BLASTX matches (Figures 5b, c). However, only 6% of the ORFs with less than 100 bp had significant BLASTX matches (Figure 5d).
A total of 41,311 (37%) unique sequences had signifi-cant BLASTX matches within the nr database, and
34,860 (31%) had significant BLASTX matches within the Uniprot database (Table 3). Over 98% of unique sequences with significant matches were identified with ORFs, which indicated the reliability of ORF searching. After examination of putative protein identities from the BLASTX searches, homologous sequences were identi-fied from the catfish ESTs. Of the 41,311 sequences with BLASTX hits, 22,642 (approximately 55%) and 17,948 (approximately 43%) unique proteins were identi-fied through searches against the nrand the Uniprot protein databases after removing the redundant protein hits, respectively.
Assessment of the sequenced catfish transcriptome
In order to assess the level to which the catfish tran-scriptome has been captured, the unique catfish sequences (111,578) were also searched against the NCBI Refseq and Ensembl databases. A number of sig-nificant hits were identified within zebrafish, medaka,
Tetraodon, human, mouse, and chicken reference pro-tein databases (Table 3). After removal of the redundant protein hits, 14,988 - 11,059 unique reference proteins were identified within zebrafish, medaka, Tetraodon, human, mouse, and chicken databases respectively (Table 3). The unique catfish sequences had hits to 54% to 57% of the unique proteins of zebrafish, medaka, and green-spotted pufferfish. To allow comparison of catfish unique protein coverage with that expected between species with complete genome sequences, allTetraodon
Ensembl proteins were searched against the medaka Ensembl protein database. A total of 22,150 Tetraodon
[image:4.595.57.291.100.227.2]proteins have significant hits to 15,054 (61% of total unique) medaka Ensembl proteins with a cutoff E-value of 1E-10. Similarly, zebrafish Refseq proteins were searched against the human Refseq protein database. In this case, 24,971 zebrafish proteins have significant hits
Table 2 EST assembly statistics
Blue catfish
Channel catfish
All catfish
Total number of sequences 139,475 354,377 493,852 Short and simple sequences
removed
2,735 6,230 8,965
Sequences for assembly 136,740 348,147 484,887
Contigs 22,009 28,941 45,306
Singletons 32,806 41,776 66,272
Average number of sequences per contig
4.72 10.6 9.2
Total unique sequences 54,815 70,717 111,578
[image:4.595.58.538.541.719.2]to 13,789 (36% of total unique) human proteins with a cutoff E-value of 1E-10. Taken together, these numbers provide strong evidence that this project has captured a large majority of the catfish transcriptome.
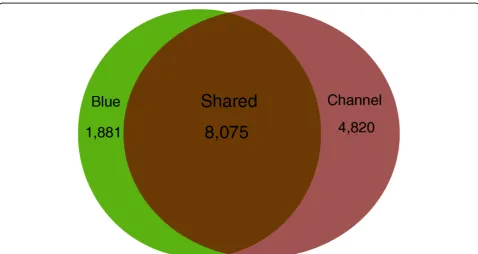
A total of 14,776 cumulative unique genes were iden-tified from catfish based on BLASTX searches against the Refseq/Ensembl database (Table 3), including 8,075 genes identified from both blue catfish and channel
catfish, 1,881 unique genes from blue catfish and 4,820 unique genes from channel catfish (Figure 6). As expected based on sequencing coverage depths, signifi-cantly more unique genes were identified from channel catfish than blue catfish.
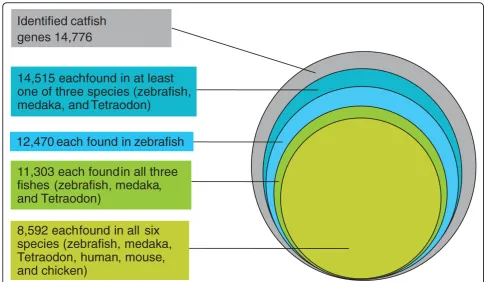
[image:5.595.58.538.87.333.2]To assess the evolutionary conservation of the identi-fied unique genes, the number of hits to unique genes in each species of zebrafish, medaka,Tetraodon, human,
[image:5.595.59.544.324.596.2]Figure 3Distribution of sequence similarity between blue catfish and channel catfish sequences.
Figure 5Analysis of open reading frames (ORFs).(a)Percentage of ORFs among unique sequences from the all catfish EST assembly;(b) Percentage of ORF greater than 100 bp among unique sequences from the all catfish EST assembly;(c)Percentage of ORFs equal to or greater than 100 bp with significant BLASTX hits;(d)Percentage of ORFs smaller than 100 bp with significant BLASTX hits
Table 3 Summary of BLASTX search analysis of catfish ESTs
Database Catfish hits* Unique protein % of total unique proteins Unique gene
NR 41,311 22,642
Uniprot 34,860 17,948
Refseq/Ensembl
Zebrafish 39,546 14,988 54% of 27,996 12,470
Medaka 36,641 13,588 56% of 24,461 12,920
Tetraodon 34,418 13,132 57% of 23,118 10,322
Human 33,847 12,621 33% of 38,342 9,668
Mouse 33,594 12,267 35% of 35,236 11,518
Chicken 31,646 11,059 50% of 22,194 8,717
Cumulative unique (E-10)† 42,668 16,439 14,776
*Number of significant (E-10
[image:6.595.56.543.577.713.2]mouse, and chicken were compared. A total of 8,592 (58% of total number of unique catfish genes) putative known unique genes were found in all six species: 11,303 (76%) were found in all three fish species; and 14,515 (98%) were found in at least one of the three fish species (Figure 7), indicating a high level of conservation of gene content among catfish and other teleost fish species.
Prediction of full-length cDNAs
The catfish EST sequences provide a platform for the identification and characterization of full-length cDNA clones without having to use expensive and labor-inten-sive primer walking sequencing. In the context of this work, full-length cDNA inserts were defined as a cDNA from a single clone with the start codon and poly (A) tail contained within the clone. A total of 10,037 channel cat-fish and 7,382 blue catcat-fish putative full-length cDNAs were identified from the assembly with a cutoff E-value of 1E-5. A well characterized full-length cDNA set from catfish will be crucial in ongoing studies of teleost gene duplication and gene family structure, as well as aiding in annotation of the catfish whole genome sequence. Cur-rent efforts are focused, therefore, on characterization and re-sequencing of these full-length cDNAs.
Microsatellite and SNP marker identification
A total of 20,757 microsatellites were initially identified from 15,082 unique sequences, including di-, tri-, tetra-,
penta- and hexa-nucleotide repeats (Table 4). After removing the microsatellites without enough flanking sequence for primer design, 13,375 unique sequences with microsatellites had sufficient flanking sequences (50 bp) on both sides of the microsatellites to design primers for genotyping. Our previous research indicated that over 72% of EST-derived microsatellites were poly-morphic in one resource family [12], suggesting the potential utility of these microsatellites.
A total of 48,702 putative SNPs and 14,803 putative insertions/deletions (indels) were identified from the blue catfish EST dataset assembly; 102,252 putative SNPs and 41,660 putative indels were identified from channel catfish EST dataset assembly (Table 5). These putative SNPs indicated an SNP rate of 3.2 SNPs per kilobase of transcribed sequences in blue catfish, and 4.1 SNPs per kilobase of transcribed sequences in channel catfish. Obviously, such SNP rates were calculated from the total consensus sequence length and, therefore, the deeper the EST sequencing was, the greater the possibi-lity for the identification of a SNP within the consensus sequences.
[image:7.595.58.537.454.708.2]Over 303,000 putative SNPs and 100,000 putative indels were identified from the all catfish EST assembly results (Table 5). EST-derived SNPs are often prone to sequencing errors. Therefore, the putative SNPs were subjected to filtering using only those with contig sizes of at least four sequences and the minor allele presence of at least two sequences in the contigs, and indels were
not used for further analysis [37]. These parameters were previously shown to select markers with 70% suc-cess rate for genotyping. After filtering, 3,891 and 15,827 SNPs were identified from the blue catfish and channel catfish EST dataset assemblies, respectively. A subset of 48,594 filtered SNPs were obtained from the all catfish EST assembly; these SNPs included 32,235 transitions and 16,359 transversions (Table 5). The fil-tered SNP frequency in the transcribed sequences was 0.25 SNP in blue catfish, 0.64 SNP in channel catfish, and 1.6 SNP in the all catfish assembly per kilobase. A total of 19,398 filtered insertions and deletions (Indels) were discovered, that is, 0.64 indels per kilobase of the
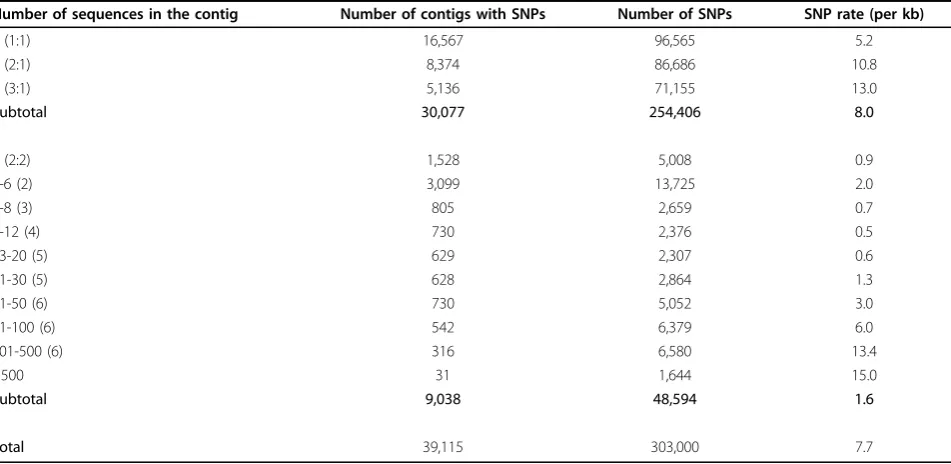
transcribed sequences. Of the 48,594 SNPs, over 90% were identified from the contigs containing 5 or more sequences (Table 6).
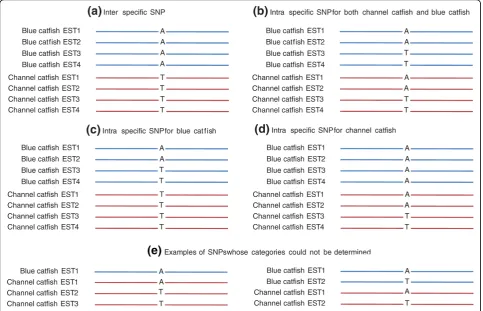
[image:8.595.54.540.87.369.2]The assessment of the rates of inter-specific SNPs and intra-specific SNPs may have practical applications. We therefore assessed these SNP rates using the EST data. First, SNPs were identified from contigs containing at least four sequences with at least two sequences from either channel catfish or blue catfish in the all catfish EST assembly. Inter-specific SNPs were defined as those that have sequence variations between blue catfish and channel catfish, but no sequence variations within blue catfish or within channel catfish; similarly, SNPs were identified within blue catfish but not within channel cat-fish or vice versa; and SNPs were identified within both channel catfish and blue catfish at the same SNP posi-tions (Figure 8). Of the 48,594 filtered SNPs, 42,080 were identified from contigs comprising both channel catfish and blue catfish ESTs, and 6,514 were identified from contigs composed of ESTs from either channel catfish or blue catfish, including 5,396 from channel cat-fish contigs and 1,118 were identified from blue catcat-fish contigs. Of the contigs containing ESTs from both blue catfish and channel catfish, the estimation of percentage of inter- and intra-specific SNPs was conducted based on the identification of SNPs from 1,000 randomly
Figure 7Conservation of catfish gene identities with other species. Number of catfish homologous genes identified from other species using BLASTX searches.
Table 4 Summary of microsatellite marker identification from catfish ESTs
Total number of unique sequences 111,578
Microsatellites identified 20,757
Di-nucleotide repeats 12,367
Tri-nucleotide repeats 5,506
Tetra-nucleotide repeats 2,664
Penta-nucleotide repeats 182
Hexa-nucleotide repeats 38
Number of unique sequences containing microsatellites 15,082 Number of unique sequences containing microsatellites with
sufficient flanking sequences for PCR primer design
[image:8.595.55.292.435.555.2]selected contigs. Of the 48,594 filtered SNPs identified from the all catfish assembly, over 18,000 (39%) were inter-specific SNPs; with 523 (1%) intra-specific SNPs for blue catfish, 2,352(5%) intra-specific SNPs for chan-nel catfish, and 3,790 (8%) intra-specific SNPs for both channel catfish and blue catfish. However, approxi-mately 17,000 SNPs could not be determined because overall the SNPs qualified as SNPs with at least two
minor allele sequences, but only one of the minor allele sequences was from one of the two species of blue cat-fish or channel catcat-fish (Table 7). Additionally, the num-ber of inter-specific SNPs may be overestimated, due to failure to capture minor allele sequences from one or both species in the current EST data. However, the sequence differences between species should be greater than those within species. Although a large number of filtered inter-specific SNPs were identified (18,000 out of 48,000 total filtered SNPs), they were identified from a relatively small number of contigs. The 18,000 filtered inter-specific SNPs were identified from approximately 2,800 contigs, with an average of 6.6 SNPs per contig.
Discussion
This project represents one of the major milestones in catfish research, and brings the catfish EST resources to almost a half million sequences in GenBank [21-26]. This EST resource will prove useful for gene discovery, molecular marker development, and genetic linkage and comparative mapping, and it will help facilitate whole genome sequencing and annotation. Parallel EST sequencing in two closely related species,I. punctatus
andI. furcatus, may also provide the material basis for the analysis of genome duplication and genome evolu-tion, providing the basis for establishment of orthologies through phylogenetics analysis.
[image:9.595.56.291.110.325.2]The most important outcome of EST sequencing is gene discovery. This project allowed identification of 70,717 unique sequences in channel catfish and 54,815 unique sequences in blue catfish. We also conducted
Table 5 Summary of SNP identification from the catfish ESTs
Number of SNPs
SNP Blue
catfish
Channel catfish
All catfish
Putative
Transitions 29,305 61,184 172,746
Transversions 19,397 41,068 130,254
Total SNPs 48,702 102,252 303,000
Indels 14,803 41,660 100,636
SNP rate (kb) 3.2 4.1 7.7
Filtered putative
Transitions 2,886 11,012 32,235
Transversions 1,005 4,815 16,359
Total SNPs 3,891 15,827 48,594
Indels 1,070 6,707 19,398
Filtered/Non-filtered rate
7.8% 15.7% 16.2%
SNP rate* (kb) 0.25 0.64 1.6
*SNP rate was calculated by dividing the total number of SNPs excluding indels by the total length (bp) of the consensus sequences of the contigs.
Table 6 Quality assessment of the filtered putative SNPs identified from the catfish ESTs based on the number of sequences per contig and the sequence frequencies of the minor alleles
Number of sequences in the contig Number of contigs with SNPs Number of SNPs SNP rate (per kb)
2 (1:1) 16,567 96,565 5.2
3 (2:1) 8,374 86,686 10.8
4 (3:1) 5,136 71,155 13.0
Subtotal 30,077 254,406 8.0
4 (2:2) 1,528 5,008 0.9
5-6 (2) 3,099 13,725 2.0
7-8 (3) 805 2,659 0.7
9-12 (4) 730 2,376 0.5
13-20 (5) 629 2,307 0.6
21-30 (5) 628 2,864 1.3
31-50 (6) 730 5,052 3.0
51-100 (6) 542 6,379 6.0
101-500 (6) 316 6,580 13.4
>500 31 1,644 15.0
Subtotal 9,038 48,594 1.6
[image:9.595.61.537.499.731.2]Table 7 Estimation of proportions of inter-specific and intra-specific SNPs from the set of filtered SNPs identified from the interspecific all catfish EST assembly
SNP type* From 1,000 random
contigs
Estimated from the all catfish assembly
Estimated % of total filtered SNP
Inter-specific SNP1 430 18,731 39
Intra-specific SNP, blue catfish2 12 523 1
Intra-specific SNP, channel catfish3 54 2,352 5
Intra-specific SNP, blue catfish and channel
catfish4 87 3,790 8
Undetermined5 383 16,683 34
Subtotal 966 42,080 87
SNP from only blue catfish ESTs6 NA 1,118 2
SNP from only channel catfish ESTs6 NA 5,396 11
Subtotal NA 6,514 13
Total SNP NA 48,594 100
*SNPs were identified from contigs containing at least four sequences with at least two sequences from either channel catfish or blue catfish in the all catfish EST assembly:1
where there were no intra-specific blue catfish SNPs or intra-specific channel catfish SNPs, but the sequence differed between the two species at the inter-specific SNP position;2
where there were SNPs within blue catfish, but not within channel catfish;3
where there were SNPs within channel catfish, but not within blue catfish;4
where there were SNPs within both blue catfish and channel catfish;5
undetermined because overall the SNPs qualified as SNPs with at least two minor allele sequences, but only one of the minor allele sequences was from one of the two species of blue catfish or channel catfish;6
[image:10.595.59.538.515.679.2]these SNPs were identified from ESTs that have been sequenced from only one of the two species, blue catfish or channel catfish, to date.
EST assembly using ESTs from both channel catfish and blue catfish. Assembly of all the catfish ESTs resulted in 111,578 unique sequences. Comparison of channel cat-fish and blue catcat-fish coding regions in this study indi-cated that the two species share, on average, 95% sequence identity. Therefore, combining genes identified from both species should provide a more complete pic-ture as to what fraction of the catfish transcriptome was captured to date. Such an approach was taken also because of practical considerations. Hybrid catfish pro-duced by inter-specific hybridization of channel catfish × blue catfish is one of the best production lines of cat-fish used in aquaculture, and many believe that indus-try-wide application of this hybrid may have a revolutionary impact on the catfish industry. One of the major catfish breeding programs is based on introgres-sion of beneficial genes from blue catfish into channel catfish breeds. Genetic linkage mapping has been con-ducted in both the intra-specific resource families invol-ving only channel catfish [14] and the inter-specific resource families made from backcrosses of the channel catfish × blue catfish hybrids [12,13].
Given the close phylogenetic relationship of blue cat-fish and channel catcat-fish, we expected that many of the contigs from the blue catfish and channel catfish EST assembly would merge together in an all catfish EST assembly. However, the all catfish EST assembly gener-ated 45,306 contigs, a much greater number than the contigs generated in either the blue catfish (22,009) or channel catfish (28,941) EST assembly. There could be several reasons for this major increase in contig num-bers with the all catfish EST assembly. First, some ESTs belonging to the contigs were only sequenced in blue catfish but not in channel catfish, and vice versa; second, singletons in either blue catfish or channel catfish were brought together to form new contigs; third, sequence variations or splicing differences between the two spe-cies may have led to the formation of a larger number of contigs under our assembly parameters; fourth, ESTs derived primarily from transcript untranslated regions of the two species may differ sufficiently to prevent place-ment in the same contig. Thorough analysis of the data-set has revealed that all four of these factors contributed to the high number of contigs in the all catfish assembly.
Analysis of the all catfish unique sequences showed that a large proportion of the catfish transcriptome has been captured. BLASTX searches identified 37% of total transcripts with significant hits, similar to levels reported in the salmon EST project [30]. The 111,578 unique catfish sequences had hits to 54% to 57% of the unique proteins of zebrafish, medaka, and green-spotted pufferfish using a cutoff value of E-10. This percentage appeared at first glance to be lower than our
expectations. We therefore carried out best-hit searches using identical parameters as those used with catfish but comparing protein coverage of species with complete genome (transcriptome) sequences to serve as reference points. We found that the Tetraodon protein set had significant hits to only 61% of medaka proteins. By com-parison, our catfish data set had significant hits to 56% and 57% of medaka and Tetraodon proteins, respec-tively. Similarly, zebrafish Refseq proteins were searched against the human Refseq protein database. In this case, zebrafish proteins had significant hits to 36% of total unique human proteins, compared to 33% in catfish-human alignments (Table 3). These reference numbers indicate both the high coverage of the catfish transcrip-tome obtained in this project, and the limitations of simple homology searches given the rapid divergence of many genes following speciation and the complexity of genome-wide and local gene duplication events within teleost species. Given that the identity of only 37% of the unique catfish sequences could be characterized by homology searches, the utility of the dataset should increase significantly with whole-genome sequencing of Ictalurid catfish and additional sequencing in closely related species within the order of Siluriformes. Interest-ingly, over 40,000 unique catfish sequences containing an ORF did not have a significant hit by homology searches. Further work will be needed to characterize whether low homology rates in these sequences is due to short read length, the rapid evolution of the encoded gene, or ‘catfish-specific’ gene duplication and divergence.
Large-scale EST sequences provide an enormous resource for molecular marker development. This pro-ject allowed identification of over 20,000 microsatellites within ESTs, of which 13,375 were located within unique ESTs and had sufficient flanking sequences for microsatellite primer design for genotyping (Table 6). Therefore, these microsatellites will be a major resource for genetic linkage and comparative mapping [12]. In addition, over 300,000 putative SNP sites were identi-fied, of which over 48,000 were identified from contigs with at least four ESTs and the minor sequence was represented at least twice (Table 7). The 48,000 filtered SNPs should be highly useful for the development of a SNP panel for whole genome association studies [37].
SNP frequency within these large contigs may be caused by the accumulation of sequencing errors or alignment of transcripts from multi-copy loci, so SNPs from large contigs will be avoided in future SNP genotyping.
Conclusions
In this project, generation and assembly of channel cat-fish and blue catcat-fish ESTs allowed the identification of 45,306 contigs and 66,272 singletons, and a large major-ity of the catfish transcriptome was captured. Whole genome sequencing of channel catfish and blue catfish is currently underway, and the comparison between gen-ome and transcriptgen-ome sequences will enable better understanding of the gene structure and organization. The analysis of the inter-specific ESTs resulted in the identification of 20,757 gene-associated microsatellites and over 300,000 putative SNPs, of which over 48,000 were filtered SNPs with the presence of the minor allele at least twice. These SNPs have been utilized to design the first generation high-density SNP chips using Illu-mina iSelect HD SNP genotyping panels for genome association studies. The inter- and intra-specific SNPs identified from the all catfish EST dataset assembly will greatly benefit catfish introgression breeding selection and whole genome association studies.
Materials and methods
cDNA library construction, EST sequencing and processing
The cDNA libraries were constructed by consortium investigators using various tissues, organs, and cell lines, including stomach, muscle, olfactory tissue, trunk kid-ney, head kidkid-ney, gill, intestine, spleen, skin, liver, pitui-tary, ovary and testis (Table 1). Total RNA was isolated from experimental tissues, reverse transcribed using an oligo-dT primer, directionally cloned into either the pSPORT-1 (Invitrogen Corp., Carlsbad, CA, USA) or pDNR-Lib (Clontech Laboratories Inc., Mountain View, CA, USA) plasmid vectors, and electroporated into com-petentEscherichia coli. One library (CBPN) underwent subtraction for highly expressed clones, ten libraries were normalized, and one library (CBCZ) was processed without normalization. Clone selection, arraying, and sequencing of all 12 libraries were performed at the US Dept. of Energy - Joint Genome Institute. Both ends of the insert were sequenced using Big Dye Terminator (V3.1) chemistry (Applied Biosystems, Foster City, CA, USA), and low quality sequences were trimmed. Con-taminant sequences (E. coli, mitochondrial, cloning vec-tor, rRNA, tRNA) were filtered.
EST assembly
Three separate assemblies were performed: blue catfish ESTs, channel catfish ESTs, and all catfish ESTs. The
new EST sequences and existing EST sequences from channel catfish and blue catfish were clustered and assembled using the Paracel Transcript Assembler, based on the CAP3 assembler [38]. Repeat sequences and poly (A) tails were masked and annotated. Prior to assembly, all EST sequences were compared to ‘seed’ sequences, which were existing catfish full-length or partial cDNA sequences in GenBank. New sequences sharing 80% similarity to seed sequences were clustered and assembled at 95% identity with at least a 50-bp overlap to generate seed-cluster contigs. The seed clus-ter assembly reduced the number of sequences for final assembly in order to minimize computational require-ments. The remaining EST sequences were then clus-tered based on local similarity scores of pairwise comparisons with a minimum 88% similarity of at least 100 bp. Clusters containing only one sequence were denoted as singletons. The EST clusters were assembled into contiguous sequences (contigs) by multiple-sequence alignment with 95% identity of at least a 50-bp overlap, and a consensus sequence was generated for each cluster. Multiple contigs could be generated from each cluster, since EST clusters may not share enough similarity over their entire length to be assembled as a single contig. Multiple contigs could also be generated when ESTs in the cluster represented splice variant forms or paralogs. Single ESTs remaining in a cluster after the formation of contigs were designated as cluster singletons. The unique sequences for each assembly included the seed-cluster contigs, cluster contigs, cluster singletons, and singletons. All the sequence assemblies are available upon request to the corresponding author.
ORF searching, gene identification and gene ontology annotation
All unique sequences obtained after the assembly were analyzed by ESTScan [39] to search for ORFs, which could be used to distinguish coding and non-coding sequences [39,40]. The putative protein sequences were also generated at the same time by ESTscan, which could be used to analyze splice variation, determine paralogs, and assess gene families. All unique sequences were compared against the nr and Uniprot databases using BLASTX (cutoff E-value of 1E-10) to obtain the putative identity. The NCBI Refseq protein and Ensem-ble databases (zebrafish, medaka, Tetraodon, human, mouse, and chicken) were also used to annotate the unique catfish genes.
Full length cDNA identification
tail were identified, the cDNA sequence was considered a full-length cDNA.
Microsatellite and SNP marker identification
All the unique sequences were used to search for micro-satellite makers using Msatfinder [42] with a repeat threshold of eight di-nucleotide repeats or five tri-, tetra-penta-, or hexa-nucleotide repeats. Clones containing 50-bp sequence on both sides of the microsatellite repeat were considered sufficient for primer design [43].
All three assemblies were used for SNP identification using autoSNP [44]. The parameters for minimum minor allele frequency for SNP detection varied with the num-ber of sequences in the contig. A sequence variation was declared a SNP when: a mismatch was identified in con-tigs with four or fewer sequences; the minor allele sequence existed at least twice within contigs containing 5 to 6 sequences; the minor allele sequence existed at least three times within contigs containing 7 to 8 sequences; the minor allele sequence existed at least four times within contigs containing 9 to 12 sequences, or the minor allele sequence existed at least five times within contigs with 13 or more sequences. One thousand con-tigs containing filtered SNPs were randomly selected to inspect the inter- and intra-specific SNP calls.
Additional file 1: SNP information for contigs with 500 sequences or moreSNP information for contigs with 500 sequences or more. Click here for file
[ http://www.biomedcentral.com/content/supplementary/gb-2010-11-1-r8-S1.xlsx ]
Abbreviations
BAC: bacterial artificial chromosome; EST: expressed sequence tag; ORF: open reading frame; SNP: single nucleotide polymorphism.
Acknowledgements
This project was supported by the Community Sequencing Program of the Joint Genome Institute of the Department of Energy, and partially by grants from USDA NRI Animal Genome Basic Genome Reagents and Tools Program (USDA/NRICGP award # 2006-35616-16685 and USDA/NRICGP award # 2009-35205-05101) and by USDA ARS (CRIS 6402-31000-008-00). The sequencing work was performed under the auspices of the US Department of Energy’s Office of Science, Biological and Environmental Research Program, and by the University of California, Lawrence Berkeley National Laboratory under contract No. DE-AC02-05CH11231, Lawrence Livermore National Laboratory under contract No. DE-AC52-07NA27344, and Los Alamos National Laboratory under contract No. DE-AC02-06NA25396. Thanks are given to Alabama Supercomputer Center for providing the computer capacity for the bioinformatics analysis of the ESTs. We are grateful to The Catfish Genome Consortium that supported this Community Sequencing Project, and the consortium is composed of those in the authorship as well as the following in an alphabetical order: Jerald Ainsworth, Ihan Altinok, Cova R Arias, Joel A Bader, Anita L Bilodeau, Curtis Bird, Jan Bogerd, Brian G Bosworth, Richard C Bruch, Karen Burnett, John T Caprio, Jesse Chappell, Nagaraj Chatakondi, Gregory Chinchar, Walton W Dickhoff, Richard T DiGiulio, Cunming Duan, Mary V Duke, Rex A Dunham, Steve Gabel, Troy A Giambernardi, WL Gray, Eric D Green, Larry A Hanson, Michael Hardman, Chongbo He, Jun-ichi Hikima, Alison Hutson, Liliana Jaso-Friedmann, Zhenlin Ju, Attila Karsi, Kevin Kelley, David Kingsley, Conrad Kleinholz, Philip H Klesius, Arif Kocabas, Won
Kyo Lee, Mara Lennard, Wayne Litaker, Gary W Litman, Craig J Lobb, George Luker, Brad G Magor, Thomas J McConnell, William Muir, Edward Noga, Kenneth Nusbaum, Donald D Ourth, Victor Panangala, Reynaldo Patino, Brian C Peterson, Ronald Phelps, Karen P Plant, John H Postlethwait, Herbert E Quintero, Daniel Rodriguez, Holly L Saunders, Brian Scheffler, Tom Schwedler, Richard A Shelby, William Simco, Craig A Shoemaker, Letong Tang, Jeff Terhune, Ronald L Thune, Terrence R Tiersch, Gregory W Warr, Thomas Welker, Monte Westerfield, Kristie L Willett, Kenneth Williams, Richard Winn, Changgong Wu, Dehai Xu, Roger Yant, Hung-Y Yeh, Yonathan Zohar, and Jun Zou
Author details
1The Fish Molecular Genetics and Biotechnology Laboratory, Department of Fisheries and Allied Aquacultures and Program of Cell and Molecular Biosciences, Aquatic Genomics Unit, 203 Swingle Hall, Auburn University, Auburn, AL 36849, USA.2USDA, ARS, Catfish Genetics Research Unit, 141 Experiment Station Road, Stoneville, Mississippi 38776, USA.3DOE Joint Genome Institute, Genomic Technologies Department, 2800 Mitchell Drive Bldg 400-462, Walnut Creek, CA 94598, USA.4The WM Keck Center for Comparative and Functional Genomics, University of Illinois at Urbana-Champaign, Urbana, IL 61801, USA.5Department of Microbiology, University of Mississippi Medical Center, 2500 North State Street, Jackson, MS 39216, USA.6Center of Marine Biotechnology, University of Maryland Biotechnology Institute, 701 East Pratt Street, Baltimore, MD 21202, USA.7Department of Molecular and Cell Biology, University of California, Berkeley, 142 Life Sciences Addition #3200, Berkeley, CA 94720, USA.
Authors’contributions
SW conducted the bioinformatic analysis and was involved in writing the manuscript; EP was involved in data analysis and writing the manuscript; JA was involved in data analysis; GW, PL, HK, CM, BS, MW, HL, YJ, YL, FC, JL, WW, PX, BS, PB, JQ, ZS, BB, YW, QW, TT, SN, SL, LW, LK, SQ, EB, NM, and JT were involved in one or more processes of library construction,
normalization, subtraction, or original research planning, writing the original grant proposal or writing the manuscript; EL, PR, SL, MW and DR were involved in EST sequencing at the Joint Genome Institute and management and storage of sequencing clones and datasets; JT, LL, and DV assisted the bioinformatic analysis; ZL directed the entire project and was involved in data analysis and writing the manuscript.
Received: 3 November 2009 Revised: 14 January 2010 Accepted: 22 January 2010 Published: 22 January 2010
References
1. Chatakondi NG, Yant DR, Dunham RA:Commercial production and performance evaluation of channel catfish,Ictalurus punctatusfemale × blue catfish,Ictalurus furcatusmale F-1 hybrids.Aquaculture2005,247:8. 2. Bao B, Peatman E, Peng X, Baoprasertkul P, Wang G, Liu Z:Characterization
of 23 CC chemokine genes and analysis of their expression in channel catfish (Ictalurus punctatus).Dev Comp Immunol2006,30:783-796. 3. Peatman E, Liu Z:Evolution of CC chemokines in teleost fish: a case
study in gene duplication and implications for immune diversity.
Immunogenetics2007,59:613-623.
4. Miller N, Wilson M, Bengten E, Stuge T, Warr G, Clem W:Functional and molecular characterization of teleost leukocytes.Immunol Rev1998, 166:187-197.
5. Peatman E, Baoprasertkul P, Terhune J, Xu P, Nandi S, Kucuktas H, Li P, Wang S, Somridhivej B, Dunham R, Liu Z:Expression analysis of the acute phase response in channel catfish (Ictalurus punctatus) after infection with a Gram-negative bacterium.Dev Comp Immunol2007,31:1183-1196. 6. Peatman E, Terhune J, Baoprasertkul P, Xu P, Nandi S, Wang S,
Somridhivej B, Kucuktas H, Li P, Dunham R, Liu Z:Microarray analysis of gene expression in the blue catfish liver reveals early activation of the MHC class I pathway after infection withEdwardsiella ictaluri.Mol Immunol2008,45:553-566.
7. Bengten E, Clem LW, Miller NW, Warr GW, Wilson M:Channel catfish immunoglobulins: repertoire and expression.Dev Comp Immunol2006, 30:77-92.
9. Sahoo M, Edholm ES, Stafford JL, Bengten E, Miller NW, Wilson M:B cell receptor accessory molecules in the channel catfish,Ictalurus punctatus.
Dev Comp Immunol2008,32:1385-1397.
10. Serapion J, Kucuktas H, Feng J, Liu Z:Bioinformatic mining of type I microsatellites from expressed sequence tags of channel catfish (Ictalurus punctatus).Mar Biotechnol2004,6:364-377.
11. Somridhivej B, Wang S, Sha Z, Liu H, Quilang J, Xu P, Li P, Hu Z, Liu Z: Characterization, polymorphism assessment, and database construction for microsatellites from BAC end sequences of channel catfish (Ictalurus punctatus): A resource for integration of linkage and physical maps.
Aquaculture2008,275:76-80.
12. Kucuktas H, Wang S, Li P, He C, Xu P, Sha Z, Liu H, Jiang Y, Baoprasertkul P, Somridhivej B, Wang Y, Abernathy J, Guo X, Liu L, Muir W, Liu Z: Construction of genetic linkage maps and comparative genome analysis of catfish using gene-associated markers.Genetics2009,181:1649-1660. 13. Liu Z, Karsi A, Li P, Cao D, Dunham R:An AFLP-based genetic linkage map
of channel catfish (Ictalurus punctatus) constructed by using an interspecific hybrid resource family.Genetics2003,165:687-694. 14. Waldbieser GC, Bosworth BG, Nonneman DJ, Wolters WR:A
microsatellite-based genetic linkage map for channel catfish,Ictalurus punctatus.
Genetics2001,158:727-734.
15. Quiniou SM, Katagiri T, Miller NW, Wilson M, Wolters WR, Waldbieser GC: Construction and characterization of a BAC library from a gynogenetic channel catfishIctalurus punctatus.Genet Sel Evol2003,35:673-683. 16. Wang S, Xu P, Thorsen J, Zhu B, de Jong PJ, Waldbieser G, Kucuktas H,
Liu Z:Characterization of a BAC library from channel catfishIctalurus punctatus: indications of high levels of chromosomal reshuffling among teleost genomes.Mar Biotechnol2007,9:701-711.
17. Quiniou SM, Waldbieser GC, Duke MV:A first generation BAC-based physical map of the channel catfish genome.BMC genomics2007,8:40. 18. Xu P, Wang S, Liu L, Thorsen J, Kucuktas H, Liu Z:A BAC-based physical
map of the channel catfish genome.Genomics2007,90:380-388. 19. Xu P, Wang S, Liu L, Peatman E, Somridhivej B, Thimmapuram J, Gong G,
Liu Z:Channel catfish BAC-end sequences for marker development and assessment of syntenic conservation with other fish species.Anim Genet
2006,37:321-326.
20. Liu H, Jiang YL, Wang S, Ninwichian P, Somridhivej B, Xu P, Abernathy J, Kucuktas H, Liu Z:Comparative analysis of catfish BAC end sequences with the zebrafish genome.BMC Genomics2009,10:592.
21. Cao D, Kocabas A, Ju Z, Karsi A, Li P, Patterson A, Liu Z:Transcriptome of channel catfish (Ictalurus punctatus): initial analysis of genes and expression profiles of the head kidney.Anim Genet2001,32:169-188. 22. Ju Z, Karsi A, Kocabas A, Patterson A, Li P, Cao D, Dunham R, Liu Z:
Transcriptome analysis of channel catfish (Ictalurus punctatus): genes and expression profile from the brain.Gene2000,261:373-382. 23. Karsi A, Cao D, Li P, Patterson A, Kocabas A, Feng J, Ju Z, Mickett KD, Liu Z:
Transcriptome analysis of channel catfish (Ictalurus punctatus): initial analysis of gene expression and microsatellite-containing cDNAs in the skin.Gene2002,285:157-168.
24. Kocabas AM, Kucuktas H, Dunham RA, Liu Z:Molecular characterization and differential expression of the myostatin gene in channel catfish (Ictalurus punctatus).Biochim Biophys Acta2002,1575:99-107. 25. Li P, Peatman E, Wang S, Feng J, He C, Baoprasertkul P, Xu P, Kucuktas H,
Nandi S, Somridhivej B, Serapion J, Simmons M, Turan C, Liu L, Muir W, Dunham R, Brady Y, Grizzle J, Liu Z:Towards the ictalurid catfish transcriptome: generation and analysis of 31,215 catfish ESTs.BMC genomics2007,8:177.
26. Nonneman D, Waldbieser GC:Isolation and enrichment of abundant microsatellites from a channel catfish (Ictalurus punctatus) brain cDNA library.Anim Biotechnol2005,16:103-116.
27. Clark MS, Edwards YJ, Peterson D, Clifton SW, Thompson AJ, Sasaki M, Suzuki Y, Kikuchi K, Watabe S, Kawakami K, Sugano S, Elgar G, Johnson SL: Fugu ESTs: new resources for transcription analysis and genome annotation.Genome Res2003,13:2747-2753.
28. Lo J, Lee S, Xu M, Liu F, Ruan H, Eun A, He Y, Ma W, Wang W, Wen Z, Peng J:15000 unique zebrafish EST clusters and their future use in microarray for profiling gene expression patterns during embryogenesis.
Genome Res2003,13:455-466.
29. Poustka AJ, Groth D, Hennig S, Thamm S, Cameron A, Beck A, Reinhardt R, Herwig R, Panopoulou G, Lehrach H:Generation, annotation, evolutionary
analysis, and database integration of 20,000 unique sea urchin EST clusters.Genome Res2003,13:2736-2746.
30. Rise ML, von Schalburg KR, Brown GD, Mawer MA, Devlin RH, Kuipers N, Busby M, Beetz-Sargent M, Alberto R, Gibbs AR, Hunt P, Shukin R, Zeznik JA, Nelson C, Jones SR, Smailus DE, Jones SJ, Schein JE, Marra MA,
Butterfield YS, Stott JM, Ng SH, Davidson WS, Koop BF:Development and application of a salmonid EST database and cDNA microarray: data mining and interspecific hybridization characteristics.Genome Res2004, 14:478-490.
31. Udall JA, Swanson JM, Haller K, Rapp RA, Sparks ME, Hatfield J, Yu Y, Wu Y, Dowd C, Arpat AB, Sickler BA, Wilkins TA, Guo JY, Chen XY, Scheffler J, Taliercio E, Turley R, McFadden H, Payton P, Klueva N, Allen R, Zhang D, Haigler C, Wilkerson C, Suo J, Schulze SR, Pierce ML, Essenberg M, Kim H, Llewellyn DJ,et al:A global assembly of cotton ESTs.Genome Res2006, 16:441-450.
32. Gorodkin J, Cirera S, Hedegaard J, Gilchrist MJ, Panitz F, Jørgensen C, Scheibye-Knudsen K, Arvin T, Lumholdt S, Sawera M, Green T, Nielsen BJ, Havgaard JH, Rosenkilde C, Wang J, Li H, Li R, Liu B, Hu S, Dong W, Li W, Yu J, Wang J, Staefeldt HH, Wernersson R, Madsen LB, Thomsen B, Hornshøj H, Bujie Z, Wang X, Wang X,et al:Porcine transcriptome analysis based on 97 non-normalized cDNA libraries and assembly of 1,021,891 expressed sequence tags.Genome Biol2007,8:R45.
33. Gut IG, Lathrop GM:Duplicating SNPs.Nat Genet2004,36:789-790. 34. Koop BF, von Schalburg KR, Leong J, Walker N, Lieph R, Cooper GA,
Robb A, Beetz-Sargent M, Holt RA, Moore R, Brahmbhatt S, Rosner J, Rexroad CE, McGowan CR, Davidson WS:A salmonid EST genomic study: genes, duplications, phylogeny and microarrays.BMC genomics2008, 9:545.
35. Taylor JS, Braasch I, Frickey T, Meyer A, Peer Van de Y:Genome duplication, a trait shared by 22,000 species of ray-finned fish.Genome Res2003,13:382-390.
36. Catfish EST Assembly.http://www.animalgenome.org/aquaculture/catfish/ projects/auburn/suppl2010.0113.html.
37. Wang S, Sha Z, Sonstegard TS, Liu H, Xu P, Somridhivej B, Peatman E, Kucuktas H, Liu Z:Quality assessment parameters for EST-derived SNPs from catfish.BMC Genomics2008,9:450.
38. Huang X, Madan A:CAP3: A DNA sequence assembly program.Genome Res1999,9:868-877.
39. Iseli C, Jongeneel CV, Bucher P:ESTScan: a program for detecting, evaluating, and reconstructing potential coding regions in EST sequences.Proc Int Conf Intell Syst Mol Biol1999, 138-148.
40. Lottaz C, Iseli C, Jongeneel CV, Bucher P:Modeling sequencing errors by combining Hidden Markov models.Bioinformatics2003,19(Suppl 2): ii103-112.
41. Min XJ, Butler G, Storms R, Tsang A:TargetIdentifier: a webserver for identifying full-length cDNAs from EST sequences.Nucleic Acids Res2005, 33:W669-672.
42. Thurston MI, Field D:Msatfinder: detection and characterisation of microsatellites.http://www.genomics.ceh.ac.uk/msatfinder/.
43. Rozen S, Skaletsky H:Primer3 on the WWW for general users and for biologist programmers.Methods Mol Biol2000,132:365-386. 44. Barker G, Batley J, H OS, Edwards KJ, Edwards D:Redundancy based
detection of sequence polymorphisms in expressed sequence tag data using autoSNP.Bioinformatics2003,19:421-422.
doi:10.1186/gb-2010-11-1-r8
Cite this article as:Wanget al.:Assembly of 500,000 inter-specific
catfish expressed sequence tags and large scale