International Journal of Emerging Technology and Advanced Engineering
Website: www.ijetae.com (ISSN 2250-2459, ISO 9001:2008 Certified Journal, Volume 7, Issue 4, April 2017)
49
Case Study to Analysis GSM Network by Using 3G KPI
Report
Nishtha Saxena1, Associate Prof. Ramesh Bharti2 1,2Jagannath University, Jaipur, India Abstract - In this Dissertation, The overall system consists
of Base Station Subsystem (BSS), Network and Switching
Subsystem (NSS), and Operation Support System (OSS).
The BSS consists of Base Transceiver Stations (BTSs) and
the Base Station Controllers (BSCs). The NSS consists of
Mobile-services Switching Center (MSC), and several
databases (e.g., HLR, VLR, EIR, and AUC). Radio network
planning is perhaps the most important part of GSM system
design process owing to its proximity to mobile users. This
Dissertation present, a basic Approach to radio network
planning that provides effective solution in terms of
coverage and quality. The objective of this study, which is
coverage driven is to find the minimum number of sites
required providing sufficient coverage. large no. of BTS
present in the network which we check their individual &
mutual performance on the basis of different parameters.
In this 3G KPI parameter for GSM are used on the basis of
telecom software .There are few example of parameters like
total Attempted Calls, Total Dropped Calls, Total Blocked
Calls etc.by improving these parameters, we improve the
quality of network.
PATHLOSS: proper linking purpose
I. INTRODUCTION TO ANALYSIS OF GSMNETWORK The aim of Analysis is to maximize the quality of Services (QoS) of the GSM Network. In order to do this we need to measure the quality of quality of services (QoS), compare the measured value with the desired value, and then take steps to correct the causes of any deviations from the desired value. The goal is to reach or exceed the customers required level of performance.
International Journal of Emerging Technology and Advanced Engineering
Website: www.ijetae.com (ISSN 2250-2459, ISO 9001:2008 Certified Journal, Volume 7, Issue 4, April 2017)
50 The outcome of the process is an optimization report which gives details on the changes needed to be done in the database; antenna tilts etc. to improve the quality of the network.
II. PROBLEM STATEMENT
RF Optimization teams used to analyze performance stats and evaluate QoS offered by the existing network. Since the deployment of GSM network, it has been observed practically that there are many phenomena and issues which have been neglected in literature/available text but they severely influence the network performance. To analyze the network performance dropped calls, especially in the midst of handover, are normal in GSM organizations in Delhi and in various other making countries. Call drops and handover hardships are by and large because of lacking radio assets. To open up the augmentation extents of BTSs with the end goal that handover and drop call probabilities are decreased to a base, the execution of cell part, sectoring, and effective handover association is required. Cell part, sectoring, and beneficial asset association, if true blue executed, could lessen unbalanced call misfortunes in light of handover. To accomplish this lessening, the augmentation extent of every cell is at initially updated (split) to oblige downsized scale cells and Pico-cells. Obviously, cell part builds the rate of handoff. In any case, coming about to the augmentation extents of the unmistakable cells now cover, the following handoff is conventionally a smooth one and does not moment the loss of an on-going call(s). Sectoring incorporates that the omnidirectional accepting wires, which are exhibited by different regulators, be supplanted with a couple zone radio wires. Sectoring utilizes directional social occasion gadgets to further control the piece and rehash reuse of channels. Division gathering contraptions convey light releases control than Omni-directional radio wires; thusly, sectoring greatly enhances system scope.
In the dissertation, we analyzed the latest drop call due to interference, handover, missing neighbouring ARFCN, Hardware fault data obtained from the MSC, and explored ways to improve the overall quality and level of signal strength of the network.
Traffic Analysis of GSM Network: We have considered a GSM Network to analyses the Network Performance. The key parameters to be considered are-
•Call Success Rate •Call Setup Success Rate •Handover Success Rate •Dropped Call Rate •TCH Blocking Rate
Call Success Rate: Call Success Rate is a network "figure of merit" which quantifies the network from a subscriber’s perspective. It represents the proportion of calls that are successfully completed. For this to occur the call must be successfully setup and should not be suffer a RF Loss prior to subscriber termination or handover.
International Journal of Emerging Technology and Advanced Engineering
Website: www.ijetae.com (ISSN 2250-2459, ISO 9001:2008 Certified Journal, Volume 7, Issue 4, April 2017)
51 Dropped Call Rate (DCR): A dropped call occurs when the subscriber has an allocated TCH and this is abnormally released due to either RF loss or equipment problems. The drop call rate therefore is a measure of the proportion of subscribers that successfully access a TCH, but then abnormally drop the call. Thus DCR for a network is given more weightage and should be as low as possible. Drop call rate is an important parameter as far as performance is 0.5%.
III. RECOMMENDATION TO IMPROVE DCR (a) Poor Down link level: This is the main reason for the drop calls. If calls are dropping because of this reason at the boundary cells then expansion of the network is the solution. However, if it is caused because of some blind spots present in the network then this can be avoided by putting up more sites in the area, improving the EIRP of the existing cells, installation of repeaters etc. if these options affect the network performance owing to high interference because of more reuse then deployment of Micro, Pico Cells and underlay overlay cells can be very good options.
(b) Poor Downlink Quality: If the received level in the downlink level is good and the quality goes bad, it can be inferred that the major reason for poor quality is interference. Interference is either Co – Channel or/and Adjacent Channel. If certain area is affected by interference resulting in poor quality then one of the ways to reduce interference level is by redefining your coverage boundaries, which can be achieved by increasing antenna down tilt and reducing antenna height. EIRP of a BTS can also be reduced to counteract interference. Frequency plan deployed in the network can be redefined and reuse distance can be increased while dealing with quality problem in general.
(c) Poor uplink Level: Generally in the coverage boundaries of cells covering large area, calls drop because of poor uplink level owing to high path loss. Probable solutions without reducing the coverage boundary of a cell are to important Tower Mounted Amplifiers (TMAs).
TMAs improve the sensitivity of the receiving BTS antenna thus improving the uplink level and reducing the link imbalance.
(d) Poor uplink Quality: Uplink quality can be poor because of interference in the uplink. Discontinuous transmission and dynamic poor control in the uplink can be used to reduce interference in the uplink.
(e) MS Loss during handover: Unsuccessful handover attempts result in dropped call if the handovers are imperative. In other words inability of a MS to return back to the old cell after an unsuccessful attempt at the neighbour results in dropped call. This could be due to lack of TCH resources in the target cell. The obvious solution is to increase the capacity of congested target cell to cater to the handover attempts made to it.
TCH Blocking: The TCH Blocking rate is defined as the proportion of TCH requested from originating and hand in calls that fail due to there being insufficient TCH resources to carry the call.
Recommendation to improve TCH Blocking Rate: Problem of TCH blocking can be resolved by deploying additional RF carriers with in the cell. This will increase the number of TCHs.
•Congestion relief feature can be enabled •Directed Retry Feature can be enabled. •Call quenching feature can be enabled.
International Journal of Emerging Technology and Advanced Engineering
Website: www.ijetae.com (ISSN 2250-2459, ISO 9001:2008 Certified Journal, Volume 7, Issue 4, April 2017)
52 The counter is accessible on the switch or OMC and is recorded 24 hours a day, each day of the year. Notwithstanding, to report the execution the estimations must be taken amid the Bustling Hour of the day.
GSM Operation and Network Planning
Introduction of GSM: A GSM network is made up of three subsystems-
1. The Mobile Station (MS)
2. The Base Station Sub-system (BSS) –comprising a BSC and several BTSs
3. The Network and Switching Sub-system (NSS) – comprising an MSC and associated registers Several interfaces are defined between different parts of the system:
Abbreviations:
MSC – Mobile Switching Centre BSS – Base Station Sub-system
BSC – Base Station Controller HLR – Home Location Register
BTS – Base Transceiver Station VLR – Visitor Location Register
TRX– Transceiver AuC – Authentication Centre
MS – Mobile Station EIR – Equipment Identity Register
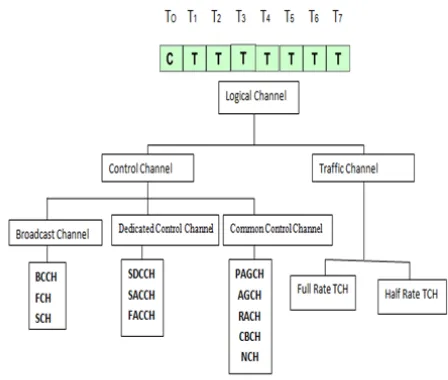
OMC – Operations and Maintenance Centre PSTN – Public Switched Telephone Network Physical and Logical Channel:
[image:4.595.317.541.140.330.2]ARFCN (200 KHz):
Fig. 1. Diagram Showing Logical Channels Classification
Logical Channels:
Traffic Channels: Traffic Channels carry either encoded speech or user data Two forms of Traffic Channels are defined :
Full rate Traffic Channel: Carries encoded information at gross rate of 22.8Kbps
Half rate Traffic Channel: Carries encoded information at gross rate of 11.4 Kbps
Speech Traffic Channels:
Full rate Traffic Channel for speech: Speech out of encoded information is at 13 kbps
Half rate Traffic Channel for speech: Speech out of encoded information is at 6.5 kbps
Data Traffic Channels:
Full rate Traffic Channel for 9.6 kbps user data, Full rate Traffic Channel for 4.8 kbps user data, Full rate Traffic Channel for < 2.4 kbps user data
International Journal of Emerging Technology and Advanced Engineering
Website: www.ijetae.com (ISSN 2250-2459, ISO 9001:2008 Certified Journal, Volume 7, Issue 4, April 2017)
53 Frequency Correction Channels (FCCH): Carries Information for frequency correction of the mobile stations. (Downlink)
Synchronization Channels (SCH): Carries information for frame synchronization of the mobile stations and identification of BTS (Downlink). Contains two pieces of information: BSIC & Reduced Frame Number
Broadcast Control Channels (BCCH): Broadcasts various cell parameters and other information required by the mobile to access the network. (Downlink)
Dedicated Control Channels: Standalone dedicated control channel (SDCCH): Used for conveying signaling information (Downlink & Uplink).
Slow Associated Control Channel (SACCH): Used for conveying slow information associated with SDCCH and TCH (Downlink and Uplink).
Fast Associated Control Channel (FACCH): Associated with TCH for conveying fast signaling information (D & U).
Cell Broadcast Control Channel (CBCH): Subset of SDCCH used for broadcasting cell broadcast messages (Downlink).
Cell Planning Principals: The principles of cell planning which are covered in more depth in the G101 (Radio Planning Fundamentals) and G103 (Advanced GSM Cell Planning) include-
•Coverage Prediction •Network Dimensioning •Traffic Capacity •Frequency Planning •Dual Band Systems
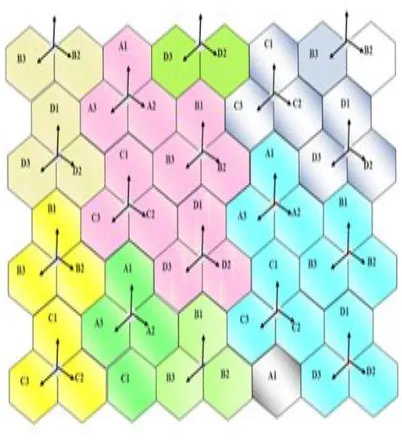
Frequency Planning: Frequency Re-use: GSM uses concept of cells one cell covers small part of network but Network has many cells. Frequency used in one cell can be used in another cell. This is known as Frequency Re-use.
CO Channel (Re-use) Cell:
Fig.2 Diagram Showing Frequency Re-use Pattern Objective:
•Optimum uses of Resources •Reduce Interference •Co - Channel Re-use factor
International Journal of Emerging Technology and Advanced Engineering
Website: www.ijetae.com (ISSN 2250-2459, ISO 9001:2008 Certified Journal, Volume 7, Issue 4, April 2017)
54 Adjacent-Channel Re-use Criteria:
Adjacent ARFCN's should not be used in the same cell it will have no problems in Downlink, but will have high risk of uplink interference (due to mandatory uplink power control). Adjacent ARFCN's can be used in adjacent cells, but as far as possible should be avoided. As such separation of 200 KHz is sufficient, but taking into consideration the propagation effects, as factor of protection 600 KHz should be used. In the worst, Adjacent ARFCN's can also be used in adjacent cells by setting appropriate handover parameters.
Re-use Patterns: Re-use Patterns ensures the optimum separation between Co-Channels. Re-use pattern is a formation of a cluster with a pattern of frequency distribution in each cell of the cluster. Same cluster pattern is then re-used. Preferred Re-use Patterns- Sector - Cells: 3/9, 4/12
[image:6.595.329.530.158.382.2]3/9 Re-use Pattern:
Fig. 3. Diagram Showing 3/9 Frequency Re-use Pattern
[image:6.595.61.265.409.646.2]4/12 Reuse Patterns:
Fig. 4. Diagram Showing 4/12 Reuse Patterns
Traffic Theory: Traffic Theory based on Various Parameter-
•Traffic Intensity •Busy Hour
•Request Rate ( BHCA ) •Set-up Time
•Holding Time •Blocked Call
•Grade of Service (GoS)
Critical Network Implementation Features: • Dynamic Power Control
• Discontinuous Transmission • Frequency Hopping
• Intra-cell Handover
Dynamic Mobile Power Control:
International Journal of Emerging Technology and Advanced Engineering
Website: www.ijetae.com (ISSN 2250-2459, ISO 9001:2008 Certified Journal, Volume 7, Issue 4, April 2017)
55 Frequency Hopping: Multipath Fading results in variations in signal strength which is known as Rayleigh Fading. Rayleigh Fading phenomenon is dependent on path difference and hence frequency of reception. A fast moving mobile may not experience severe effect of this fading since the path difference is continuously changing. A slow moving mobile (or a halted mobile) may experience severe deterioration in quality. But, if the frequency of reception is changed when this problem occurs, could solve it. The fading phenomenon is fast and almost continuous, this means the frequency change should also be continuous. This process of continuously changing frequency is known as Frequency Hopping. Frequency Hopping is done in both Uplink and Downlink. Frequency is changed in every TDMA Frame Mobile can Hop on maximum 64 frequencies. The sequence of Hopping can be Cyclic or Non-Cyclic, There are 63 Non-Cyclic Hopping sequences possible Different Hopping sequence can be used in the same cell. BCH Timeslot can never HOP, but the remaining Timeslots can very well hop.
Troubleshooting & Optimizing GSM Networks: Troubleshooting:
• Blocked Calls
• Poor Quality and Drop calls • Abnormal Handovers • Interference
• Termination Failures
Blocked Call Troubleshooting: Blocked Calls can occur due to
• Access Failures • SDCCH Congestion • SDCCH Drop
• TCH Congestion
Blocked Call - Cause troubleshooting • CCCH Overload at the Base Station • Uplink Interference at the Base Station • Low Rxlev at the Base Station
• Base Station TRX decoder malfunctioning • Downlink Low Rxlev (Coverage Hole)
• Downlink Interference • Excess Cell Range
Access Failure - Uplink Problem: Causes • AGCH Overload at Base Station • RACH Collisions
• MS out of Range • Poor Uplink quality • BTS Receiver Problem
RACH Non-Detection:
Fig.5 Block Diagram Showing RACH Non Detection
Now let us go a step further in understanding the most probable causes behind call block problems.
Access Failures: It could simply be caused by coverage holes. Interference could however play an important role. Uplink interference on a serving cell can result in RACH rejections and hence no AGCH assignments. Improper channel distribution between AGCH and PCH (paging channel) can result in RACH/AGCH overloading. Paging Failures can be impacted by BCH pollution (co-channel and adjacent channel interference).
International Journal of Emerging Technology and Advanced Engineering
Website: www.ijetae.com (ISSN 2250-2459, ISO 9001:2008 Certified Journal, Volume 7, Issue 4, April 2017)
56 TCH Blocked: Heavy Traffic is the main cause of TCH congestion. The TCH can also be blocked due to continuous interference in the uplink. Solutions to access failures would be to ensure continuous coverage and optimization of CCCH configuration parameters. For TCH and SDCCH congestion, the hot spots need to be identified and load sharing techniques implemented. Some techniques that have been used successfully involve adjusting cell powers to vary the coverage and therefore the location where mobiles will hand over from one cell to the next. Interference management is essential for optimum network performance. Location updates can be optimized by independent drive tests on the ALL BCH carriers. The delta is measured of each BCH with the current serving BCH and the Reselect Hysteresis parameters adjusted appropriately.
SDCCH Congestion Cause: Location Updates- To be analyzed with OMC statistics first. If high, determine the source to target cell ratio, Drive around the suspected area in the Idle Mode Configure “Delta LAC < > Constant 0” alarms Optimize Location Updates
Interference: Analyze OMC statistics on “Idle Channel Interference” Carry out Uplink Interference Measurements using Viper.
Heavy Traffic: Verify from OMC statistics SDCCH Congestion
Carry Call Setup Time measurements
Optimize set up time if high, else modify channel configuration
TCH Blocked – Causes Interference: Verify Idle Channel Interference reports from OMC If suspected, carry out uplink interference measurements
Heavy Traffic: Verify the TCH Holding time and no of attempts statistics from OMC during low traffic hours, Activate Cell barring in the cell Carry out Time slot testing, by setting Ignore Cell Barring.
Solutions To Blocked Calls: • Optimize coverage • Optimize Cell loading • Interference management • Channel configurations • Optimize neighbors
Blocked Call – Interference:
• Base Station Measures Uplink Interference on Idle Timeslots
• At regular intervals, categorizes Timeslots into Interference Bands.
• There are Five Interference Bands.
• Each Interference Band has a range of interference level.
Example:
Interference Band1= -105 to -95 dbm Interference Band2= - 95 to -85 dbm Interference Band3= - 85 to -70 dbm Interference Band4 =- 70 to -50 dbm Interference Band5= -50 dbm and above
• Network will assign Timeslots starting from lower band
• Interference Band “5” Timeslots are considered as “BLOCKED”
• OMC reports Hourly average statistics for each timeslot.
International Journal of Emerging Technology and Advanced Engineering
Website: www.ijetae.com (ISSN 2250-2459, ISO 9001:2008 Certified Journal, Volume 7, Issue 4, April 2017)
[image:9.595.52.287.157.286.2]57 Drop Call - Troubleshooting:
Fig. 6. Flow Chart of Dropped Call Troubleshooting Poor Quality:
Poor Speech Quality could be due to • Patchy Coverage ( holes)
• No Target cell for Handover • Echo , Audio holes, Voice Clipping
Interference: • Co-channel • Adjacent channel • External
• Multipath • Noise
Speech Quality Parameters:
• RxQUAL: Measured on the midamble. Indicates poor speech quality due to radio interface impairments
• FER: Measured on the basis of BFI (Ping -Pong effect on speech) Preferred under Frequency Hopping situation
• Echo and distortion: Generally caused by the Transmission and switching system.
• Audio holes: Blank period of speech, due to malfunctioning of Transcoder boards or PCM circuits.
• Voice Clipping: Occurs due to improper implementation of DTX.
• Mean Opinion Score (MOS) : ITU standard for estimating speech quality.
Troubleshooting Handover Problems: • Total Attempted Calls
• Total Dropped Calls • Total Blocked Calls • Rx Qual Full • Rx Level Full • RLT Current Value • ARFCN
• Neighbor Cell Measurements • RR Message
• Phone State • Sequence Number
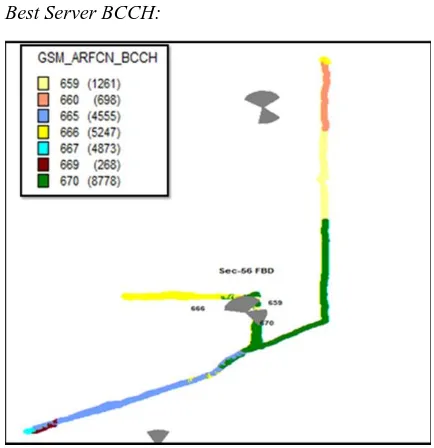
V. CASE STUDY TO ANALYSIS GSMNETWORK BY USING 3GKPIREPORT
Best Server BCCH:
[image:9.595.313.530.441.665.2]International Journal of Emerging Technology and Advanced Engineering
Website: www.ijetae.com (ISSN 2250-2459, ISO 9001:2008 Certified Journal, Volume 7, Issue 4, April 2017)
[image:10.595.56.273.149.403.2]58 Downlink Signal Level (Rx Lev, dBm):
Fig. 8. Diagram Showing Plots of Downlink Signal Level (Rx Lev,
dBm)
Downlink Signal Level (Rx Lev, dBm):
Fig. 9. Diagram Showing Graphical
[image:10.595.320.534.173.392.2]Representation of Downlink Signal Level (Rx Lev, dBm) Downlink Signal Quality (Rx Qual):
Fig.10. Diagram Showing Plots of Downlink Signal Quality (Rx
Qual)
Downlink Signal Quality (Rx Qual):
Fig. 11. Diagram Showing Graphical Representation of Downlink
[image:10.595.315.550.456.745.2] [image:10.595.47.269.462.741.2]International Journal of Emerging Technology and Advanced Engineering
Website: www.ijetae.com (ISSN 2250-2459, ISO 9001:2008 Certified Journal, Volume 7, Issue 4, April 2017)
[image:11.595.48.237.145.473.2]59 Downlink Signal Interference (C/I):
Fig. 12. Diagram Showing Plots of Downlink Signal Interference
(C/I)
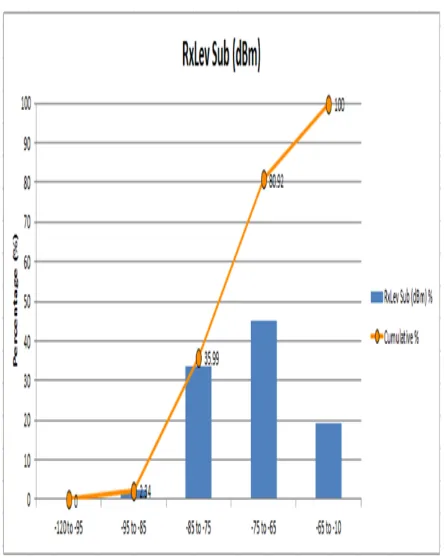
Downlink Signal Level:
Table.1.
Representation of Downlink Signal Level
Rx_Lev Samples distribution
Range Samples % of Samples
-35 To -65 dBm 6958 27.01
-65 To -75 dBm 15343 59.56
-75 To -85 dBm 3405 13.22
-85 To -95 dBm 54 0.21
-95 dBm< 0 0.00
[image:11.595.306.554.177.340.2]Downlink Signal Quality: Table. 2.
Representation of Downlink Signal Quality
Rx_Qual Samples distribution
Range Samples % of Samples
<= 5 9644 95.07
6 to 7 500 4.93
Other 0 0.00
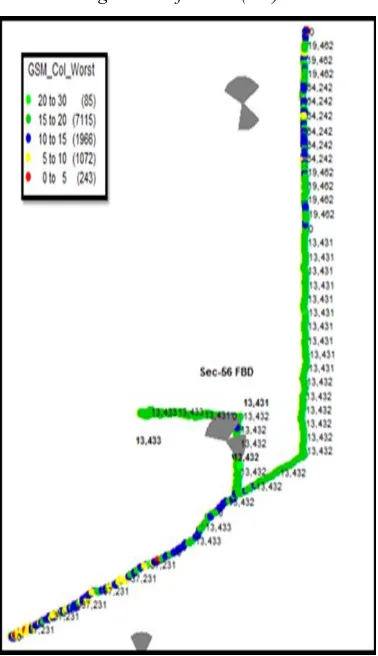
[image:11.595.308.554.398.652.2]C/I Samples distribution: Table 3.
Representation of C/I Samples Distribution
C/I Samples distribution
Range Samples % of Samples
> 20 85 0.81
20 To 15 7115 67.88
15 To 10 1966 18.76
10 To 5 1072 10.23
[image:11.595.42.286.558.734.2]International Journal of Emerging Technology and Advanced Engineering
Website: www.ijetae.com (ISSN 2250-2459, ISO 9001:2008 Certified Journal, Volume 7, Issue 4, April 2017)
60 VI. RESULT
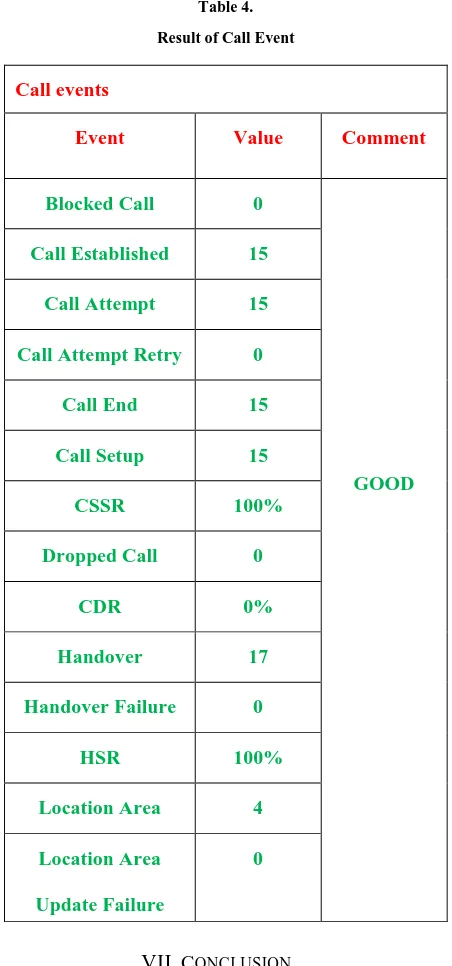
[image:12.595.51.277.158.641.2]Table 4.
Result of Call Event
Call events
Event Value Comment
Blocked Call 0
GOOD
Call Established 15
Call Attempt 15
Call Attempt Retry 0
Call End 15
Call Setup 15
CSSR 100%
Dropped Call 0
CDR 0%
Handover 17
Handover Failure 0
HSR 100%
Location Area
Update
4
Location Area
Update Failure
0
VII.CONCLUSION
In this Dissertation, analytically proved that we can optimize an existing cellular network using optimization tools likes TEM’S, MapInfo and fine parameter tuning. By giving some input for planning and optimization we get these information from traffic Report, customer complain and drive test. After analyzing all required data we can know what steps we need to do.
Each operator has their own KPI. Operator wants to fulfill their target according to their KPI Report and they must think about it within their bandwidth limitation. This study would help to plan operators to maintain coverage Level, improve quality and increase capacity. Every mobile operator should give attention towards better network dimensioning & topology, allocated bandwidth, traffic prediction & modelling. BAD Spot 1 has poor quality and Call Drop, this spot is covered by Cell 3459, Poor Coverage. Level below -85 dbm, but Call should not Drop, the other Problem is Interference, Co-Channel on BCH is very high.95.7% of the time quality will be very good.
REFERENCES
[1] Francisco, A. M. and Luis, M. C., (1999), Mobility Effects on
Tele traffic in GSM, Institution de Telecommunication /
Institution Superior Técnico, Technical University of Lisbon,
1999.
[2] Hugo, A., José C., and Luis M. C., (2000), Analysis of a Traffic
Model for GSM/GPRS, Instituto de Telecomunicações/Instituto
Superior Técnico, Technical University of Lisbon, 2000.
[3] Papaoulakis K. N., Nikitopoulos D., Gkroustiotis E., Kechagias
C., Karambalis C. and Karetsos G. (2002), A Comprehensive
Study and Performance Evaluation of Operational GSM and
GPRS Systems under Varying Traffic Conditions,
Telecommunications Laboratory National Technical University
of Athens Heroon Polytechniou 9, 15773 Athens, Greece.
newton.ee.auth.gr /ist2002 /papers/ SessionT4 / 2502089
[4] Allen, K., Fitzpatrick, P. and Ivanovich, M., (2003), Joint Traffic
Signaling Capacity Analysis in GSM.
[5] Huei-Wen, F. and Yi-Chou T., (2003), Channel Allocation and
Performance Study for the Integrated GSM/GPRS System,
Department of Computer Science and Information Engineering,
National Taiwan University of Science and Technology, IEEE,
2003.
[6] Fiche, G. and Hebuterne, G. (2004), Communicating systems &
networks: Traffic & performance. 2004. Kogan page. ISBN:
International Journal of Emerging Technology and Advanced Engineering
Website: www.ijetae.com (ISSN 2250-2459, ISO 9001:2008 Certified Journal, Volume 7, Issue 4, April 2017)
61
[7] Kennedy I.,(2005), Lost Call Theory, Lecture Notes, ELEN5007
Tele- traffic Engineering, School of Electrical and Information
Engineering, University of the Witwatersrand, 2005.
[8] Božidar, V., (2006), Modeling and Characterization of Traffic in a
Public Safety Wireless Network, Master of Applied Science
Thesis, Simon Fraser University, Fall 2006.
[9] Xiaolong, J. and Geyong, M., (2007), Modeling Priority Queuing
Systems with Multi-Class Self-Similar Network Traffic,
Proceedings of ICC'07, pp. 13-19.
[10] Adegoke, A., Babalola I., and Balogun, W. (2008) "Performance
Evaluation of GSM Mobile System in Nigeria," Pacific Journal of
Science and Technology, pp. 436-441, 2008.
[11] Haider B, Zafrullah M. and Islam M. K. (2009),Radio Frequency
Optimization and QoS Evaluation in Operational GSM Network,
Proceedings of the World Congress on Engineering and
Computer Science 2009 Vol I WCECS 2009, October 20 -22,
2009, San Francisco, USA.
[12] Boulmalf, M., Abrache, J., Aouam, T., and Horroud, H.
(2009),"Traffic Analysis of GSM Networks," IEEE Journal, pp.
498 -503, 2009.
[13] Biebuma, J.J.,Orakwe, S.I and Igbekele, O.J., (2010), Traffic
Modeling for Capacity Analysis of GSM Networks in Nigeria,
Continental Journal of Information Technology, 4: 78 – 79.
[14] Flood, J.E. (1998) Telecommunications Switching, Traffic and
Networks, Chapter 4: Telecommunications Traffic, New York:
Prentice-Hall, 1998.
[15] Madhusmita, P and Saraju, P. P., (2011), "Traffic Analysis and
Optimization of GSM Network," IJCSI International Journal of
Computer Science Issues, pp. 28-31, 2011.
[16] Alarape, M.A., Akinwale, A.T. and Folorunso, O. (2011), A
Combined Scheme for Controlling GSM Network Calls
Congestion. International Journal of Computer Application (0975
-8887), Vol.14 No. 3.
[17] Ojesanmi, O.A., Oyebisi, T.O., Oyebode, E.O. and Makinde,
O.E., (2011), Performance Analysis of Congestion Control
Scheme for Mobile Communication Network, International
Journal of Computer Science and Telecommunications, Volume
2, Issue 8, November 2011
[18] Jabari, B.,(1996), Teletraffic Aspects of Evolving and
Next-Generation Wireless Communication Networks, IEEE
Personal Communications Mag., Vol. 3, No.6, Dec. 1996, pp4 -9
[19] Mughele, E. S and Wole O., (2012), Congestion Control
Mechanisms and Patterns of Call Distribution in GSM
Telecommunication Networks: The Case of MTN Nigeria,
African Journal of Computer and ICT. December, 2012- ISSN
2006-1781, Vol. 5 No.
[20] Ohaneme, C. O., Akpado, K. A., Alumona, T. L. and Emenike,
I. S.,(2012), "Performance Evaluation of Mobile Network
Interconnections in Nigeria," International Journal of Scientific
and Engineering Research, pp. Volume 3, Issue 4, 2012.
[21] U S Rahman, M. A. Matin, M R Rahman, (2012), A Practical
Approach of Planning and Optimization for Efficient Usage of
GSM Network, International Journal of Communications (IJC)
Volume 1 Issue 1, December 2012.
[22] Oladeji E.O, Onwuka E.N, Aibinu M.A (2013) Determination of
Voice Traffic Busy Hour and Traffic Forecasting in Global
System of Mobile Communication (GSM) in Nigeria, 11th
Malaysia International Conference on Communications 26th -