Introduction
Increasing demand for critical care has made capacity limitations commonplace in the ICU [1]. Th ese limita-tions occur when there are no available ICU beds for patients with critical illness, leading to delays in ICU admission that have important clinical and economic consequences. Admission delays can result in the board-ing of critically ill patients in the emergency department or in other hospital units, which is associated with increased morbidity and mortality [2,3]. Admission delays can also result in decreased revenue for hospitals, as they may force hospitals to cancel elective surgeries or transfers from outside hospitals.
Th ese problems have forced the critical care com mu-nity to develop innovative ways to address capacity constraints and improve throughput. Yet these problems are not unique to the ICU, or even unique to healthcare
in general. Limited capacity and the resulting problems of waiting times and throughput losses exist in many processes, ranging from fi nancial services to automotive production. Th e academic fi eld of operations manage-ment is specifi cally designed to address these issues. Th e purpose of the present review is to provide a brief overview of operations management and to present a set of case studies from work environments other than hos-pi tals, thereby exposing readers to operations manage-ment and its potential application to critical care.
What is operations management?
Working with capacity limitations
Many operations – in particular, service processes such as restaurants and airlines – have high fi xed costs. Th ese fi xed costs typically refl ect the cost of maintaining a certain capacity availability, where capacity is defi ned as the maximum number of customers that can be served per unit of time. Examples of fi xed costs include the wages required to pay labor or the cost of machinery for production. Yet while costs in services tend to be fi xed, revenue increases proportionally to the number of customers served per unit time – also referred to as throughput. Th is scenario creates an economic incentive to operate the process at a high level of utilization, where utilization is defi ned as the ratio of the number of customers served (the throughput) to the maximum number of customers that we could serve (the capacity).
Consider the following simplifi ed example. A service has a fi xed cost of $1,000 per day and obtains $20 per customer served. Th e operation thus breaks even at 50 customers served per day. At 60 customers per day, the service obtains $200 in profi ts per day. At 70 customers, the process obtains $400 in profi ts. In other words, increasing the number of customers served from 60 to 70 (a 16.7% increase) leads to a 100% increase in profi ts. Th e marginal (additional) cost of service is zero while the marginal revenue is high. Maximizing utilization becomes a key priority.
Understanding the problem
By defi nition, utilization cannot exceed 100%. Th e money-seeking manager is thus tempted to seek almost
Abstract
As your hospital’s ICU director, you are approached by the hospital’s administration to help solve ongoing problems with ICU bed availability. The ICU seems to be constantly full, and trauma patients in the emergency department sometimes wait up to 24 hours before receiving a bed. Additionally, the cardiac surgeons were forced to cancel several elective coronary-artery bypass graft cases because there was not a bed available for postoperative recovery. The hospital administrators ask whether you can decrease your ICU length of stay, and wonder whether they should expand the ICU to include more beds For help in understanding and optimizing your ICU’s throughput, you seek out the operations management researchers at your university.
© 2010 BioMed Central Ltd
Working with capacity limitations:
operations management in critical care
Christian Terwiesch
1*, Diwas KC
2and Jeremy M Kahn
3,4V I E W P O I N T
*Correspondence: [email protected]
1Department of Operations and Information Management, The Wharton School,
Leonard Davis Institute of Health Economics, University of Pennsylvania, Huntsman Hall 573, 3730 Walnut Street, Philadelphia, PA 19104, USA
Full list of author information is available at the end of the article
100% utilization. And high utilization, in and by itself, is not a problem. To see this, assume in an example process that customers arrive exactly once every 5 minutes (12 customers arrive per hour). Further, assume that it takes us exactly 4 minutes to serve each customer (thus, we could serve up to 15 customers per hour). Th e resulting utilization in this process would be 12 / 15 = 80%. We might be tempted to call this a 20% under utilization and seek additional demand to improve our profi tability.
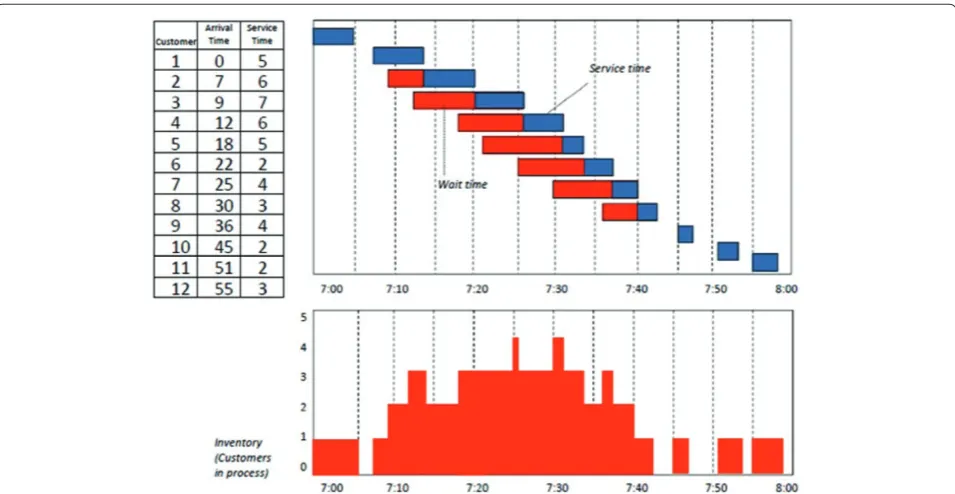
Th is strategy, however, would ignore an important reality of service delivery – variability. Customers are not widgets in an assembly line. Th e amount of service time depends on the particular needs of the customer at hand. Furthermore, the arrival times of individual customers
may not be known in advance. Th ese sources of
un-certainty create a stochastic eff ect on our process. Consider the data shown in Figure 1. Just as before, 12 customers arrive per hour. Th is time, however, the arrival times are random. Similarly, we again take 4 minutes, on average, to serve a customer. Yet some customers get served quickly while others take longer. Although the mean demand and capacity remain constant, Figure 1 reveals that what previously appeared as an underutilized process is in reality a rather busy place. Indeed, some customers (for example, the fi fth and sixth customers) spend much more time waiting than they spend in service. We also observe that the number of customers in the process at any one time goes as high as four (three
waiting, one being served). Contrast this with the previous deterministic scenario, where each customer is served immediately upon arrival.
Variability is the enemy of operations. An 80% utiliza-tion of an automated assembly line with limited or no variability might be underutilized; an 80% utilization of a time-critical service in the presence of variability is asking for trouble. Th e example in Figure 1 assumed that customers would patiently wait in line until it is their turn to be served. But it is easy to conceive of settings in which customers might not be able or willing to wait. Th e branch of operations management that mathematically analyzes the interplay between process fl ows, utilization, and variability is referred to as queuing theory. Various mathematical models exist to inform the capacity planning in such an environment. For example, one might ask for the amount of capacity that is needed (the number of people to be hired, or the equipment to be purchased) so that customers get served in a given expected wait time.
[image:2.612.68.546.88.335.2]increase in utilization can therefore more than double the waiting time. Th is detrimental eff ect on the process’s responsiveness needs to be kept in mind when we accept more demand in an attempt to increase utilization. Similar mathematical models exist for the case in which waiting is not possible. For example, one can predict the percentage of customers that will be lost due to capacity shortfalls when customers are unwilling or unable to wait.
Better, not more
Our waiting time example illustrates the fundamental tradeoff between the effi ciency of a process as measured by its utilization and its responsiveness as measured by its waiting time. Th e waiting time is reduced as more resources are added. Operations management tools – in particular, queuing theory – can help to fi nd the right positioning along the effi ciency–responsiveness frontier. But operations management can do more than just trade-off one desirable process characteristic against another.
Operations management is also about innovation. By creating an innovative process redesign, the aim is to shift out the frontier instead of simply supporting the optimal position on the current frontier (Figure 2). Th e process becomes better.
[image:3.612.70.547.88.458.2]New frontiers might be reached by overcoming ineffi ciencies in the present process design (often referred to as waste) or by creating the fl exibility to better cope with variability. Industrial pioneers such as Henry Ford reached new frontiers by redefi ning the production of physical goods. As work was increasingly divided, crafts-men were replaced by less skilled workers. Production processes were perfected over the subsequent decades, culminating in the legendary Toyota Production System that is now widely regarded as the gold standard for excellent operations [4,5]. Th e Toyota Production System emphasizes the need to continuously improve a process, driving out the so-called seven sources of waste: excess production, waiting times, transport steps, excessively Figure 2. Interaction of process responsiveness and productivity. Top: the tradeoff between responsiveness and productivity in a given
long activity times, inventory, rework (fi xing quality problems), and unnecessary motions. Work fl ows are opti mized, capacity levels are chosen to match demand, activities are standardized, and protocols are imple men-ted to standardize work, to reduce defects, and improve productivity.
Example 1: focus – the US Airline industry and the emergence of Southwest Airlines
Th e US Airline industry is a tough place in which to compete, and many airlines have experienced fi nancial losses and bankruptcies. An interesting exception is
South west Airlines, which has created a number of
effi ciency-related innovations in the air travel process and in turn has been rewarded with outstanding growth and profi tability. Many of these innovations refl ect the company’s decision to focus on specifi c market segments and operational processes. For example, Southwest
Airlines off ers only economy-class seating, has a
standard ized check-in process, fl ies only one type of aircraft, and minimizes extraneous amenities such as meals and entertainment. Such focus has led to sub stan-tial process improvements by reducing both customer-related and process-customer-related variability. Consequently, Southwest Airlines can achieve high levels of utilization
and improved service times, while being able to
command only marginally lower fares compared with their competitors (Figure 3).
Example 2: quick response – local production and quick replenishment at Zara
Few industries are plagued by variability like the fashion industry, in which consumer tastes are fi ckle and orders are placed far in advance, typically to be produced in far-off places like East Asia. Consequently, retailers often end up with not enough of some products to meet demand (leading to missed sales opportunities) and too much of other products (requiring substantial mark-downs and lost profi ts). Zara’s operational innovation has been one of local production, with approximately 50% of its merchandise sourced from its home country of Spain. At fi rst glance, local production appears ineffi cient as wages in Spain are signifi cantly higher than in East Asia. Th e local production allows for quick and frequent replenishment, however, enabling a tight integration between Zara’s retail operation and their production process. As a result, Zara builds in fl exibility into its operation and is able to react to unanticipated swings in demand.
Example 3: capacity pooling and chaining – Honda’s platform strategy
Variability is the enemy of operations, yet the risks associated with variability decrease as we aggregate many
independent sources of variability. For example, the fi nancial risk of fi re for an individual home owner is large, yet an insurance company with millions of fi re policies faces relatively lower risk. Aggregating variability across independent sources is the idea behind capacity pooling. Consider an automotive company that operates multiple manufacturing plants and produces diff erent models. A given car model can only be produced in exactly one plant. If demand increases relative to the forecast, that plant is unlikely to have suffi cient capacity to fulfi ll it. Conversely, if demand decreases, the plant is likely to have excess capacity. Th e company can mitigate some of the demand–supply mismatch by pooling its capacity. Specifi cally, if every model could be made at every plant, high demand from one model can be served with spare capacity due to low demand from another, leading to better plant utilization and more sales. Such capacity pooling, however, would require the plants to be perfectly fl exible – requiring substantial investments in production tools and worker skills. An interesting alternative to such perfect fl exibility is the concept of partial fl exibility, also referred to as chaining. Th e idea of chaining is that every car can be made in two plants and that the vehicle-to-plant assignment creates a chain that connects as many vehicles and plants as possible. Such partial fl exibility can be shown to result in almost the same benefi ts of full fl exibility, yet at dramatically lower costs [6].
Applying operations management to critical care
[image:4.612.315.546.87.281.2]ICUs are faced with nearly the same throughput an d capacity problems as the companies in our examples. Th e
vast majority of critical care costs are fi xed, resulting in substantial revenue increases with each additional patient [7]. ICUs also frequently operate at or near capacity, with subsequently large waiting times for admission [8]. Simply expanding capacity is not feasible due to space limitations within hospitals, workforce shortages, and government regulations [9]. Neither is expanding capacity necessarily desirable. As the above examples teach us, in the face of variable demand, expanding capacity can ultimately result in higher fi xed costs, excess capacity, and long-term ineffi ciencies.
Th e science of operations management is specifi cally designed to solve these problems. ICU throughput is at heart a complex service problem – patients are just customers arriving at random times and with varying needs. Each takes a diff erent amount of service time. Th e overall goal is to maximize quality while minimizing waste. In the ICU, quality comes in the form of low mortality and waste comes in the form of wait times (that is, admission delays), excess activity times (that is, long lengths of stay), and the need for rework (that is, the eff ort required to care for ICU-acquired complications and ICU readmissions).). Operations management not only can help tradeoff capacity and effi ciency under our current process, but can also help us shift the frontier through continuous process improvement.
Th e fi rst step is to understand the current process. What is the ICU utilization, and how much does it vary? What are the sources of ICU demand, and how much of that demand is random versus predictable? What is the average ICU length of stay (service time) and how does it diff er between diff erent patient types? How much of the current activity is true production versus waste in the form of ICU readmissions or discharge delays?
Th e next step is to apply queuing theory to mathe-matically formulate the current process and determine the point on the utilization curve that will maximize responsiveness and productivity. Increasing capacity might be necessary to achieve optimal throughput, or might only result in excess resources. Sometimes these results can be surprising. For example, an empiric analysis of ICU readmissions in the cardiac ICU at the University of Pennsylvania Hospital found that an aggressive early discharge policy resulted in an increase in overall capacity, even accounting for the increase in readmissions [10].
Th e fi nal step is the search for ways to improve the current processes to increase throughput. Taking a lesson from Toyota, standardizing care through protocols might lead to decreased waste in the form of hospital-acquired infections or excess ventilator-days [11]. Splitting the single surgical ICU into two subspecialty ICUs (one for trauma and one for cardiac surgery) might introduce economies of scope, by which the specialty ICUs can
perform their services more effi ciently. Th is situation would be analogous to Southwest Airlines, which increased effi ciency in part by limiting the scope of their services. To prevent adverse eff ects from boarding and to retain some of the gains from capacity pooling, each ICU could be cross-trained to care for the other’s least sick patients – a form of chaining. Another approach might be to search for ways to minimize the eff ects of variable demand. For instance, if trauma cases tend to occur on the weekends, rescheduling elective cardiac cases from Friday to Monday could create capacity when it is most needed.
Conclusion
Operations management optimizes business processes. From traditional manufacturing to distribution and services, the principles and insights from operations manage ment have been used successfully to help fi rms better manage their businesses. Determining the appro-priate level of capacity is often challenging, particularly when dealing with variability from multiple sources. Operations management provides us with the tools to determine the optimal level of capacity and to manage the tradeoff s inherent in demand–supply mismatches.
Operations management, however, is not just about optimizing a given process or capacity allocation decision – it is also about improving process through innovation. Th e three examples discussed above off er a glimpse into the kinds of process innovations used by highly successful fi rms, but there are many more such innovations being used by fi rms both large and small [12]. Perhaps the greatest role operations management can play in the ICU is in teaching us how to apply these innovations to hospital medicine, thereby improving both the quality and effi ciency of critical care.
Abbreviations ICU, intensive care unit.
Competing interests
CT receives book royalty payments from McGraw-Hill Publishers. DKC and JMK declare that they have no competing interests.
Author details
1Department of Operations and Information Management, The Wharton
School, Leonard Davis Institute of Health Economics, University of
Pennsylvania, Huntsman Hall 573, 3730 Walnut Street, Philadelphia, PA 19104, USA. 2Department of Information Systems and Operations Management,
Goizueta Business School, Emory University, 1300 Clifton Road NE, Atlanta, GA 30030, USA. 3Clinical Research, Investigation and Systems Modeling of Acute
Illness (CRISMA) Center, Department of Critical Care Medicine, University of Pittsburgh School of Medicine, Pittsburgh, PA 15261, USA. 4Department of
Health Policy and Management, University of Pittsburgh Graduate School of Public Health, Scaife Hall Room 602-B, 3500 Terrace Street, Pittsburgh, PA 15261, USA.
Published: 16 August 2011
References
1. Green L: Capacity planning and management in hospitals.Operations Res Health Care 2005, 70:15-41.
2. Chalfi n DB, Trzeciak S, Likourezos A, Baumann BM, Dellinger RP: Impact of delayed transfer of critically ill patients from the emergency department to the intensive care unit.Crit Care Med 2007, 35:1477-1483.
3. Lott JP, Iwashyna TJ, Christie JD, Asch DA, Kramer AA, Kahn JM: Critical illness outcomes in specialty versus general intensive care units.Am J Respir Crit Care Med 2009, 179:676-683.
4. Likert J: The Toyota Way. New York: McGraw-Hill; 2004.
5. Womack JP, Jones DT, Roos D: The Machine that Changed the World. New York: Simon & Schuster; 2007.
6. Jordon WC, Graves SC: Principles on the benefi ts of manufactuing process fl exibility.Manag Sci 1995, 41:577-594.
7. Kahn JM, Rubenfeld GD, Rohrbach J, Fuchs BD: Cost savings attributable to reductions in intensive care unit length of stay for mechanically ventilated patients.Med Care 2008, 46:1226-1233.
8. Green LV: How many hospital beds?Inquiry 2002, 39:400-412.
9. Bazzoli GJ, Brewster LR, May JH, Kuo S: The transition from excess capacity to strained capacity in U.S. hospitals.Milbank Q 2006, 84:273-304. 10. KC D, Terwiesch C: An econometric analysis of patient fl ows in the cardiac
ICU. Working paper. University of Pennsylvania Wharton School of Buisiness; 2007.
11. Girard TD, Ely EW: Protocol-driven ventilator weaning: reviewing the evidence.Clin Chest Med 2008, 29:241-252, v.
12. Cachon GP, Terwiesch C: Matching Supply with Demand: An Introduction to Operations Management. New York: McGraw-Hill; 2006.
doi:10.1186/cc10217