International Journal of Emerging Technology and Advanced Engineering
Website: www.ijetae.com (ISSN 2250-2459,ISO 9001:2008 Certified Journal, Volume 3, Issue 12, December 2013)
291
Analysis of Tubular Structures in 3-D CT Images Using
Parallelizable Segmentation
Shu-Yen Wan
Department of Information Management, Chang Gung University, Taoyuan, Taiwan
Abstract— Tubular structures, such as vasculatures, pulmonary airways, nervous systems and bile ducts, are common in medical images. The anatomical studies and the corresponding disease diagnosis require well-coordinated efforts of image segmentation, topological descriptions, and geometrical quantization. Accurate measurements of the structural information can be conducive to performing any synergistic surgical planning, percutaneous access, or catheter-based interventions. Many automatic algorithms and procedures exist for extraction, analysis, and visualization for tubular structures in three-dimensional (3-D) images. Little work has been on effective cross-sectional analysis, which is essential for valid medical and clinical examinations of those structures. In this paper, we propose an approach that employs a unidirectional and parallelizable region growing method that is efficient and robust to create cross sections (CS) perpendicular to the centrelines of the tubular structures. The method is independent of how the centrelines are generated, either by skeletonization or by the other medial-line tracking schemes. We addressed computationally separable, unidirectional, and parallelizable properties of the proposed approach. The experimental results of 3-D CT images show the proposed approach is less computation-intensive and requests less processing memory than that of traditional methods, and is especially useful for large-scale and complex tubular structures.
Keywords—Cross Sectional Analysis, Skeletonization, Tubular Structures, Parallelizability, Segmentation
I. INTRODUCTION
Radiological imaging techniques, such as computed tomography (CT), magnetic resonance imaging (MRI), and positron emission tomography (PET), can offer non-invasive diagnostic means for exploring the anatomy and are often used to explore an organ's in situ basic functional units (BFU) [1]-[2]. Tubular structures, such as cardio-vasculature, pulmonary arteries, airways, nervous systems, bile ducts, etc., exist in many human and animals’ organs
[3]-[6]. Computer-aided anatomical analysis and
pathological diagnoses on such structures have shown their significance in medical studies and clinical practices and have drawn great attention [6]-[14].
Performing these studies requires well-coordinated efforts on image segmentation (to extract the tubular structures from the image), topological description (to efficiently represent the structural information), and geometrical quantization. Accurate quantitative measures of structural information, such as branching patterns, consequences of a particular branching pattern, and cross-sectional analysis, ensure valid examinations and help the
physician better understand the involved
pathophysiological mechanisms. Little work, however, has been proposed on effective cross-section creation/analysis, which plays the pivotal role in deriving the other quantities.
Various centreline–extraction and skeletonization
methods exist to identify and approximate the tubular structures with discrete segments or continuous splines with respect to which endoluminal analyses can then be performed [6]-[11],[13],[15]-[16]. These methods either lacked capability of cross-sectional analysis or employed threshold-based shooting rays to define cross sections along the medial lines of the tubular structures; the intricacies and possible intensity variation in a region for image segmentation were understated. Recent efforts proposed an approach for extracting the tubular structures automatically and performed the subsequent quantitative and numerical analyses [12][14]. The calculation of the cross-sectional areas (CSA) was, however, not theoretically justified and was not effective.
In this paper, we propose a parallelizable region-based approach to achieve cross-sectional analysis. It extends a previously proposed concept – symmetric region grow (SymRG) [17] to consolidate the robustness of the analysis, and presents unidirectional and parallelizable growing process to reduce memory usage and at the same time boosts the performance. It is essentially independent of how the medial lines of the tubular structures are generated, but can collaborate with the image segmentation process to produce more consistent analytical results if a symmetric region growing algorithm was applied for image
segmentation. Various implementations of the SymRG
International Journal of Emerging Technology and Advanced Engineering
Website: www.ijetae.com (ISSN 2250-2459,ISO 9001:2008 Certified Journal, Volume 3, Issue 12, December 2013)
292 In the section that follows – Section II, we give an
overview of SymRG and develop its separable,
unidirectional, and parallelizable properties. In Section III we model the cross-sectional analysis problem by applying the properties addressed in Section II. Section IV presents the results of the whole analysis protocol for 3-D medical images that contains tubular structures. We also offer discussions to conclude this section.
(a)
[image:2.612.66.266.236.378.2](b)
Figure 1. Schematic region-growing procedures. (a) A general region-growing algorithm; (b) A SymRG algorithm. I denotes the input image,
specifies the seed criteria, specifies the inclusion and exclusion region-growing criteria, and ) ) is the final segmented image. A general region-growing method first excludes the undesired points and starts the region-growing process from the selected seeds. The iterative or recursive application of the inclusion criteria stops when all points have been visited. On the other hand, the SymRG method first applies the exclusion criteria, while defers the application of the seed criteria. The remaining region-growing process proceeds sequentially until the last point of the image is visited. It is now the seed criteria are used to filter out the uncharacterized regions.
II. PROPERTIES OF PARALLELIZABLE SEGMENTATION
The purpose of image segmentation is to partition an
image I into N disjoint regions ), which
are homogeneous in terms of certain criteria [21]. Of the many proposed image-segmentation methods, region growing has been one of the most popular [22]-[23]. The region-growing process starts with an initial set of points or
seeds, { }, and proceeds by applying the
region-growing algorithm – ), to finally form N
disjoint regions, , where .
Here denotes a predicate set of region-growing criteria.
Each seed corresponds to the region , and is
regarded as the background – a collection of points that do
not satisfy ). A schematic definition of image
segmentation is given as below:
) ) ⋃ (1)
The drawbacks of the traditional region-growing
algorithms are: (i) the growing behaviour is either recursive
or iterative, and therefore, a point is usually visited more
than once; (ii) the growing direction can be from the
current visited point to any of its 3N-1 neighbours in an N
-dimensional space, and is thus unpredictable. The
introduction of SymRG, by assuring that the
region-growing criteria are symmetric; i.e., as a set of Boolean
predicates is symmetric, is to enforce a unidirectional (sequentially from the first point to the last of the image)
region-growing implementation while produce the
equivalent segmentation results as produced by the traditional approach. Ref. [17] shows that the overall number of point-visits is about two thirds of that for the traditional methods. Furthermore, the unidirectional region grow allows more efficient memory usage in that the well-visited points are almost no longer needed and can be stored back in the persistent media without having to suffer significant I/O swaps. The unidirectional condition is guaranteed by the following properties.
Property 1: Consider a symmetric region growing
algorithm, ) such that ) )
⋃ . The replacement of certain seed for a resulting
region by another point in the same region gives the equivalent segmentation result. □
Property 2: Given ) and seed sets , both sets containing corresponding pairs of seeds in the same regions. There is at least one one-to-one region-growing path between every corresponding pair of
elements in A and B if and only if ) )
) ). □
[image:2.612.348.551.519.585.2]International Journal of Emerging Technology and Advanced Engineering
Website: www.ijetae.com (ISSN 2250-2459,ISO 9001:2008 Certified Journal, Volume 3, Issue 12, December 2013)
293
Property 3: Consider ) ), a complete segmentation algorithm based on symmetric region
growing. denotes the seed criteria, which can eventually
derive the seed set. Scan the digital image of interest, I, sequentially. Grow regions from each scanned point by
applying inclusion, and exclusion, criteria ,
until all image points have been visited. Examine the
resulting regions using . If any point p of a region satisfies
criteria for region , then assign the region to ;
otherwise, relegate it to the background . The resulting
segmented image is ) ). The schematic
symmetric region-growing vs. traditional region-growing procedures are shown in Figure 1. □
With the implicitly reflexive and transitive
characteristics of the region-growing process, SymRG adds
the symmetric component so as to form the segmented regions that are actually equivalent classes [24]. Property 1 can also be called intra-region substitution property. It alleviates the importance of the pre-specified seeds such
that the region-growing process of SymRG for a region can
be from any other points in the same region or equivalent class. Property 2 can be referred to as region-equivalent property. It further generalizes Property 1 to be applicable for all regions or equivalent classes. Property 3 is used to
transform the previous properties into practical
implementation. The region-growing process of SymRG
can now start from the very first point and proceed sequentially to produce the equivalent result that is generated by traditional seed-emphasized recursive or iterative region-growing methods.
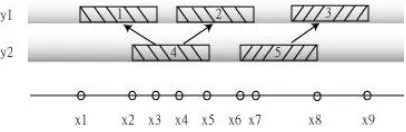
Property 4: The region-growing process of a SymRG can be computationally separable. □
Consider the 2-D SymRG example as shown in Figure 2.
The implementation can be extended to any higher
dimensions. The 2-D SymRG sequentially forms 1-D
regions and then merges the overlapping regions that are on consecutive rows and satisfy the inclusion criteria into a 2-D region. Because the region-growing process is symmetric,
the 2-D SymRG computation is xy-separable. Besides, the
merging process needs only to look for merge-able regions on the immediately upper row. It cuts the number of neighbouring-point visits in the y-direction into half. The whole region-growing process is also parallelizable in that independent processing units can process all rows of the image concurrently; the resultant 1-D regions are then merged in a pair-wise and hierarchical fashion as shown in Figure 3, and thus conducive to parallelism.
III. CROSS-SECTIONAL ANALYSIS
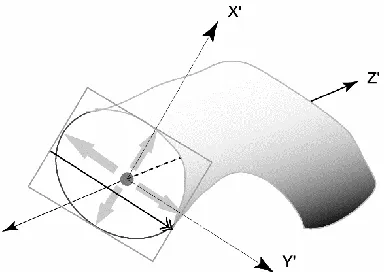
To perform endoluminal analysis, calculate the cross-section areas, average branch volume, etc., we create contiguous cross sections perpendicular to the centrelines of the tubular structures. As shown in Figure 4, we create a cross section on a re-sampled oblique plane perpendicular to the tangent of the centrelines. The global coordinate
system (X,Y,Z) is first aligned with the local coordinate
system (X’,Y’,Z’) with respect to a selected site of interest
along the centreline. The Z’ axis coincides with the
centreline tangent of the site. Consider that in order to perform coordinate transformation, we assume the current
site is at ) with respect to the original coordinate
system where the very first point of the image is considered as the origin. Also, letting the tangent vector of the
centerline of the tubular structure at ) is
), we assume the original coordinate system has to
pan (around the Z axis) degrees and tilt (around the X
axis) degrees to align with (X’,Y’,Z’). The homogeneous
affine matrix is thus:
[image:3.612.342.560.377.572.2](2)
Figure 3. An example of hierarchical region merging for SymRG. Each of the eight rows has a grown region. The rows and
are examined to search mergeable regions, where i = 0, 1, 2, 3. Four bigger regions result, and are in turn merged into two further bigger regions. The final result is a large region that is actually the union of the eight original regions. On the right of the figure, the tree structure shows how the merging proceeds. The merging on the same level in the tree can be processed concurrently.
We perform SymRG traversal to identify the cross
section on the X’-Y’ oblique plane, which can be
represented by the linear equation:
International Journal of Emerging Technology and Advanced Engineering
Website: www.ijetae.com (ISSN 2250-2459,ISO 9001:2008 Certified Journal, Volume 3, Issue 12, December 2013)
294 The SymRG algorithm can achieve region growing by scanning the image, from the very first voxel, row by row in a top-down and unidirectional fashion as shown by Properties 1-3. It is then important to determine a 2-D oblique sub-image that encloses the corresponding cross section for efficient computation. To find the boundary of the sub-image, we employ a shooting ray on the segmented image to identify the first reached boundary voxel of the cross section; we then track the voxels until the boundary is
closed. The unidirectional (SymRG) region-growing
process now starts row-by-row in the X’-direction, and then along the Y’-direction, shown as the double-headed arrow
in Figure 4. The SymRG implementation to identify the
cross sections can be on the segmented or the original image, depending on the quality of the previously imposed
image segmentation process. The structural and
geometrical information of the branches, such as cross-sectional areas, their shape descriptors, circumferences, cumulative CSA or volumes, and branching volume loss, is thereafter readily available. Discussion of these regards will be given in next section.
Figure 4. SymRG-based cross-section creation. The (X’,Y’,Z’) represents the local coordinate system for each site along the centreline of the tubular structures such that the Z’ axis points to the tangent of the site of interest. The grey arrows represent the search of the boundary of the sub-image. The double-headed arrow denotes the later SymRG growing and merging process to identify the cross section.
IV. RESULTS AND DISCUSSION
Figure 5 shows some of the test images. The detail of the specimen preparation and experimental protocol can be found in Ref. [2].
A. Pre-processing
An updated pre-processing procedure of Ref. [12] and [14] is applied in advance. A morphological closing
operation with 333 kernel is applied on the raw 3-D CT
images to obtain smoother outline of the tubular structures and fill small 3-D cavities.
We then employ the SymRG implementation to extract
the regions of interest (ROI). The parameters used are the
hard maximum ( ) and minimum ( ) gray levels of
the ROI, the soft maximum ( ) and minimum ( )
gray levels, the largest permissible between-neighbor intensity variation (LPIV) that is automatically obtained by the dominant intensity variation of the image and normalized by the grey-scale of the image, minimal region size, and the optional parameter of the desired number of the big enough regions. The soft maximum and minimum
grey levels server as the seed criteria for the SymRG; the
hard maximum and minimum grey levels dictate the exclusion criteria, where the hard and soft parameters
always conform to the relation:
; the LPIV is used for the inclusion criteria; the
remaining parameters are for the post-segmentation process to remove unwanted regions. In most cases, 3-D cavity deletion serves as one of the post-segmentation process to assure ―solid‖ tube extraction. An efficient and robust 3-D thinning algorithm is then applied to define the homotopy-preserving skeleton of the tubes – in our case, bile ducts and vascular networks [10]. We then track and represent the skeleton in a graph data structure. An optional step might be needed to automatically or interactively identify the root of the structure. The average total eclipsed time, excluding image loading and writing, for the four images shown in Figure 5 is about 81 seconds (closing operation:
23 sec; SymRG segmentation: 3 sec; 3-D cavity deletion: 19
sec; 3-D thinning: 34 sec; skeleton representation and root identification: 2 sec). At this stage, the results we have are the original image, segmented image, thinned image, and the skeleton representation.
[image:4.612.78.270.388.524.2]B. Cross-sectional analysis
Figure 6 illustrates the quantitative and visual results and data management of the cross-sectional analysis. Most measurements are similar to those proposed in Ref. [12]; only the algorithm to create the cross sections is significantly different and more robust and efficient. We do not test the images in a distributed environment or under parallel architecture; however, with the characteristics of
parallelism of SymRG, performance boost can be expected
if the highly collaborated processing units are available. As
the approach described in Section II, we perform SymRG
International Journal of Emerging Technology and Advanced Engineering
Website: www.ijetae.com (ISSN 2250-2459,ISO 9001:2008 Certified Journal, Volume 3, Issue 12, December 2013)
295 The overall cross-sectional analysis for the whole structure takes average of about 15 seconds.
C.Discussion
Endoluminal analysis of the tubular structures can provide quantitative and visual insights to help investigate considerable physiological questions. The work in this paper furthers the research of Ref. [12] and [14] to propose a novel approach that improves computational performance and robustness in regard of cross-section creation, calculations of various quantities, and branching geometry
analysis. The SymRG paradigm was usually employed to
perform image segmentation. In this paper, we adapt its
implementation so that SymRG can also be used to
effectively assist in cross-section creation. Its unidirectional
region-growing, separability, and parallelizability
properties are essential for much strength we addressed in this paper.
We exploit the same SymRG approach for image
segmentation and cross-sectional analysis. The synergistic efforts assure robustness and consistency of the results. Much recent work, as shown in Ref. [5], [6], [8], [9], and [15], employed alternate approaches to define the centrelines (or medial lines) of the tubular structures. The image segmentation process was basically skipped or overlooked. Instead, they extracted the centrelines directly from the grey-scaled original image with pre-specified initial points to start the tracking process. From the results
shown in Sections A and B, the SymRG-based image
segmentation is not computation-intensive, taking less than 5 seconds to extract the whole vasculature tree in general. The segmented results can also be used to track the centrelines by the other alternate approaches for more robust and efficient computation.
Furthermore, with the help of data management tools and the visual plots, the work presented in this paper as shown in Figure 6 can enrich the clinical experience for the physician to offer more responsive diagnoses.
REFERENCES
[1] Flannery, B.P., Deckman, H.W., Roberge, W.G., and D’Amico, K.L. 1987. Three-dimensional x-ray microtomography, Science. 237. pp. 1439-1444.
[2] Jorgensen, S.M., Demirkaya , O., and Ritman E.L. 1998. Three Dimensional Imaging of Vasculature and Parenchyma in Intact Rodent Organs with X-ray Micro-CT, American Journal of Physiology (Heart, Circ. Physiol. 44). 275. pp. H1103-H1114. [3] Broeders , I., Blankensteijn, J., Olree, M., Mali, W., and Eikelboom,
B. 1997. Preoperative sizing of grafts for transfemoral endovascular aneurysm management: A prospective comparative study of spiral CT angiography, arteriography, and conventional CT imaging. Journal of Endovascular Surgery. 4. pp. 252-261.
[4] Greenspan, H., Laifenfeld, M., Einav, S., and Barnea, O. 2001. Evaluation of center-line extraction algorithms in quantitative coronary angiography. IEEE Transactions on Medical Imaging. 20(9), pp. 928-941.
[5] Lorensen, W.E., Holesz, F.A., Kikinis, R. 1995. The Exploration of Cross-Sectional Data with a Virtual Endoscope, Interactive Technology and the New Health Paradigm, IOS Press, pp. 221-230. [6] Wink, O., Niessen, W.J., and Viergever, M.A. 2000. Fast delineation
and visualization of vessels in 3-D angiographic images, IEEE Transactions on Medical Imaging, 19(4), pp. 337-346.
[7] Robb, R.A., and Barillot, C. 1989. Interactive Display and Analysis of 3-D Medical Images, IEEE Transactions on Medical Imaging, 8(3), pp. 217-226.
[8] Chen, Dongqing, Liang, Zhengrong, Wax, Mark R., Li, Lihong, Li, and Kaufman, Arie E. 2000. A novel approach to extract colon lumen from images for virtual colonoscopy, IEEE Transactions on Medical Imaging, 19(12), pp. 1220-1226.
[9] Man, Bruno De, Nuyts, Johan, Dupont, Patrick, Marchal, Guy, and Suetens, Paul. 2001. An Interactive Maximum-Likelihood Polychromatic Algorithm for CT. IEEE Transactions on Medical Imaging, 20(10). pp. 999-1008.
[10] Ma, Cherng-Min and Wan, Shu-Yen. 2000. Parallel Thinning Algorithm on 3-D (18,6) Binary Images. Computer Vision and Image Understanding. 80(3). pp. 364-378.
[11] Saha, P.K., Chaudhuri, B.B., and Majumder, D.D. 1997. A New Shape Preserving Parallel Thinning Algorithm for 3-D Digital Images. Pattern Recognition. 30(12). pp. 1939-1955.
[12] Wan, Shu-Yen, Ritman, Erik L., and Higgins, William E. 2002. Multi-generational analysis and visualization of the vascular tree in 3-D micro-CT images. Computers in Biology and Medicine. 32(2). pp. 55-71.
[13] Mori, K., Hasegawa, J.-I., Suenaga, Y., Toriwaki, J.-I. 2000. Automated anatomical labeling of the bronchial branch and its application to the virtual bronchoscopy system. IEEE Transactions on Medical Imaging, 19(2). pp. 104-114.
[14] Wan, Shu-Yen, Kiraly, Atilla P., Ritman, Erik L. and Higgins, William E. 2000. Extraction of the hepatic vasculature in rats using 3-D micro-CT images. IEEE Transactions on Medical Imaging. 12(9). pp. 964-971.
[15] Swift, R.D., Kiraly, A.P., Sherbondy, A.J., Austin, A.L. Hoffman, E.A., McLennan, G., Higgins, W.E. 2002. Automatic Axis Generation for Virtual Bronchoscopic Assessment of Major Airway Obstructions. Computerized Medical Imaging and Graphics. 26(2). pp. 103-118.
[16] Saito, T., and Toriwaki, J.-I. 1994. New algorithms for n-dimensional Euclidean distance transformation. Pattern Recognition. 27(11). pp. 1551-1565.
[17] Wan, S.-Y. and Higgins, W.E. 2003. Symmetric region growing, IEEE Transactions on Image Processing, vol. 12, no. 9, pp. 1007-1015.
[18] Chiang, W.-C., Lin, H.-H., Huang, C.-S., Lo, L.-J., and Wan, S.-Y. 2014. The cluster assessment of facial attractiveness using fuzzy neural network classifier based on 3D Moiré features. Pattern Recognition. 47(3). pp. 1249-1260.
International Journal of Emerging Technology and Advanced Engineering
Website: www.ijetae.com (ISSN 2250-2459,ISO 9001:2008 Certified Journal, Volume 3, Issue 12, December 2013)
296 [20] Lin, H. H., Chiang, W. C., Lo, L. J., Hsu, Sheng-Pin, Wang, C. H.,
and Wan, S. Y. 2013. Artifact-resistant superimposition of digital dental models and cone-beam computed tomography images. J Oral Maxillofac Surg. 71(11). pp. 1933-47.
[21] Haralick, Robert M., and Shapiro, Linda G. 1985. Survey: Image segmentation techniques. Computer Vision, Graphics and Image Processing. 29, pp. 100-132.
[22] Adams, Rolf, and Bischof, Leanne. 1994. Seeded region growing. IEEE Transactions on Pattern Analysis and Machine Intelligence. 16(6). pp. 641-647.
[23] Hojjatoleslami, S.A., and Kittler, J. 1998. Region growing: A new approach. IEEE Transactions on Image Processing. 7(7). pp. 1079-1084.
[24] Liu, C. L. 1985. Elements of Discrete Mathematics, 2nd Ed. New York. McGraw-Hill, International Edition.
[image:6.612.85.529.406.672.2](a) (b) (c) (d)
Figure 5. Example 3-D CT images. (a) is a EBCT human liver image; (b) is the hepatic bile duct CT image of a rat; (c) is the left circumflex arteries micro CT image; (d) is the micro CT images of a rat’s right circumflex arteries. The figures
reflect the maximum intensity projections of the coronal plane of the original 3-D images. The sizes of the images are 24.4MB, 40.1MB, 50MB, and 50MB, respectively.
(a)
(b) (c)
(d) (e) (f)
Figure 6. Results of the cross-sectional analysis. The quantitative data of the analysis is stored in databases, which are referred to via ODBC and JDBC. With further computations, data normalization, and the MS ExcelTM-encapsulated rendering functionality,
the analysis data can be visualized in various forms. (a) depicts the mentioned mechanism. (b) and (c) shows MS ACESSTM-look