http://dx.doi.org/10.4236/ojmi.2013.34020
An Adaptive Fuzzy C-Means Algorithm for
Improving MRI Segmentation
Elnomery Allam Zanaty
Mathematics Department, Faculty of Science, Sohag University, Sohag, Egypt Email: [email protected]
Received September 20, 2013; revised October 20, 2013; accepted October 27,2013
Copyright © 2013 Elnomery Allam Zanaty. This is an open access article distributed under the Creative Commons Attribution Li-cense, which permits unrestricted use, distribution, and reproduction in any medium, provided the original work is properly cited.
ABSTRACT
In this paper, we propose new fuzzy c-means method for improving the magnetic resonance imaging (MRI) segmenta- tion. The proposed method called “possiblistic fuzzy c-means (PFCM)” which hybrids the fuzzy c-means (FCM) and possiblistic c-means (PCM) functions. It is realized by modifying the objective function of the conventional PCM algo- rithm with Gaussian exponent weights to produce memberships and possibilities simultaneously, along with the usual point prototypes or cluster centers for each cluster. The membership values can be interpreted as degrees of possibility of the points belonging to the classes, i.e., the compatibilities of the points with the class prototypes. For that, the pro- posed algorithm is capable to avoid various problems of existing fuzzy clustering methods that solve the defect of noise sensitivity and overcomes the coincident clusters problem of PCM. The efficiency of the proposed algorithm is demon- strated by extensive segmentation experiments by applying them to the challenging applications: gray matter/white matter segmentation in magnetic resonance image (MRI) datasets and by comparison with other state of the art algo- rithms. The experimental results show that the proposed method produces accurate and stable results.
Keywords: Fuzzy Clustering; Possiblistic C-Means; Medical Image Segmentation
1. Introduction
Clustering is one of the most popular classification me- thods and has found many applications in pattern classi- fication and image segmentation [1-6]. With increasing use of magnetic resonance imaging (MRI) for diagnosis, treatment planning and clinical studies, it has become almost necessary for radiological experts to make clinical diagnosis and treatment planning by using computers. Me- dical images tend to suffer much more noise than realis- tic images due to the nature of the acquisition devices. This of course poses great challenges to any image seg- mentation technique. In order to reduce noise, many de- vises increase the partial voluming, that is, they average acquisition on a thick slice. This leads to blurring the edges between the objects, which make decisions very hard for automatic tools [1]. The different acquisition mo- dalities, the different image manipulations and variability of organs all contribute to a large verity of medical im- ages. It can be safely said that there is no single image segmentation method that suits all possible images. This can pose great problems for any segmentation method. Therefore, several types of image segmentation techni-
putational time, complexity and introducing unwanted smoothing [14,15]. Liew et al. [16] proposed a spatial FCM clustering algorithm for clustering and segmenting the images by using both the feature space and spatial information. Another variant of FCM algorithm called the robust fuzzy c-means (RFCM) algorithm was pro- posed in [17].
Pham and Prince [18] modified the FCM objective function by introducing a spatial penalty for enabling the iterative algorithm to estimate spatially smooth member- ship functions. Ahmed et al. [8] introduced a neighbor- hood averaging additive term into the objective function of FCM. They named the algorithm bias corrected FCM (BCFCM). Liew and Yan [19] introduced a spatial con- straint to a fuzzy cluster method where the inhomogene- ity field was modeled by a B-spline surface. The spatial voxel connectivity was implemented by a dissimilarity index, which enforced the connectivity constraint only in the homogeneous areas. This way preserves significantly the tissue boundaries. Zanaty and Aljahdali [11] intro- duced a new local similarity measure by combining spa- tial and gray level distances. They used their method as an alternative pre-filtering to an enhanced fuzzy c-means algorithm (EnFCM) [20]. Kang et al. [21] proposed a spatial homogeneity-based FCM (SHFCM). Wang et al.
[22] incorporated both the local spatial context and the non-local information into the standard FCM cluster al- gorithm. They used a novel dissimilarity measure in place of the usual distance metric. In those methods, ef- fect of noise can be overcome by incorporating possibil- ity (typicality) function in addition to membership func- tion. For that, the possibilistic c-means algorithm (PCM) was developed in [23]. This technique combines FCM and logic with some modification in its membership function for removal of noise from the MRI brain images. It has been shown to be more robust to outliers than FCM. However, the robustness of PFCM comes at the expense of the stability of the algorithm [24]. The PCM-based algorithms suffer from the coincident cluster problem that makes them too sensitive to initialization [24]. Many efforts have been presented to improve the stability of possibilistic clustering [25-27].
Although the previous MRIs segmentation algorithms had suppressed the impact of noise and intensity inho- mogeneity to some extents, these algorithms still produce misclassified small regions. The problems of over-seg- mentation and sensitivity to noise are still the challenge. FCM and PCM are also very sensitive to initialization and sometimes coincident clusters will occur. Moreover, coincident clusters may occur during fuzziness processes which can affect the final segmentation.
In this paper, we propose a new method called PFCM which combines the characteristics of both FCM and PCM algorithms by new weights for accurate MRIs
segmentation. The proposed method avoids various prob- lems of existing fuzzy clustering methods, solves the noise sensitivity defect of FCM and overcomes the coin- cident clusters problem of PCM. In order to reduce the noise effect during segmentation, the proposed algorithm combines the objective functions of conventional FCM algorithm and PCM algorithm. To overcome the problem of coincident clusters of PCM and also for combination of the objective FCM and PCM, a new weight function is proposed that is based on Gaussian membership. In this method the effect of noise is overcome by incorporating possibility (typicality) function in addition to member- ship function. Consideration of these constraints can greatly control the noise in the image as shown in our experiments. The efficiency of the proposed algorithm is demonstrated by extensive segmentation experiments using real MRIs and comprising with other state of the art algorithms.
The rest of this paper is organized as follows: The theoretical foundation of fuzzy c-means and possibilistic c-means is described in Section 2. In Section 3, the pro-posed PFCM algorithm is presented. Experimental and comparisons results are given in Section 4. Finally, Sec-tion 5 gives our conclusions.
2. FCM and PCM Algorithms
The FCM algorithm [10] is an iterative clustering method that produces optimal C partitions by minimizing the weighted within the group sum of squared error objective function JFCM:
2
1 1
, , C n m , ,1
FCM ij j i
i j
J V U X u d x v m
(1)where
1, , ,2
p nX x x x R
2 C n 1
is the data set in the
p-dimensional vector space, n is the number of points, p
is the number of data items, C is the number of clusters with . V
v v1, ,2 ,vC
is the C centers or prototypes of the clusters, viis the p-dimension center of the cluster i, and 2
,
j i
d x v is a square distance measure between object x j and cluster center
, i
v U uij represents a fuzzy partition matrix with
ij i j
u u x is the degree of membership of xj in the
ithcluster; j
x is the jth of p-dimensional measured data.
The fuzzy partition matrix satisfies:
1
0 n ij , 1, j
u n i C
,
nfuzzy membership and determines the amount of fuzzi- (2)
1
1, 1, ,
c ij i
u j
ness of the resulting classification; it is a fixed number greater than one. The objective function JFCM can be minimized under the constraint of U.
The objective function JFCM is minimized with re-spect to uij and vi, respectively:
1 2l m1
2
2 1
,
,1 , .
,
C
j i ij
k j k
d x v
u i C i j
d x v
n (4)1 1 ,1 . n m ik k k i n m ik k u x v i u
C (5)Although FCM and the modified FCM [18,20,22] are us
(6) where
eful clustering methods, their memberships do not al-ways correspond well to the degree of belonging of the data, and may be inaccurate in a noisy environment, be-cause the real data unavoidably involves noise. To alle-viate weakness of FCM, and to produce memberships that have a good explanation for the degree of belonging of the data. Wang et al. [22] relaxed the constrained con-dition (3) of the fuzzy C-partition to obtain a possibilistic type of membership function and propose PCM for un-supervised clustering. The component generated by the PCM corresponds to a dense region in the data set; each cluster is independent of the other clusters in the PCM strategy. The objective function of the PCM can be for-mulated as follows:
2
1 1 1 1
, , C n m , C n 1 m
PCM ij j i i ij
i j i j
J V U X u d x v u
2 1 1 , n mij j i j
i n
m ij j
u d x v
u
(7)is the scale parameter at the ith cluster, and
12 1 1 , 1 ij m j i i u
d x v
(8)
is the possibilistic typicality value of training sample xj belonging to the cluster i m,
1, is a weighting fac-tor called the possibilisticZanaty and Sultan [11] proposed a parameter.
method for auto-matic fuzzy algorithms by considering some spatial con-straints on the objective function. The algorithm starts of subdivide the data a set of N vector
j, 1, ,
X x j N into clusters uM sing well-known
fuzzy method [10] (see Equations (1)-(4)). Assume, the data is divided into M cluster, R R1, 2, , RM with cen-tres v v1, , ,2 vM respectively. T algorithm proce o neighbours clusters individually, i.e. if we have three clusters , ,
he proposed sses every tw
A B C with centres cA, cB, and cc. We start to hold idity function b w clust
our val et een
ers A and B if:
A B A c
v v v v
Our validity function is proposed to use the intra- cluster distance measure, which is simply the distance between a centre of cluster A and cluster centre B multiplied by the objective function of fuzzy. We can define the validity function as:
21 n m
1
1
2
2 max min 1 1
A B i iA iB
i
n m
ik iA B i k
V v v u d d
n
V A B u d
(9)where max
B and min
Blusters
are the maximum and minimum values of c A and B respectively. While dA B is the distances of e data th xi (of number n) of A union B i.e. A B . This al rithm works iteratively the num increases automatically according to the decision of validity function in Equations (9) and (10), more discussion can be shown in [11].
Typical of other cluster approaches, the PCM also go
ber of clusters
de-pends on initialization. In PCM technique [25], the clus-ters do not have a lot of mobility, since each data point is classified as only one cluster at a time rather than all the clusters simultaneously. Therefore, a suitable initializa-tion is required for the algorithms to converge to nearly global minimum.
2
1 1
, , c n m ,
FPCM ij ij j i
i j
J U T V u t d x v
(10)with the following constraints:
C
A solution of the objective function can be obtained vi
1
1, 1, ,
ij i
u n
C
1
1, 1, ,
n ij j t i
a an iterative process where the degrees of membership, typicality and the cluster centers are updated as follows:
1
2 1
2 m
2 1 , ,1 ,1 , C j i ij
k j k
d x v
u i C j n
d x v
(11)
1
2 1 2 2 1 , ,1 ,1 , n j i ij
k j k
d x v
t i
d x x
C j n
1 1 ,1 n m ik ik k ki n m ik ik k
u t x
v i u t
CPal etal. [26] improved this method by adding a new penalty to the objective function in order
noise affects. The objective unction can be written as: (13)
to control the
2 1 1 , , , 1 m 1 1 c nFPCM ij ij j i
i j c n
i ij i j
J U T V u t d x v
t
(14)
11, 1, ,
C ij i u j
nC
with the following constraints:
1
1, 1, , n ij j t i
1
2 1 2 2 1 , ,1 ,1 , m C j i ij
k j k
d x v
u i C j n
d x v
(15)
2
1 11 1 ij
ij i
t
d
(16)
1 1 ,1 n m ik ik k ki n m ik ik k
u t x
v i C (17)
u t
2 1 1 , 1 n m ij ij j i n m ij jZ u d
Z u
Rajendran and Dhanasekaran [24] define a clustering algorithm that combines the characteristics of both fuzzy and possibilistic c-means. Memberships and typicalities are important for the correct feature of data substructure in clustering problems. Thus, an objective function in this method that depends on both memberships and typi-calities can be shown as:
with the following constraints:
1 1 1 c n i ij i j t
2 1 1 , , , FPCM c n mij ij j i i j
J U T V
au bt d x v
(18)
1
1, 1, , and , 0
C ij i
u j n a b
1
1, 1, ,
n ij j t i
CA solution of the objective function can be obtained e degrees of membership, typicality and the cluster centers are updated as follows: via an iterative process where th
1
2 1 2 2 1 , ,1 ,1 , m C j i ij
k j k
d x v
u i
d x v
C j n
(19)
2
1 11 1
ij
ij i t
bd
(20)
1 1 ,1 n mik ik k k
i n m ik ik k
au bt x
v i au bt C
The above equation
influenced by all C cluster centers, ij influenced just by the ith cluster center c
i. The possibilis-tic term distributes the tij with respect to every n data points, but not by means of every C clusters. T membership can be described as relative
determines the degree to which a data fit in to cluster in accordance with other clusters and is helpful in correctly la
the data ized and the
mized [26]. (21)
s indicate that membership uij is while possibility t is
hus, typicality, it
beling a data point. Possibility can be observed as ab-solute typicality, it determines the degree to which a data point belongs to a cluster correctly, it can decrease the consequence of noise. Joining both membership and pos-sibility can yield to good clustering result [28].
3. The Proposed PFCM Algorithm
The choice of an appropriate objective function is a key to the success of cluster analysis and to obtain better quality clustering results; hence, clustering optimization is based on the objective function [28]. To identify a suit- able objective function, one may start from the following set of requissrements: the distance between
points assigned to a cluster should be minim distance between clusters should to be maxi
To obtain an appropriate objective function, we take into consideration the following:
● The distance between clusters and the data points allocated to them must be reduced.
● Coincident clusters may occur and must to be con-trolled.
The desirability between data and clusters is modeled by the objective function. Hung et al. [29] provides a
prototype-driven
n exponential separation strength between
used for this parameter by ev
modified PCM technique which considerably improves the function of FCM because of a
learning of parameter. The learning procedure of is de- pendent on a
clusters and is updated at every iteration. As for the common value
ery data for iterations, we propose a new weight func-tion wij which is based on Gaussian membership of a point p. achieving every point of the data set has a weight in relation to every cluster. The usage of weights pro-duces good classification particularly in the case of noisy data. The weight is calculated as follows:
2 2 2 1 e 2 j i i p ij i w
(22)
where 1 n j j i x n
,
1 2 n j i j i p n
and wij is the weight of the point j in relation to class i. This weight is used to modify the fuzzy and typical partition. To clas-sify a data point, the cluster centroid hthe data point, it is membership; and for estimating the centroids, the typicality is used for alleviating the unde-sirable effect of outliers. The objective function is
com-f two expressions: the com-first is t
and it uses a fuzziness weighting exponent, the second is as to be closest to
posed o he fuzzy function
possibililstic function and it uses a typical weighting ex-ponent; but the two coefficients in the objective function are only used as exhibitor of membership and typicality. A new relation, lightly different, enabling a more rapid decrease in the function and increase in the membership and the typicality when they tend toward 1 and decrease this degree when they tend toward 0. This relation is to add weighting Gaussian exponent as exhibitor of distance in the two under objective functions.
To solve the noise sensitivity defect of FCM which has an influence on the estimation of centroids, and to over-come the coincident clusters problem of PCM, the hy-bridization of possibilistic c-means (PCM) and fuzzy c-means (FCM) is proposed that often avoids various problems. We will use the proposed weight wij and the term
1 tij
in the objective function for alleviating the noise affect and to decrease the distances between clusters and centers and to avoid coincident clusters. Thus the objective function of the proposed method (PFCM) can be formulated as follows:
1
1, 1, , , 1,1 ,1
C
ij ij
i
u j n t j n C
i
1 1 2 1 1 1 , i jC n m
m
ij ij ij j i i j
u t w d x v
(23)
where 1
2 ,
C N m
m m m ij ij ij j i
u t w d x v
m
L
and is a user defined constants and the param is a ghting exponent for each fuzzy memb are tested in [30], hey proved that n between the data shape and
m. For i r shape will fit better if m = 3 is use re sion can be found in [10]. There-fore n the data shape in th
functio o be neral for all tested data sets. This penalty also c ntains spatial neighborhood
informa-eter m
n d, mo we take i n and t
term
wei ership. More datasets
there is a relatio stance, the triangula
discus to account ge o t e objective
tion, which acts as a regularizer and biases the solution toward piecewise-homogeneous labeling. Such regulari-zation is helpful in segmenting images corrupted by noise. The objective function Jm under the constraint of
ij
u and vi can be obtained by using the following theorem [25]:
Theorem: Let X
x ii, 1, 2, , N xiRd
de-notes an image with n pixels to be partitioned into Cclasses (clusters), where xi represents feature data. The algorithm is an iterative optimization that minimizes the objective function defined by Equation (23) with the
constraints
1
1, 1,
C ij i
u j n
. Then uij tij andi
v must satisfy the following equalities:
,
1 1 2 2 1 2 2, 1 ,
, 1 ,
c m m m
m
ij j i ij ij j i i
ij m m m
ij j i ij ij j i
w d x v t w d x v
u
w d x v t w d x v
(24)
1 2 11 1 1 1
1 1 1 1
1
m m ij j i j i j
i c n c n m
m m m
ij ij ij i ij i j i j
x v
u t w t
1
c n c n m m m
ij ij ij i
u t w t
(25)
1 1 2 1 1 21 1 1 1
,
, ,
c n m
m
ij ij j i i j
ij c n c n m
m m m
ij j i ij ij j i i j i j
u w d x v t
w d x v u w d x v
(26) Proof: The minimization of constraint problem Jm in Equation (23) under the given constraints ca solved of using the Lagrange multiplier method. We de-fine a new objective function with the constraint condi-tion of (Equacondi-tion (23)) as follows:Taking the partial derivative of Lm with respect t an
1
0 C 1
m ki k i L u
2 1 1 21 1 1 1
,
1 , 1
C N m
m m m m ij ij ij j i
i j
c n m n c
m
ij ij ij j i i ij
i j i i
L u t w d x v
u t w d x v u
0
(28) From Equation (27), we get:o uki d i and then setting them to equal to zero, we have:
2 1 2 1 0 , 1 , m m m mij ij j i m
m m
ij ij ij j i L
mu w d x v U
mu t w d x v
(27) 1 0 i
1 1 m 2 2 , iij m m
ij ij j i u
t w d x v
, 1
m ij j i m w d x v
(29) By substitution from Equation (29) into Equation (28), we get
1 1 m 1 1 2 2 1 12 2 1
1 2 2 1 2 1 1
, 1 ,
1
, 1 ,
, 1 ,
, 1 C m i m m m i
ij ij j i
C m m
m m
ij j i ij ij j i i
c m m
m
ij j i ij ij j i i
ij m m
ij j i
m w d x v t w d x v
m
w d x v t w d x v
w d x v t w d x v
u
w d x v
1 1
ij j i m i
1 1 2 , m m ij ij j it w d x v
(30)
2 1 2
1
1 1 1 1
2 1 2 1
1 1 1 1
0 , 1 , 0
0 2 2 1
c n m c n m
m m
m
ij ij j i ij ij ij j i
i j i j
ik
c n m c n m
m m m m
m
ij ij ij j i ij ij ij j i
i j i j
i
L
t w d x v u t w d x v
t L
m u t w x v m u t w x v
v
0(31)
1 1 2 1 1 21 1 1 1
1 1 1 1
1 1 1 1
,
, ,
1
1
c n m
m
ij ij j i i j
ij c n c n m
m m m
ij j i ij ij j i i j i j
c n c n m
m m m
ij ij ij i ij j i j i j
i c n c n m
m m m
ij ij ij i ij i j i j
u w d x v t
w d x v u w d x v
u t w t x
v
u t w t
1 2m1
(32)
The process of finding the best clusters is continued to update the centres and the membership using Equations (30) and respectively.
The algorithm for carrying out PFCM for segmenta-tion of MRI brain images can now be stated from the following steps:
1) Select the number of clusters “C” and fuzziness factor “m”
2) Select initial class center prototypes v
vi ;i
c
(31), ij
u i1, 2, ,C, randomly and ε ,a very small num 3) Find the value of wijusing Equation (22)
4) Update membershisp function uij using Equation (30)
5) Update membership function tij using Equation (31) 6) Update cluster center vi using Equation (32)
7) Repeat steps 3 to 6 until termination , where “t” ber
is the iteration steps, . is the Euclidean distance norm. 8) Stop
and 9%) and radio fre ncy (RF) lev-el
6% salt and pepper noise and the image size
is the nex
Th
con-si
ed ra
pa
4. Experimental Results
The experiments were performed on three different sets T1-weigthed and T2-weighted MRIs: in the first test, we used T1-weigthed and T2-weighted at various noise
lev-els (0%, 3%, 7% que
s (0% and 20%) as shown in Figure 1. T1-weigthed corrupted by
129 × 129 pixels [30] (see Figure 2) is used in t. t includes simulated volumetric MRI e third se
sting of ten classes as shown in Figure 3. The advan-tages of using digital phantoms rather than real image data for soft segmentation methods include prior
knowl-ge of the true tissue types and control over imaknowl-ge pa-meters such as modality, slice thickness, noise, and intensity in homogeneities. Through our implementation, we set the following rameters: m = 2, ε = 0.0001 and
2
. The quality of the segmentation algorithm is of tation process. The
com-m as proposed in [31] is vital importance to the segmen
parison score S for each algorith defined as follows:
ref ref
A A S
A A
(33) where A represents the set of pixels belonging to a class as found by a particular method and Aref represents the
(a) (b)
Figure 1. MRI image nal T2-weigthed.
: (a) Original T1-weigthed, (b)
Origi-Figure 2. Original T1-weigthed (slice 91).
reference cluster pixels.
4.1. Noisy T1-Weigthed and T2-Weighted MRI
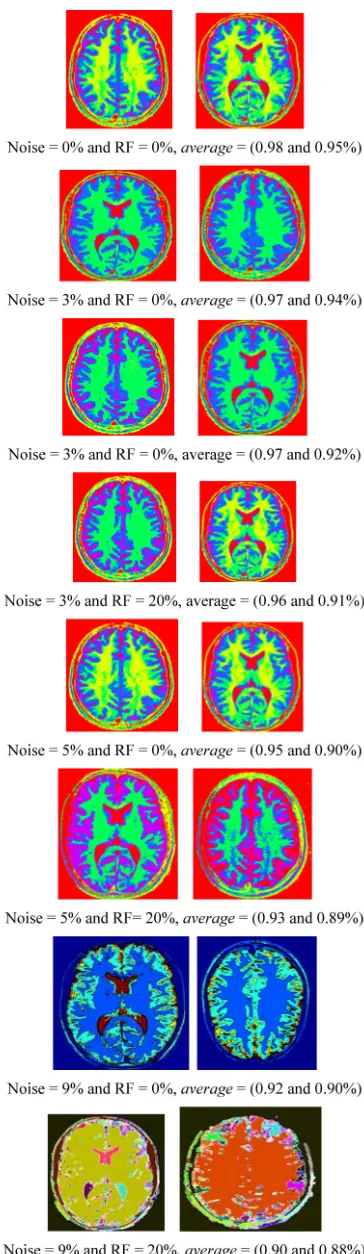
The proposed technique is applied to T1-weigthed and T2-weighted MRI [32] (as shown in Figures 1(a) and (b)) at various noise levels (0%, 3%, 5% and 9%) and RF levels (0% and 20%). To prove the efficiency of proposed algorithm, several noise levels are added to these data sets, while S (Equation (33)) is evaluated for each segment in T1-weigthed and T2-weighted. Figure 4 shows the seg-mentation output of T1-w and T2-weighted M I
at noise lev evels (0%
pose we have an image cont ining v segments, the accu-
racy scores can be computed from:
eigthed R
els (0%, 3%, 5% and 9%) and RF l
and 20%). The average of segmentation accuracy scores
(average) for each image is indicated in Table 1.
Sup-a
1 .
v i i
S average
v
Table 1 describes the average of the proposed method when applied to the test images. For example in Figure 4 when noise = 0% and RF = 0%, average is equal to 0.98% and 0.95% for T1-weigthed and T2-weighted MRI respectively. The obtained results show that the proposed algorithms are very robust to noise and i ensityhomo-geneities jdenbos
lent gorithm has desired
perform-h nt
and inhomogeneities. According to Zi
rage > 0.7 indicates excel
[32] statement that ave
agreement; the proposed al ance in cortical segmentation.
The best average is achieved for low noise and RF le-vels, for which values of average are higher than 0.94. According to Table 1, the proposed technique is stable at 88% at noise level 9% and RF 20%, this result is satis-factory for segmenting the weak boundary tissues.
4.2. T1-Weighted MRI Phantom
We used a high-resolution T1-weighted MRI (with slice thickness of 1mm, 6% noise and RF 20%) obtained from the simulated brain database of McGill University [32] (see Figure 2). In this test, beside evaluating the pro- posed method and the most recent fuzzy c-means such as:
Pal et al. [26], Wang et al. [22], Rajendran and D ana-
Figure 4. The segmentation results of T1-weigthed and T2-weighted MRI.
Table 1. The segmentation average of slices (T1-weigthed and T2-weighted MRI) with different situations of noise level and intensity non-uniformity (RF).
RF 0 20%
Slices Slices Noise
#51 #10 #51 #10
0% 0.98 0.95 0.97 0.94
3% 0.97 0.92 0.96 0.91
5% 0.95 0.90 0.93 0.89
9% 0.92 0.90 0.90 0.88
sekaran [24] and Zanaty and Aljahdali [11] are imple- mented and applied on the test image to prove the effi- ciency of the proposed method. Five segments as shown in Figures 5-9 are obtained after applying these methods to this image. Evaluating the accuracy of the existing methods and the proposed method is shown in Table 2. Obviously, the proposed method acquires the best seg- mentation performance. The proposed method appears to be stable and achieve better performance than Pal et al.
[26], Wang et al. [22], Rajendran and Dhanasekaran [24] and Zanaty and Aljahdali [11] by factor 12%, 8%, 7%, and 3% respectively.
4.3. Simulated MR Data
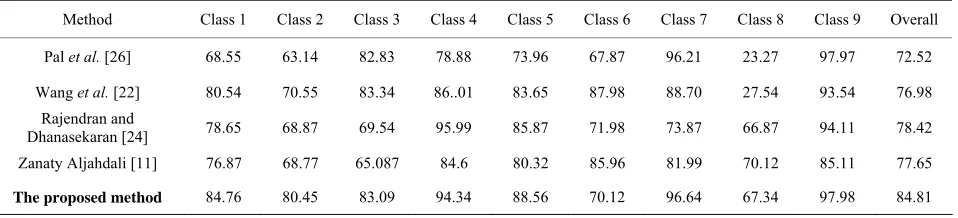
In this section, we experiment the proposed method and some existing methods such as: Pal et al. [26], Wang et al. [22], Rajendran and Dhanasekaran [24] and Zanaty and Aljahdali [11] when applied to the nine classes (slic- es# 51-59) from 3D simulated data (see Figure 3). Ta- ble 3 shows the corresponding accuracy scores (%) of the proposed and the existing methods for the nine classes. Obviously, the FCM gives the worst segmentation accu- racy for all classes, while other methods give satisfactory results. On the other hand, the method of Pal et al. [26], Wang et al. [22], Rajendran and Dhanasekaran [24] and Zanaty and Aljahdali [11] acquire the good segmentation performance in case of classes 9, 3, 4, and 8 respectively. Overall, the proposed method is more stable and achieves much better performance than the others in all different classes even with misleading of true tissue of validity indexes.
5. Conclusion
This paper has presented a new approach called possib- lsistic fuzzy c-means (PFCM) which combines FCM and PCM to overcome the weakness of both methods. The pro- posed algorithm is formulated by modifying the object e
[image:8.595.307.538.122.242.2](d) (e)
tion using Pal et al. [26].
(a) (b) (c)
re 5 ults menta
Figu . Res of seg
(d) (e)
ion using Wang et al. [22].
(a) (b) (
Figure 6. Results of segmen
c)
tat
(d) (e)
ndran and Dhanasskaran method [24].
(a) (b) (
Fig
c)
ure 7. Results of segmentation using Raje
[image:9.595.93.500.91.629.2](a) (b) (c) (d) (e)
Figure 8. Results of segmentation Zanaty and Ajahdali [11].
(a) (e)
Figure 9. Results of segmentati n using the proposed method. noise effect during segmentation. To prove the efficiency
of the proposed algorithm in segmenting the MRI images, the proposed algorithm has been applied to different data sets. The first set includes T1-weigthed and T2-weighted MRI at noise le
levels (0% and 20% algorithm succeeded to se
noise levels from 0% to 9% and RF levels from 0% to 20%). The accuracy average of output segmentation of T1-weigthed and T2-weighted MRI shows excellent per- formances exceeding 88% for complex image structures. oposed algorithm se while the score superiority of
(b) (c) (d)
o
vels (0%, 3%, 5%, 7%, and 9%) and RF Next test, we have experimented the pr ). We have noted that the proposed
gment noisy MRI images (at
[image:9.595.99.503.393.626.2]Table 2. Accuracy of th segmentation results.
Segments
e
Methods
a b c d e Average
Pal et al.[26] 99.2% 50.12% 73.87% 71.73% 80.39% 75.08%
Wang et al. [22] 99.0% 40.55% 87.23% 85.0% 79.65% 80%
Rajendran and Dhanasekar 79.43%
Zanaty Aljahdali [11] 81.23% 84%
The proposed method 99.88% 77.47% 84.86% 88.43% 87.64% 87.66%
an [24] 99.1% 73.98% 79.54% 66.54% 77.98%
99% 80.07% 83.89% 74%
Table 3. Segmentation accuracy (%) of the proposed and the existing methods on brain classes.
Method Class 1 Class 2 Class 3 Class 4 Class 5 Class 6 Class 7 Class 8 Class 9 Overall
Pal et al.[26] 68.55 63.14 82.83 78.88 73.96 67.87 96.21 23.27 97.97 72.52
Wang et al. 93.54 76.98
Rajendran and
Dhanasekaran [24] 78.6 66.87 94.11 78.42
6
[22] 80.54 70.55 83.34 86..01 83.65 87.98 88.70 27.54
5 68.87 69.54 95.99 85.87 71.98 73.87
Zanaty Aljahdali [11] 76.87 68.77 65.087 84. 80.32 85.96 81.99 70.12 85.11 77.65
The proposed method 84.76 80.45 83.09 94.34 88.56 70.12 96.64 67.34 97.98 84.81
al. [22] by factor 7%, Rajendran and
by factor 8% and Zanaty and Aljahdali [11] by factor 3%. In addition, fo ulated 3D data (brain volume con- sists of ten slices), the average accuracy o he propos algorithm ha uated and comp Pal [26], Wang et al. [22], Rajendran and Dhanasekaran [24] and Zanaty [11]. We hav d tha
aver et ve an
provemen , 6%, and 7% Pal et al.
[26], Wan dran and Dh karan and Zana ] respectiv
Future research in MRI segmentation should strive oward improv
tation algorithms. This is particularly important as MRI imaging ming a r di
clinica t is als orta t a ctic
segmen rithm sh eal lum
segm d of 2D slice b se ati since in na
[1] aratana, R. H. B nedic L. J
cobs, “Fluid-Attenuated Inversion Recovery Magnetic
the proposed algorithm is demonstrated by comparing its performance against the existing Pal et al. [26], Wang et al. [22], Rajendran and Dhanasekaran [24] and Zanaty and Aljahdali [11]. The proposed method achieves better performance than Pal et al. [26] by factor 12%, Wang et
58, No. 5, 2001, pp. 742-748.
Dhanasekaran [24]
r the sim
f t ed
ve been eval ared to et al.
and Aljahdali e note t the age accuracy of the proposed m hod ga im-
t about 12%, 8% g et al. [22], Rajen
over
anase [24] ty and Aljahdali [11 ely.
t ing the computation speed of the segmen-
is beco outine agnostic procedure in l practice. I
tation algo
o imp ould d
nt tha
with 3D vo ny pra al
e entation instea y slice gment on,
MRI data is 3D ture.
REFERENCES
R. Bakshi, S. Ariy . Be t and a-
Resonance Imaging Detects Cortical and Juxtacortical Multiple Sclerosis Lesions,” Archives of Neurology, Vol.
http://dx.doi.org/10.1001/archneur.58.5.742
[2] A. Ayman, T. Funatomi, M. Minoh, E. A. Zanaty, T. Okada, K. Togashi, T. Sa ai and S. Yamada, “New Re- gion Growing Segmentation Technique for MR Images
IEICE Conference MI2010-79, 71-76.
[ Wang, J.-L. Yang, H.-J. Sun, D. Chen and X.-L.
Growing Me edical
age Selec n and Eva tion Based on Canny Edge
ction, geme Service S MASS),
Wuhan, 12-14 August 2011, pp. 1-4.
[4] . Mu M. M , S. Z. Bee d K. Re-
, “A Regio ng Algori edical
Image Segmentation,” International Journal of Computer ce & ation ogy (IJCSIT l. 4, No. 12.
[5] K. K. L. Wong, J. Y. Tu, R. M. Kelso, S. G. Worthley, P. “Cardiac Flow
ng & Physics,
. 3 , 2 17
:// rg/ /j.m hy 1.0
k
with Weak Boundaries,” Japan, 2010, pp.
3] H.-R.
Liu, “An Improved Region
Im tio lua thod for M
Dete ” Mana nt and cience ( M. N barak, . Sathik vi an vathy Hybrid n Growi thm for M
Scien Inform Technol ), Vo 3, 20
Sanders, J. Mazumdar and D. Abbott, Component Analysis,” Medical Engineeri
Vol 2, No. 2
dx.doi.o 010, pp.10.1016 4-188. edengp
http .2009.1 07
[6] . Z “A oac d o n Concepts
for Improving Brain Magnetic Resonance Images (MRIs) me ,” Jo of M Im and Health
rm ol. 1, 2 . 30
://d rg/1 /jm 3.11
E. A anaty, n Appr h Base n Fusio
Seg ntation urnal edical agining Info atics, V
x.doi.o
3, No. 0.1166
013, pp ihi.201
-37. 22 http
[7] . Z d A. S. Ghiduk, “A Novel Approach for
dica e S atio d on tic and Seed
ion ing hm rna mpu i-
ence and Information Systems, Vol. 10, No. 3, 2013. E. A anaty an
Me
Reg Growl Imag egmentAlgorit s,” n BaseJou l of Co Gene ter Sc
[image:10.595.62.541.251.360.2]thods in Biomechanics and Biomedical Engineering, Vol. 16, No. 12, 2012, pp. 1262-1272.
[9] M. N. Ahmed, S. M. Yamany, N. Mohamed, A. A. Farag and T. Moriarty, “A Modified Fuzzy c-Means Algorithm for Bias Field Estimation and Segmentation of MRI Da-ta,” IEEE Transactions on Medical Imaging, Vol. 21, No. 3, 2002, pp. 193-199.
http://dx.doi.org/10.1109/42.996338
[10] T. N. Pappas, “An Adaptive Clustering Algorithm for Image Segmentation,” IEEE Transactions on Signal Pro- cessing, Vol. 40, No. 4, 1992, pp. 901-914.
http://dx.doi.org/10.1109/78.127962
[11] E. A. Zanaty and S. Aljahdali, “Automatic Fuzzy Algo- rithms for Reliable Image Segmentation,” International Society for Computers and Their Applications, Vol. 19, No. 3, 2012, pp. 166-175.
[12] Z. M. Wang, Y. C. Soh, Q. Song and K. Sim, “Adaptive Spatial Information-Theoretic Clustering for Image Seg- mentation,” Pattern Recognition Letters, Vol. 42, No. 9, 2009, pp. 2029-2044.
http://dx.doi.org/10.1016/j.patcog.2009.01.023
[13] J. H. Xue, A. Pizurica, W. Philips, E. Kerre, R. Van de Walle and I. Lemahieu, “An Integrated Method of Adap-
tive Enhancem gmentation of MRI
Brain Images,” ent for Unsupervised SePattern Recognition Letters, Vol. 24, No. 15, 2003, pp. 2549-2560.
http://dx.doi.org/10.1016/S0167-8655(03)00100-4 [14] K. S. Chuang, H. L. Tzeng, S. Chen, J. Wu and T. J. Chen,
“Fuzzy c-Means Clustering with Spatial Information for Image Segmentation,” Comp
and Graphics, Vol. 30, No. 1, 2006, pp. 9-15uterized Medical Imaging. http://dx.doi.org/10.1016/j.compmedimag.2005.10.001 [15] S. H. Lee and M. M. Crawford, “Unsupervised Multistage
Image Classification Using Hierarchical Clustering with a Bayesian Similarity Measure,” IEEE Transactions on Image Processing, Vol.14, No. 3, 2005, pp. 312-320.
218
[16] A. W. C. Liew, S. H. Leung and W. H. Lau, “Fuzzy Im- age Clustering Incorporating Spatial Continuity,” IEE Proceedings of Vision, Image and Signal Processing, Vol. 147, No. 2, 2000, pp. 185-192.
http://dx.doi.org/10.1049/ip-vis:20000
and J. Prince, “Adaptive Fuzzy Segmentation of [17] S. Roy, H. K. Agarwal, A. Carass, Y. Bai, D. L. Pham
and J. L. Prince, “Fuzzy c-Means with Variable Com- pactness,” IEEE International Symposium on Biomedical Imaging, 2008, pp. 452-455.
[18] D. Pham
Magnetic Resonance Images,” IEEE Transactions on Me- dical Imaging, Vol. 18, No. 9, 1999, pp. 737-752. http://dx.doi.org/10.1109/42.802752
[19] A. W. C. Liew and H. Yan, “An Adaptive Spatial F Clustering Algorithm for 3-D MR Image Segmentation,” uzzy
IEEE Transactions on Medical Imaging, Vol. 22, No. 9, 2003, pp. 1063-1075.
http://dx.doi.org/10.1109/TMI.2003.816956
[20] L. Szilágyi, S. M. Szilágyi and Z. Benyó, “A Modified
for Image Segmenta-
Medical Imaging and Graphics, FCM Algorithm for Fast Segmentation of Brain MR Im- ages,” ICIARLNCS, Vol. 4633, 2007, pp. 866-877. [21] B. Y. Kang, D. W. Kim and Q. Li, “Spatial Homogeneity-
Based Fuzzy c-Means Algorithm
tion,” FSKDLNAI, Vol. 3613, 2005, pp. 462-469. [22] J. Z. Wang, J. Kong, Y. H. Lu, M. Qi and B. X. Zhang,
“A Modified FCM Algorithm for MRI Brain Image Seg- mentation Using Both Local and Non-Local Spatial Con- strains,” Computerized
Vol. 31, No. 8, 2008, pp. 685-698.
http://dx.doi.org/10.1016/j.compmedimag.2008.08.004 [23] Z. Ji, Q. Sun and D. Xia, “A Modified Possibilistic Fuzzy
c-Means Clustering Algorithm for Bias Field
and Segmentation of Brain MR Image,” Computerized Estimation Medical Imaging and Graphics, Vol. 35, No. 5, 2011, pp. 383-397.
http://dx.doi.org/10.1016/j.compmedimag.2010.12.001 [24] A. Rajendran and R. Dhanasekaran, “MRI Brain Image
c-Means
5, pp. 0099 Tissue Segmentation Analysis Using Possibilistic Fuzzy c-Means Method,” International Journal on Computer Science and Engineering, Vol. 3, No. 12, 2011, pp. 3832- 3836.
[25] N. R. Pal, K. Pal and J. C. Bezdek, “A Mixed
Clustering Model,” IEEE International Conference on Fuzzy Systems, Vol. 1, 1997, pp. 11-21.
[26] N. R. Pal, K. Pal, J. M. Keller and J. C. Bezdek, “A Pos- sibilistic Fuzzy c-Means Clustering Algorithm,” IEEE Transactions on Fuzzy Systems, Vol. 13, No. 4, 200 517-530. http://dx.doi.org/10.1109/TFUZZ.2004.84 [27] H. Timm, C. Borgelt, C. Doring and R. Kruse, “An Ex-
tension to Possibilistic Fuzzy Cluster Analysis,” Fuzzy Sets and Systems, Vol. 147, No. 1, 2004, pp. 3-16. http://dx.doi.org/10.1016/j.fss.2003.11.009
[28] J. S. Zhang and Y. W. Leung, “Improved Possibilistic c- Means Clustering Algorithms,” IEEE Transactions on Fuzzy Systems, Vol. 12, No. 2, 2004, pp. 209-217. http://dx.doi.org/10.1109/TFUZZ.2004.825079
[29] W. L. Hung, M. Yang and D. Chen, “Parameter Selection for Suppressed Fuzzy c-Means with an Application to MRI Segmentation,” Pattern Recognition Letters, Vol. 27, No. 5, 2006, pp. 424-438.
[30] Brain Web, “Simulated Brain Database,” Mcconnell
Sun and Z. Q. Sun, “Fuzzy Brain Imaging Centre, Montreal Neurological Institute, McGill University.
http://brainweb.bic.mni.mcgill.ca/brainweb/ [31] Z. H. Yin, Y. G. Tang, F. C.
Clustering with Novel Serable Criterion,” Tsinghua Sci- ence and Technology, Vol. 11, No. 1, 2006, pp. 50-53. http://dx.doi.org/10.1016/S1007-0214(06)70154-7 [32] A. P. Zijdenbos, “MRI Segmentation and the Quantifica-
![Figure 7. Results of segmentation using Rajendran and Dhanasskaran method [24].](https://thumb-us.123doks.com/thumbv2/123dok_us/7936636.750064/9.595.93.500.91.629/figure-results-segmentation-using-rajendran-and-dhanasskaran-method.webp)