http://dx.doi.org/10.4236/jbise.2016.96026
A Method of Using Information Entropy
of an Image as an Effective Feature for
Computer-Aided Diagnostic Applications
Eri Matsuyama1, Noriyuki Takahashi2, Haruyuki Watanabe3, Du-Yih Tsai4,51Department of Radiological Technology, Faculty of Fukuoka Medical Technology, Teikyo University, Fukuoka,
Japan
2Department of Radiology and Nuclear Medicine, Research Institute for Brain and Vessels-Akita, Akita, Japan 3School of Radiological Technology, Gunma Prefectural College of Health Sciences, Gunma, Japan
4Department of Electrical and Computer Engineering, National Institute of Technology, Gifu College, Gifu,
Japan
5Department of Biomedical Engineering, Hungkuang University, Taiwan
Received 24 February 2016; accepted 28 May 2016; published 31 May 2016 Copyright © 2016 by authors and Scientific Research Publishing Inc.
This work is licensed under the Creative Commons Attribution International License (CC BY).
http://creativecommons.org/licenses/by/4.0/
Abstract
Keywords
Information Entropy, Image and Texture Feature, Computer-Aided Diagnosis, Support Vector Machine
1. Introduction
Computer-aided detection and diagnosis (CAD) systems are increasingly being used as an aid by clinicians for detection and interpretation of diseases [1]. So far a number of CAD systems have been approved for clinical use and many more are currently under development. In general, a CAD system employs a classifier to detect or distinguish between abnormal and normal tissues in images. In the phase of classification, a set of image fea-tures and/or texture feafea-tures extracted from the images are used. The performance of a CAD system largely pends on the determination and selection of the features relevant to a specific application. Therefore, feature de-termination and feature selection are very important tasks in the development of CAD [2].
Mutual information (MI) has been used as a similarity metric in image registration and template matching [3]-[5] and used as a feature selection criterion in CAD [6][7]. Recently, the MI has also been used as a measure for evaluation of medical imaging systems [8]-[10]. In the studies of assessment of image quality, the MI is used to express the amount of information that an output image of Y contains about an input object of X. Then, the mutual information can be obtained by using the formula of MI(X; Y) = H(X) + H(Y) − H(X, Y), where H(X), H(Y), and H(X, Y) are input entropy, output entropy, and joint entropy, respectively. The more the MI value pro-vides, the better image quality is [9]. Through the studies of MI, we have noticed that the amount of output en-tropy greatly affects the MI value and might be used as an effective texture feature of an image. This finding motivates a further investigation of the behavior of the output entropy of an image.
The purpose of this study is to investigate the characteristic of the output entropy of an image and to demon-strate the usefulness of the output entropy acting as a texture feature in CAD systems. The ultimate goal is to develop a CAD system that utilizes relevant and powerful texture features. In order to validate the effectiveness and superiority of the output-entropy-based texture feature, two well-known texture features, i.e., mean and standard deviation were used for comparison. In the present study, we employed a support vector machine as a classifier for classification. A leave-one-out method was used for training and classification. Three combinations of texture features, i.e., mean and entropy, standard deviation and entropy, and standard deviation and mean were used as the inputs to the classifier. We evaluated the performance of the three combinations in terms of sensitivity, specificity and accuracy.
2. Materials and Methods
2.1. Entropy of an ImageIf a set of events s1, ∙∙∙, sm whose probabilities are given by {p1, p2, ∙∙∙, pm}, respectively, then the Shannon en-tropy H can be expressed as
( )
1 log2m
i i
i
H S = −
∑
= p p (1)Consider an image in which every pixel has a unique output belonging to one of the various pixel values or gray levels. Then the frequency of each different pixel value can be obtained. We can rewrite Equation (1) as follows:
( )
log2 j jlog2 jH S = n−
∑
n n , (2)where nj is the frequency of pixel value j and n is the total of frequency (total number of pixels in an image). For example, an image size is M × N = 25 × 20 = 500. Suppose that all the pixel values lie in one of the seven bins based on the image’s pixel values, and the frequencies of the 7 bins are 20, 64, 118, 98, 94, 16 and 90, respec-tively. Then, the entropy of the image can be calculated using Equation (2) [11]:
( )
log 500 1 500 20 log 20 64 log 64 118log 118 98log 982(
2 2 2 2)
2.575H S = − + + + + + etc = . (3)
graph showing the number of pixels in an image at each different pixel value found in that image. Therefore, the amount of entropy of an image largely depends on the distribution and the occurrence of pixel values. Because of this property, we consider that the entropy of an image offer some advantages over texture features such as the mean and standard deviation that are commonly used in CAD applications. In practice, when calculating the entropy of an image, only the diagnostically relevant region of interest in the image is used.
2.2. Database and Texture Features
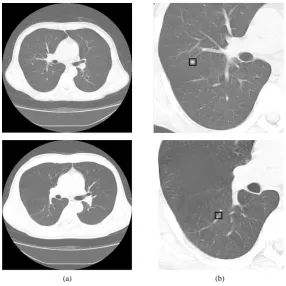
The database used in this study comprised 50 CT images obtained from 10 patients with pulmonary nodules, and 50 CT images obtained from 5 normal subjects. A physician detected pulmonary nodules from the images in these abnormal cases. All images were acquired with a multidetector-row CT scanner (Hitachi Robusto, Japan). Scanning were performed by use of a matrix size of 512 × 512; the field of view was 320 mm, the tube voltage and tube current were 120 kV and 175 mAs, respectively, with section thickness of 5.0-mm. Figure 1 shows a CT image with pulmonary nodule and a CT image from a normal subject. Figure 1(a) and Figure 1(b) are the original images of the lung and the magnified, left parts of the lung, respectively.
Extracting effective features from an image is a key characteristic of a successful CAD system [12]. Typical features for medical images include area, shape, texture, gray level, and various statistics. Three textures fea-tures, i.e., entropy, mean and standard deviation of an image, were used in this study for analysis and compari-son. The entropy used in this study was directly obtained from the gray level of an image rather than from gray level co-occurrence matrix calculated from the segmented image [13][14]. The entropy of image used in this study is a kind of first-order texture feature, while the entropy obtained from co-occurrence matrix belongs to second-order texture feature. Mean and standard deviation are commonly utilized texture features in CAD sys-tems [12][15][16]. Figure 2 illustrates the histograms of the region of interest (ROI) images shown in the fig-ure. The ROI of 9 × 9 pixels was extracted and indicated by a square box in Figure 1(b).
[image:3.595.170.457.377.664.2]
(a) (b)
Figure 2. Histograms of the ROI images shown in upper right corners. The size of ROI images is 9 × 9 pixels. (a) Abnor-mal case (nodule) and (b) norAbnor-mal case.
2.3. Classification and Evaluation
In this study we used a support vector machine (SVM) for classification. The SVM is a new generation learning system that has many attractive modeling features [17]-[19]. We employed a Gaussian kernel, the most com-monly used in SVM for classification. The parameter gamma, which controls the degree of non-linearity of the model, was empirically set at 0.01, and the regularization parameter C relating to the cost function for determi-nation of an optimal hyperplane was empirically determined as 16.0.
A leave-one-out method was used for training and classification. Three combinations of texture features, i.e., mean vs. entropy, standard deviation vs. entropy and standard deviation vs. mean were used for comparison of feature performance. The ROIs for the calculation of image texture features were manually selected by an expe-rienced radiologist with a square box of predetermined sizes.
2.4. Performance Measures
We used sensitivity, specificity and accuracy as performance measures. Sensitivity measures the proportion of actual positives which are correctly identified (or true positives) when the image contains abnormal tissues in it. Specificity measures the proportion of negatives which are correctly identified (or true negatives) when abnor-mal tissues is not present in the image [20][21]. Classification accuracy is a measure of overall performance of CAD system and is defined as the percentage of diagnostic decisions that proved to be correct [20].
3. Results
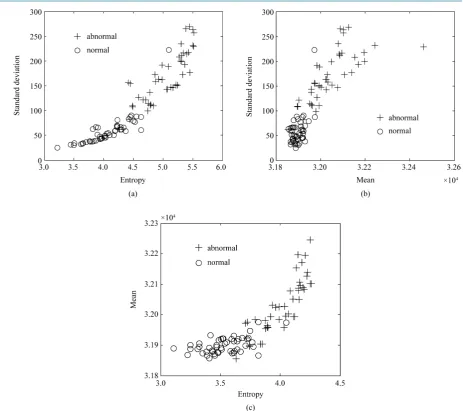
Figure 3. Examples of the distributions of three features. (a) Mean versus standard deviation, (b) entropy versus standard deviation, and (c) entropy versus mean.
Table 1. Classification performance of the three combinations of texture features.
Combination of texture features ROI size Sensitivity Specificity Accuracy
Mean and entropy 7 × 7 0.98 0.94 0.96
9 × 9 0.88 0.96 0.92
11 × 11 0.80 0.90 0.85
Standard deviation and entropy 7 × 7 0.98 0.96 0.97
9 × 9 0.96 0.98 0.97
11 × 11 0.94 0.98 0.96
Standard deviation and mean 7 × 7 0.96 0.92 0.94
9 × 9 0.96 0.96 0.96
[image:5.595.92.537.541.722.2]4. Discussion
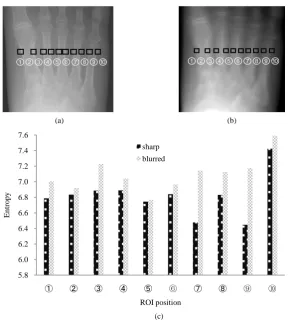
Figure 4and Figure 5 show the characteristics of the output entropy obtained from an image. Figure 4(a) is an image of the hip joint of the human body phantom. The areas marked with squares indicate the ROIs selected for computation of output entropy. The upper and lower square areas are the portions of hard tissue (bone) and soft tissue (muscle), respectively. Figure 4(b) illustrates the relationship between radiation exposure level and output entropy. The graphs in the figure correspond to the two ROIs shown in Figure 4(a). Figure 4(b) indicates that output entropy decreases with the increase of radiation exposure level. It is well known that reducing radiation exposure level will increase noise level in the image and resulting in sacrificing diagnostic image quality. Thus, the output entropy is highly correlated with image quality in terms of image noise. Figure 5(a) and Figure 5(b)
are a sharp image and a blurred image obtained from a hand phantom, respectively. Ten each of ROIs at differ-ent positions were selected for calculation of the output differ-entropy of the sharp and blurred images. Figure 5(c)
shows the output entropies at the corresponding 10 different ROI positions for the sharp and blurred images. The figure indicates that the output entropy obtained from the blurred image is greater than that of the sharp image at each corresponding position of the ROIs. The results demonstrate that the output entropy is correlated with im-age quality in terms of imim-age resolution. From the preliminary results of investigations of the characteristics of the output entropy, the output entropy of an image can be used as an effective feature for CAD schemes.
There is a limitation to this study. We only used CT images with and without pulmonary nodules for the in
Table 2. Fisher’s exact test results.
Combinations ROI size Chi-square value P-value
(Mean & entropy) vs. (SD & entropy) 7 × 7 0.148 0.700
9 × 9 2.405 0.121
11 × 11 7.037 0.008*
(SD & entropy) vs. (SD & mean) 7 × 7 1.047 0.306
9 × 9 0.148 0.700
11 × 11 4.348 0.037*
(Mean & entropy) vs. (SD & mean) 7 × 7 0.421 0.516
9 × 9 1.418 0.233
11 × 11 0.385 0.535
SD: standard deviation; *statistically significant p < 0.05.
(a) (b)
Figure 4. (a) An image of the hip joint of the human body phantom, (b) relationship between radiation exposure level and output entropy obtained from different ROIs. The square boxes shown in (a) are the extracted regions-of-interest and used for calculation of the texture fea-tures.
4.2 4.4 4.6 4.8 5.0 5.2 5.4 5.6 5.8 6.0
0 50 100 150 200 250 300 350
E
n
tr
o
p
y
(a) (b)
(c)
Figure 5. (a) A sharp image and (b) a blurred image obtained from a hand phantom. (c) Output entropies at the corresponding 10 different ROI posi-tions for the sharp and blurred images.
vestigation. Various images obtained from different modalities such as, mammograms and digital radiography will be used for further studies.
5. Conclusion
We investigated the characteristic of the output entropy of an image and demonstrated the usefulness of the output entropy acting as a texture feature in CAD systems. In order to validate the effectiveness and superiority of the output-entropy-based texture feature, two well-known texture features, i.e., mean and standard deviation were used for comparison. We used a support vector machine for classification. A leave-one-out method was employed for training and classification. Our study showed that the combination of entropy and standard devia-tion was significantly better than both the combinadevia-tion of mean and entropy and that of standard deviadevia-tion and mean in the case of the ROI size of 11 × 11 pixels (p < 0.05). These results suggest that information entropy of an image can be used as an effective feature for CAD applications.
References
[1] Petrick, N., Sahiner, B., Armoto III, S.G., Bert, A., Correale, L. and Delsanto, S., et al. (2013) Evaluation of Computer- Aided Detection and Diagnosis Systems. Medical Physics, 40, 087001, 1-17.
[2] Doi, K. (2007) Computer-Aided Diadnosis in Medical Imaging: Historical Review, Current Status and Future Potential. Computerized Medical Imaging and Graphics, 31, 198-211. http://dx.doi.org/10.1016/j.compmedimag.2007.02.002
[3] Pluim, J.P.W., Maintz, J.M.A. and Viergever, M.A. (2003) Mutual-Information-Based Registration of Medical Images: A Survey. IEEE Transaction Medical Imaging, 22, 986-1004. http://dx.doi.org/10.1109/TMI.2003.815867
[4] Tourassi, G.D., Vargas-Voracek, R., Catarious, Jr., D.M. and Floyd, Jr., C.E. (2003) Computer-Assisted Detection of Mammographic Masses: A Template Matching Scheme Based on Mutual Information. Medical Physics, 30, 2123-2130.
①②③④⑤⑥⑦⑧⑨⑩ ①②③④⑤⑥⑦⑧⑨⑩
5.8 6.0 6.2 6.4 6.6 6.8 7.0 7.2 7.4 7.6
➀ ➁ ➂ ➃ ➄ ⑥ ➆ ➇ ⑨ ⑩
E
n
tr
o
p
y
[image:7.595.169.458.79.404.2]http://dx.doi.org/10.1118/1.1589494
[5] Tourassi, G.D., Harrawood, B., Singh, S. and Lo, J.Y. (2007) Information-Theoretic CAD System in Mammography: Entropy-Based Indexing for Computational Efficiency and Robust Performance. Medical Physics, 34, 3193-3204.
http://dx.doi.org/10.1118/1.2751075
[6] Last, M., Kandel, A. and Maimon, O. (2001) Information-Theoretic Algorithm for Feature Selection. Pattern Recogni-tion Letters, 22, 799-811. http://dx.doi.org/10.1016/S0167-8655(01)00019-8
[7] Tourassi, G.D., Frederick, E.D., Markey, M.K. and Floyd, Jr., C.E. (2001) Application of the Mutual Information Cri-terion for Feature Selection in Computer-Aided Diagnosis. Medial Physics, 28, 2394-2402.
http://dx.doi.org/10.1118/1.1418724
[8] Tsai, D.-Y., Lee, Y. and Matsuyama, E. (2008) Information Entropy Measure for Evaluation of Image Quality. Journal of Digital Imaging, 21, 338-347. http://dx.doi.org/10.1007/s10278-007-9044-5
[9] Matsuyama, E., Tsai, D.-Y. and Lee, Y. (2009) Mutual Information-Based Evaluation of Image Quality with Its Pre-liminary Application to Assessment of Medical Imaging Systems. Journal of Electronic Imaging, 18, 033011, 1-11.
http://dx.doi.org/10.1117/1.3206967
[10] Matsuyama, E., Tsai, D.-Y., Lee, Y. and Kojima, K. (2010) Using Mutual Information to Evaluate Performance of Medical Imaging Systems. Health, 2, 279-285. http://dx.doi.org/10.4236/health.2010.24040
[11] Tsai, D.-Y. and Matsuyama, E. (2015) Recent Advances of Quality Assessment for Medical Imaging Systems and Medical Images. In: Deng, C., Ma, L., Lin, W. and Ngan, K.N., Eds., Visual Signal Quality Assessment, Springer, Cham Heidelberg, New York, Dordrecht, London, 157-183. http://dx.doi.org/10.1007/978-3-319-10368-6_6
[12] Wang, S., Burtt, K., Turkbey, B., Choyke, P. and Summers, R.M. (2014) Computer Aided-Diagnosis of Prostate Can-cer on Multiparametric MRI: A Technical Review of Current Research. BioMed Research International. 2014, Article ID: 789561.
[13] Zhao, Q., Shi, C.-Z. and Luo, L.-P. (2014) Role of the Texture Features of Images in the Diagnosis of Solitary Pulmo-nary Nodules in Different Sizes. Chinese Journal of Cancer Research, 26, 451-458.
[14] Tsai, D.-Y. and Tomita, M. (1995) A Computer-Aided System for Discrimination of Dilated Cardiomyopathy Using Echocardiographic Images. IEICE Transactions on Fundamental of Electronics, Communication and Computer Sciences, E78-A, 1649-1654.
[15] Mabrouk, M., Karrar, A. and Sharawy, A. (2012) Computer Aided Detection of Large Lung Nodules Using Chest Computer Tomography Images. International Journal of Applied Information Systems, 3, 12-18.
[16] Lee, Y., Hara, T., Fujita, H., Itoh, S. and Ishigaki, T. (2001) Automated Detection of Pulmonary Nodules in Helical CT Images Based on an Improved Template-Matching Technique. IEEE Transactions on Medical Imaging, 20, 595-604.
http://dx.doi.org/10.1109/42.932744
[17] Vapnik, V.N. (1999) The Nature of Statistical Learning Theory: Statistics for Engineering and Information Science. 2nd Edition, Springer-Verlag, New York.
[18] Cristianini, N. and Shawe-Taylor, J. (2000) An Introduction to Support Vector Machines and Other Kenel-Based Learning Methods. Cambridge University Press, Cambridge. http://dx.doi.org/10.1017/CBO9780511801389
[19] Takahashi, N., Lee, Y., Tsai, D.-Y., Matsuyama, E., Kinoshita, T. and Ishii, K. (2014) An Automatic Detection Method for the MCA Dot Sign of Acute Stroke in Unenhanced CT. Radiological Physics and Technology, 7, 79-88.
http://dx.doi.org/10.1007/s12194-013-0234-1
[20] Dheeba, J., Singh, N.A. and Selvi, S.T. (2014) Computer-Aided Detection of Breast Cancer on Mammograms: A Swarm Intelligence Optimized Wavelet Neural Network Approach. Journal of Biomedical Informatics, 49, 45-52.
http://dx.doi.org/10.1016/j.jbi.2014.01.010