Effect of Variation in Solid Bed Height on
Fluctuation RatioDuring Gas Fluidization of Solids
in Stationary Liquid
S. Kumar1, A. Arora2, H. Chandra3 1
Research Scholar, Department of Mechanical Engineering, Bhilai Institute of Technology, Durg, Chhattisgarh, India
2
Professor, Department of Mechanical Engineering, Bhilai Institute of Technology, Durg, Chhattisgarh, India
3
Associate Professor, Department of Mechanical Engineering, Vishwavidyalaya Engineering College, Sarguja University, Ambikapur, Chhattisgarh, India
Abstract: For defining the quality of fluidization there are three are three terms which are necessary to define. They are pressure drop, fluctuation ratio and expansion ratio. In the present work, an attempt has been made to evaluate the effect of increasing the initial bed height on the fluctuation ratio by measuring the pressure drop for different air flow rates. The finding states that for increasing solid bed height the fluctuation ratio also increase. However, for higher flow rates (more than 30 LPM) it increases more rapidly for increasing flow rates.
Keywords: Fluctuation ratio, fluidization, stationary liquid, solid bed height, bed expansion
I. INTRODUCTION
There are many ways to fluidize the solids using fluid during three phase fluidization. Fluidization may occur with con-current flow of gas and liquid, counter current mode of fluidization in which gas and liquid flow opposite to each other. The third type of fluidization in which gas fluidization of solids occur in a stationay pool of liquid.In stationary mode of fluidization few work have been reported in recent years.
Reported works are of Kumar et al. (2015) for defining effect of particle size on gas fluidizetion of solids in stationary liquid and of the same authors (Kumar et al., 2017) defining pressure distribution in the fluidized bed in stationary liquid. In the extension of these works, present work has been undertaken to find out the effect of increasing solid bed height on the fluctuation ratio for increasing flowrates by measuring expansionsion in the fluidized bed height.However, it has been established from the review of work already done in the field that for increasing flow rates in two phase and three phase fluidized beds with contineous fluid flowing state fluctuation ratio increases with increasing gas flow rate and expansion n the bed.
II. RELATED WORK
The term fluctuation ratio is used to describe the bed phenomenon qualitatively during fluidization. When gas velocity increases further after the minimum fluidizing velocity the upper zone of the fluidized bed starts oscillating up and down. The quantification of this oscillation is important to calaculate the height of the fluidizer. Basically, fluctuation ratio which can berepresented by symbol r, is the ratio between the maximum and minimum bed heights of the top most layer of the fluidized bed (Leva, 1956). So
=ℎ
ℎ
Several research work has been reported to quantify fluctuation ration in the fluidized beds. Kawabata et al. (1981) investigated the effect of pressurisation on the fluctuation ratio. They found that courser sized particles are more sensitive in comparision to fner size particles as well as fluctuation ratio is concerned.
Fluctuation ration in the conical type of fluidizing column has been calculated by Biswal et al. (1982). Singh and Roy (2006) carried out the study to find the effect of the shape of particle size on the fluctuation ratio. Mohanty et al. (2008) related the fluctuation ratio with the height of the fluidizing column.
III. EXPERIMENTAL SET-UP AND PROCEDURE
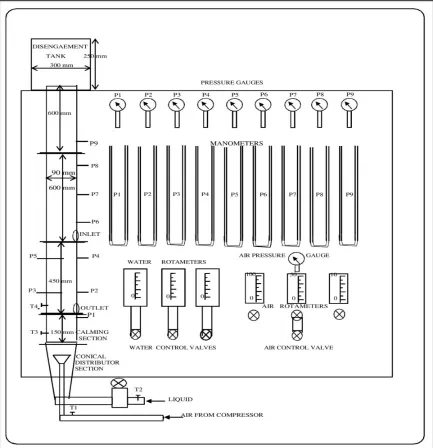
Experimental set-up consists on fluidizing column of 90 mm internal diameter and of 1800 mm height. The bottom of the fluidizer in connected with the calming section and at the top of the fluidizer there is disengagement section. Distributor section having air sparger is fitted just below the calming section. The fluidizing section has three different parts of 450 mm, 600 mm and 60mm height which are connected by flanges. Nine different pressure ports are given at different heights of the fluidizing column. Complete experimental set-up and its procedure are standardized using measurement system analysis. Kumar et al., 2015 conducted similar study for standardizing the experimental set-up and procedure during gas fluidization of solids in stationary liquid.
[image:3.612.90.523.268.716.2]Different liquids (water, kerosene, turpentine) are filled into the column up-to different heights (40 cm, 50 cm, 60 cm). Then different solids (coal, peanut, stone) are added into the column for different heights (10 cm, 20 cm, 30 cm). Peanut has been selected to extend the studies in the field of fluidization of food particles as conducted by Kumar et al. (2011). The solids are initially crushed and then sieved to segregate into 2 mm, 4 mm and 6 mm size. Now, air from the compressor is allowed to flow through the fluidizer at different flow rates ( 0, 7.5, 15, 30 and 45 lpm). The solids and liquid expanded and starts fluctuating inside the fluidizer. The top layer of the solids within the liquid boundary is carefully observed and it’s oscillating heights have been measured from the distributor plate.
IV. RESULTS AND DISCUSSIONS
[image:4.612.126.486.123.434.2]The description of parameters selected for the investigation and their rang has been presented in table 1.
Table 1Experimental Range of Parameters
Sr. Parameter Range Level
01 Flowrate, Q 0-45 lpm 0, 7.5, 15, 30, 45 lpm
02 Solid bed height, ℎ 10-30 cm 10, 20, 30 cm
03 Liquid height, 40-60 cm 40, 50, 60 cm
04 Size of material, 3 2, 4, 6 mm
05 Solid 3 Coal, Peanut, Stone
06 Liquid 3 Water, Kerosene,
[image:4.612.125.489.473.700.2]Turpentine
Fig. 2 Variation of fluctuation ratio with air flow rate for different solid bed heights [solid - stone, liquid - turpentine, dp= 2 mm, hl= 0.4 m]
Fig. 3 Variation of fluctuation ratio with air flow rate for different solid bed heights [solid - stone, liquid - kerosene, dp= 2 mm, hl= 0.4 m]
1 1.2 1.4 1.6 1.8 2 2.2 2.4 2.6
0 10 20 30 40 50
F lu c tu ati o n r ati o
Flow rate in lpm
Initial static bed height 10 cm
Initial static bed height 20 cm
Initai static bed height 30 cm 1 1.2 1.4 1.6 1.8 2 2.2 2.4 2.6 2.8
0 10 20 30 40 50
F lu c tu ati o n r ati o
Flow rate in lpm
Initial static bed height 10 cm
Initial static bed height 20 cm
Fig. 4 Variation of fluctuation ratio with air flow rate for different solid bed heights [solid - stone, liquid - water, dp= 2 mm, hl= 0.5 m]
Fig. 5 Variation of fluctuation ratio with air flow rate for different solid bed heights [solid - peanut, liquid - turpentine, dp= 2 mm, hl= 0.4 m]
1 1.2 1.4 1.6 1.8 2 2.2
0 10 20 30 40 50
F
lu
c
tu
ati
o
n
r
ati
o
Flow rate in lpm
Initial static bed height 10 cm
Initial static bed height 20 cm
Initai static bed height 30 cm
1 1.2 1.4 1.6 1.8 2 2.2 2.4 2.6
0 20 40 60
F
lu
c
tu
ati
o
n
r
ati
o
Flow rate in lpm
Initial static bed height 10 cm
Initial static bed height 20 cm
[image:5.612.126.488.419.690.2]Fig. 6 Variation of fluctuation ratio with air flow rate for different solid bed heights [solid - coal, liquid - kerosene, dp= 2 mm, hl= 0.5 m]
Fig. 7 Variation of fluctuation ratio with air flow rate for different solid bed heights [solid - stone, liquid - turpentine, dp= 4 mm, hl= 0.4 m]
1 1.2 1.4 1.6 1.8 2 2.2
0 10 20 30 40 50
F
lu
c
tu
ati
o
n
r
ati
o
Flow rate in lpm
Initial static bed height 10 cm
Initial static bed height 20 cm
Initai static bed height 30 cm
1 1.2 1.4 1.6 1.8 2 2.2 2.4 2.6
0 10 20 30 40 50
F
lu
c
tu
ati
o
n
r
ati
o
Flow rate in lpm
Initial static bed height 10 cm
Initial static bed height 20 cm
[image:6.612.124.485.370.693.2]Fig. 8 Variation of fluctuation ratio with air flow rate for different solid bed heights [solid - coal, liquid - turpentine, dp= 4 mm, hl= 0.6 m]
Fig. 9 Variation of fluctuation ratio with air flow rate for different solid bed heights [solid - peanut, liquid - water, dp= 6 mm, hl= 0.5 m]
1 1.1 1.2 1.3 1.4 1.5 1.6 1.7 1.8 1.9 2
0 10 20 30 40 50
F lu c tu ati o n r ati o
Flow rate in lpm
Initial static bed height 10 cm
Initial static bed height 20 cm
Initai static bed height 30 cm 1 1.1 1.2 1.3 1.4 1.5 1.6 1.7 1.8 1.9 2
0 10 20 30 40 50
F lu c tu ati o n r ati o
Flow rate in lpm
Initial static bed height 10 cm
Initial static bed height 20 cm
[image:7.612.124.487.374.684.2]Fig. 10 Variation of fluctuation ratio with air flow rate for different solid bed heights [solid - stone, liquid - kerosene, dp= 6 mm, hl= 0.5 m]
Extensive experimentation has been performed for analyzing the effect of solid bed height on the fluctuation ratio. It is quite clear from the analysis that for increasing solid bed height fluctuation ratio decreases. Further, fluctuation ratio is found maximum at a lower flow rate and then decreases sharply for increasing flow rates. Padhi et al. (2016) also reportedsimilar findings that for increasing solid bed height fluctuation ratio decrease. However they reported that for increasing flow rates fluctuation ratio also increases. In the present investigation, conflicting results are reported. Although fluctuation ratio is decreasing with increasing flow rates but maximum and minimum oscillating height of the expanded fluidized bed are found increasing with increasing flow rate. However, the ratio between maximum to minimum expanded bed height is decreasing this also shows the fluctuation is decreasing. The reason behind this finding is that the presence of liquid in stationary state.Abraham et al. (1992) reported that in three phase batch type slurry column above the critical gas velocity i.e. minimum velocity to suspend the solids, the liquid starts recirculation behaving within the column. During recirculation behavior liquid with gas moves up then after reaching certain height it starts moving downward. Subsequently, entire liquid mass starts behaving in the same manner. Due to this liquid recirculation state and momentum took from the liquid, solids also move upward then moves downward and form a continuous cyclic motion within the fluidizing zone. This condition of recirculation is possible at higher flow rates only. However, excessive amount of flow rate breaks this recirculation flow pattern and again fluctuation maystart increasing.
V. CONCLUSION
Present work has been undertaken to examine the effect of increasing solid bed height on the fluctuation ratio. In fluidizing bed fluctuation of bed is most undesirable situation. In certain cases, solids move out from the fluidizer also. Further, fluctuation also reduces the heat and mass transfer operations in the bed. For the selected range of experimentations, it is now possible to take control on the fluctuation. It has also been suggested that for more fluctuating fluidized beds different liquids can be used to restrict the fluctuation.
RFERENCES
[1] The Expanded Bed. (1959). In Fluidization (pp. 104-105). McGraw-Hill Book Company.
[2] Epstein, N. (1981). Three-phase fluidization: Some knowledge gaps. The Canadian Journal of Chemical Engineering, 59(6), 649-657. doi:10.1002/cjce.545059060
[3] Fluidised Beds Under Pressure. Journal of Chemical Engineering of Japan, 14(2), 85-89. doi:https://doi.org/10.1252/jcej.14.8
[4] Biswal, K., Sahu, S., & Roy, G. (1982). Prediction of the fluctuation ratio for gas—solid fluidization of regular particles in a conical vessel. The Chemical Engineering Journal, 23(1), 97-99. doi:10.1016/0300-9467(82)85011-
1 1.1 1.2 1.3 1.4 1.5 1.6 1.7 1.8 1.9 2
0 10 20 30 40 50
F lu c tu ati o n r ati o
Flow rate in lpm
Initial static bed height 10 cm
Initial static bed height 20 cm
[5] Gabor, J. D., Cassulo, J. C., Fountain, D., &Bingle, J. D. (1984). AIChE annual meeting. Retrieved from https://inis.iaea.org/search/search.aspx?orig_q=RN:16030991
[6] Abraham, M., Khare, A. S., Sawant, S. B., & Joshi, J. B. (1992). Critical gas velocity for suspension of solid particles in three-phase bubble columns. Industrial & Engineering Chemistry Research, 31(4), 1136-1147. doi:10.1021/ie00004a024
[7] Sau, D., Mohanty, S., &Biswal, K. (2008). Correlations for critical fluidization velocity and maximum bed pressure drop for heterogeneous binary mixture of irregular particles in gas–solid tapered fluidized beds. Chemical Engineering and Processing: Process Intensification,47(12), 2386-2390. doi:10.1016/j.cep.2007.11.003
[8] Kumar, S., Arora, A., & Chandra, H. (2011). Experimental investigation of gas-solid fluidization of spherical food material. CSVTU Research Journal, 4(1), 113-116
[9] Dora, D., Panda, S., Mohanty, Y., & Roy, G. (2013). Hydrodynamics of gas–solid fluidization of a homogeneous ternary mixture in a conical bed: Prediction of bed expansion and bed fluctuation ratios. Particuology, 11(6), 681-688. doi:10.1016/j.partic.2013.02.00
[10] Kumar, S., Arora, A., & Chandra, H. (2015). Standardization of Measurement Process during Gas Fluidization of Solids in Stationary Liquid Using Gauge Repeatability and Reproducible Methodology. . . Global Journal of Multidisciplinary Studies, 4(6), 156-163. Retrieved from http://www.gjms.co.in/index.php/gjms2016/article/view/895
[11] Kumar, S., Arora, A., & Chandra, H. (2015). Experimental investigations on variation in particle size on pressure drop during gas fluidization of solids in stationary liquid. International Research Journal of Engineering and Technology (IRJET), 2(5), 883-886. Retrieved from https://www.irjet.net/archives/V2/i5/IRJET-V2I5150.pdf.
[12] Padhi, R., Dora, D., Mohanty, Y., Roy, G., &Sarangi, B. (2016). Prediction of bed pressure drop, fluctuation and expansion ratios for three-phase fluidization of ternary mixtures of dolomite in a conical conduit. Cogent Engineering, 3(1). doi:10.1080/23311916.2016.118182
![Fig. 2 Variation of fluctuation ratio with air flow rate for different solid bed heights [solid - stone, liquid - turpentine, dp= 2 mm, hl= 0.4 m]](https://thumb-us.123doks.com/thumbv2/123dok_us/8299626.853994/4.612.125.489.473.700/variation-fluctuation-ratio-different-heights-stone-liquid-turpentine.webp)
![Fig. 4 Variation of fluctuation ratio with air flow rate for different solid bed heights [solid - stone, liquid - water, dp= 2 mm, hl= 0.5 m]](https://thumb-us.123doks.com/thumbv2/123dok_us/8299626.853994/5.612.126.488.419.690/variation-fluctuation-ratio-different-heights-stone-liquid-water.webp)
![Fig. 6 Variation of fluctuation ratio with air flow rate for different solid bed heights [solid - coal, liquid - kerosene, dp= 2 mm, hl= 0.5 m]](https://thumb-us.123doks.com/thumbv2/123dok_us/8299626.853994/6.612.124.485.370.693/variation-fluctuation-ratio-different-solid-heights-liquid-kerosene.webp)
![Fig. 8 Variation of fluctuation ratio with air flow rate for different solid bed heights [solid - coal, liquid - turpentine, dp= 4 mm, hl= 0.6 m]](https://thumb-us.123doks.com/thumbv2/123dok_us/8299626.853994/7.612.124.487.374.684/variation-fluctuation-ratio-different-solid-heights-liquid-turpentine.webp)
![Fig. 10 Variation of fluctuation ratio with air flow rate for different solid bed heights [solid - stone, liquid - kerosene, dp= 6 mm, hl= 0.5 m]](https://thumb-us.123doks.com/thumbv2/123dok_us/8299626.853994/8.612.127.489.75.332/variation-fluctuation-ratio-different-heights-stone-liquid-kerosene.webp)
