Technology (IJRASET)
An Approach to Analyse Digital Mammogram
Using Statistical Parameters
P M Palkar1, Dr. Pankaj Agrawal2
Electronics Engineering , PBCOE,Nagpur,India Electronics and Communication Engineering, GHRAET Nagpur, India
Abstract: Mammography is one of the available method for early detection of suspicious masses, related to breast cancer. Analysis of different statistical features of mammograms can provide clues about the presence of early signs of suspicious mass/tumors.The presented image processing approach is support system to radiologist in detecting
masses/tumors in mammograms. The proposed approach is to preprocess the digital mammogram, detect and eliminate the pectorial muscle from the mammogram than extract the breast region and performs segmentation for mass detection. The segmented mass regions can be further classified as benign or malignant by extracting and analyzing the statistical parameters of the mass. The study reveals that the statistical parameters of the suspicious mass can be used for mammographic interpretation and to define the criteria of decision to distinguish a mammogram as benign or malignent.
Keywords: Breast cancer, Image processing, Mammogram, Statistical Parameters, Pre-processing, Segmentation.
I. INTRODUCTION
Cancer is a disease that causes cells in the body to change and grow out of control. It is uncontrolled multiplication of a group of cells in a particular location of the body . Mostly the cancer cells is a tumor and the cancer are named after the part of the body where the tumor originates . Breast cancer begins in breast tissue. In the recent years the incidence of breast cancer has increased significantly and deaths occurred due to it is a recognized world health problem. It is one of the leading causes of fatality, with approximately 1 out of 12 women affected by the disease during their lifetime. In India, breast cancer is the second most common cancer in females after lung cancers and the death rate of one in eight women has been reported due to breast cancer . Cancer is the result of normal cells developing mutations which make them grow too fast and uncontrollable. In the case of breast cancer, these grown cells are located in the breast tissue. Both the number of people getting breast cancer and the number of people killed by breast cancer are rising faster in the developing world than in developed nations.
The most effective way to reduce deaths caused by breast cancer is to detect and treat it early as there are chances of successful treatment. Currently, many imaging techniques for breast cancer detection are available and the mammogram is the most efficient system to detect abnormal masses recommended for breast cancer screening. Screening mammography, x-ray imaging of the breast, is currently the most effective tool for early detection of breast cancer. However, only mammography is not a perfect method. Detection of suspicious abnormalities is a repetitive and fatiguing task. For every thousand cases analyzed by a radiologist, only 3 to are cancerous and thus an abnormality may be overlooked. Computer-Aided Detection (CADe) systems have been developed to aid radiologists in detecting mammographic lesions that may indicate the presence of breast cancer. These systems act only as a second reader and the final decision is made by the radiologist. Some studies have shown that CADe systems, when used as an aid, have improved radiologists’ accuracy for detecting breast cancer.
Technology (IJRASET)
The objective of this paper is to present an effective image pre-processing method for detection of masses in digitized mammograms. Pre-processing techniques are implemented using MATLAB. It is preliminary stage used in mammogram image enhancement. The method removes and deletes unwanted signs present in the background of the mammogram and to extract the breast area. It suppresses the undue influence from the background of the mammogram. Then an enhancement process is applied to improve appearance and increase the contrast of images and to eliminate noise. Once the breast region has been found, a segmentation phase is performed for detection of various types of masses in mammograms [9].Then Statistical features are extracted ,which can play very important role in classifying tumor or suspicious masses of mammograms as benign or malignent.
II. PREPROCESSINGOFDIGITALMAMMOGRAM
Digital mammograms are medical images that are difficult to be interpreted, thus a preparation phase is needed in order to improve the image quality and make the segmentation results more accurate. The main objective of Mammogram pre-processing is to improve the image quality and to make it ready to further processing i.e. for segmentation and feature extraction [6]. The types of noise observed in mammogram are high intensity rectangular label, low intensity label, tape artifacts etc [8]. The types of noises present in mammogram are represented in Fig 1.To detect and remove these noises, preprocessing of mammogram is needed.
Fig 1 Mammogram with various noises
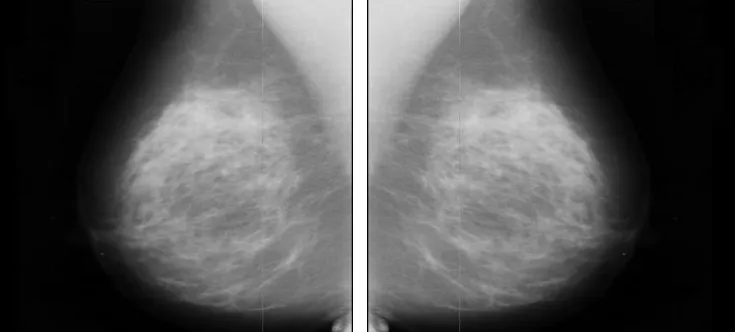
In our proposed method, we are using MIAS's database images [9]. This database includes both right and left breast i.e. in the other way breast image in some image is put in the right side and in the other images in the left side. To make processing easier we put whole the breast image to the left side of the image. To do this work, first we should find the breast direction. First we divide the image to two halves in vertical axis then we calculate the grey level of threshold limit of each two image halves. Surely the threshold limit under the image which the breast is in it, is more than the under of the other image which is the background. In our proposed work, we considered only left sided mammogram. So if we encounter any right sided mammogram, flip them in horizontal direction. In figure 2 there is an example of changing direction.
[image:3.612.129.497.542.708.2]
Technology (IJRASET)
Then we deleted the unwanted signs,labels and noises of the image. For deleting these, we act as follow; first we performed median filtering. It is mainly used to reduce or eliminate noise present in the image. Median filter not only reduces the noise but also preserves useful information in the image [10]. A median filter is a nonlinear filter and is efficient in removing salt and pepper noise median tends to keep the sharpness of image edges while removing noise [11]. Then compared median filtered image with threshold intensity value of 32 to get processed digital mammogram image by doing following process [12]. From the binary objects
in the mammogram image, the regions with fewer than 50 pixels are removed in each image by using the bewareaopen function in
MATLAB. This process morphologically opens a binary image and removes all objects in the binary image, except the largest object (breast profile). This operation uses an 8-connected neighbourhood. Next, a morphological operation to reduce distortion and
remove isolated pixels (individual 1’s surrounded by 0’s) is applied to the binary images using the bwmorph function in MATLAB
with parameter ‘clean’.
Above steps checks all pixels in a binary image and sets a pixel to 1 if five or more pixels in its 3-by-3 neighbourhood are 1's, otherwise, it sets the pixel to 0. Upon getting binary image after removing all redundant parts, we used it as a mask and multiplied it with original gray scale image matrix to get gray scale image free from noises and labels as shown in Fig 3. In the figure we can observe that the processed mammogram is without any noise, signs and labels. All these unwanted sign and labels are detected and deleted from the background of the mammogram.
[image:4.612.121.506.275.420.2]
Fig. 3. Original and Processed Mammogram
III. PECTORIALMUSCLESDETECTIONANDELIMINATION
After preprocessing , we have to remove the redundant part of the image. The redundant parts are background parts which do not cover breast region are the right and left part of the image. The backgrounds are dark and their gray level are near zero and these gray level do not have any difference with each other, we can use the amount of bright points for recognizing these parts. Fig. 3 shows this reality. It is also important to detect the pectoral muscle. The pectoral muscle, slightly brighter compared to the rest of the breast tissue as shown in Fig 4, can appear in the mammogram. These regions must be removed before detecting the tumor cells so that mass detection can be done efficiently. Pectoral muscles lie on the left top corner of the left sided mammogram. We must detect the position of the pectoral muscles before removing it.
[image:4.612.231.393.551.703.2]Technology (IJRASET)
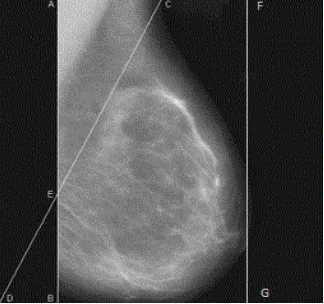
For detecting the pectoral muscle of the breast, we act as follow;At first, to get a straight line cut (AB), we traced image from left side and found first non-zero column between the left background of the mammogram and starting of actual part of breast image. In second step, is to determine middle point (C) at the top margin of the mammogram and plot a straight line (CD) from the middle point (C) to lower left corner point of the mammogram. The line CD cross the line AB at point E resulting an inverted right angle triangle (ACE) that is our region of interest (ROI) to detect the pectoral tissues from mammogram. Except the ROI rest part of mammogram is converted to background colour to make said ROI prominent. Finally to reduce the computational complexity inverted right angle triangle (ACE) is cropped from the original mammogram shown in above figure for further processing. Now the question will arise that in all the cases the said triangle will cover the entire region of pectoral muscle [13] or not.
[image:5.612.263.359.247.401.2]Next, to get straight line FG, we traced image from right side and found first non-zero column. In this way we successfully removed unwanted pectoral muscle and left hand, right hand black stripe from the image as shown in Fig 5. In the figure we can observe breast contour without pectorial muscle and side black stripes. This method gives absolute success ratio on 80 percent on different pairs of mammogram of different shapes and size [14].
Fig 5. Background and Pectoral Muscle Eliminated Mammogram
IV. DETECTIONOFMASSREGIONSINMAMMOGRAM
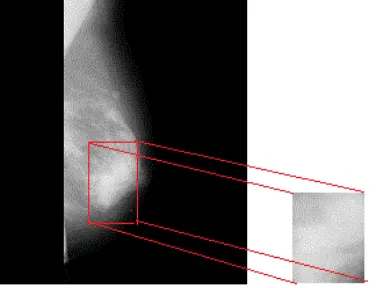
The mammogram carries the information in the form of different intensities and textural variations.Our approach is to isolate the spatially interconnected structures in the image to form regions concentrated around prominent intensities. Hence after getting interested breast contour as shown in above fig 5, we found brightest pixel to get threshold value for getting spicules. For removing some false spicules (fewer pixels) we filtered it out by doing morphological operation. Once getting intended spicules, we identified seed point and grown that dynamically to get mass region as shown in Fig 6. In the figure we observe that abnormal areas of density, mass, or calcification is easily detected and with respect to the size of mass, size of ROI is defined dynamically. This defined dynamic ROI of digital mammogram is used to extract the statistical features to detect the breast cancer.
Fig 6. Detection of Mass Region in Digital Mammograms
[image:5.612.219.408.534.678.2]Technology (IJRASET)
methods will be preferentially used [15].Statistical approach texture is a quantitative measure of the arrangement of intensities in a region. It is easier to compute and is used more often in practice.Statistics that describe a texture can be computed from the gray tones (or colors) themselves. This approach is less intuitive, but is computationally efficient and can work well for classification of textures. Many features have been extracted for the abnormalities of mammograms. The extraction methods of texture feature play very important role in detecting abnormalities of mammograms because of the nature of mammograms. Texture features have been proven to be useful in differentiating masses and normal breast tissues. Texture features are able to isolate normal and abnormal lesion with masses and microcalcification.The features that we have extracted are: kurtosis, mean, median,variance, skewness,standard deviation and entropy. Kurtosis is a measure of whether the data are peaked or flat relative to a normal distribution. That is, data sets with high kurtosis is tend to have a distinct peak near the mean, decline rather rapidly, and have heavy tails. Data sets with low kurtosis tend to have a flat top near the mean rather than a sharp peak. A uniform distribution would be the extreme case. Skewness is a measure of symmetry, or more precisely, the lack of symmetry. A distribution, or data set, is symmetric if it looks the same to the left and right of the center point. In probability theory and statistics, variance measures how far a set of numbers is spread out. A variance of zero indicates that all the values are identical. Variance is always non -negative: a small variance indicates that the data points tend to be very close to the mean (expected value) and hence to each other, while a high variance indicates that the data points are very spread out around the mean and from each other. An equivalent measure is the square root of the variance, called the standard deviation. The standard deviation has the same dimension as the data, and hence is comparable to deviations from the mean. The statistical evaluation of randomness
which characterizes the texture features in mammogram image is said to be entropy
VI. RESULTSANDDISCUSSION
Experimental results shows that the pre-processing stage effectively change the direction of Mammogram, do median filtering and remove unwanted objects and texts ,detect and supress the pectoral muscle of mammogram. The results obtained over MIAS database have shown good results. The segmentation results show that our approach to automatically detect the seed point and dynamically grow to determine the ROI in mammograms is promising and the results show that the proposed algorithm achieved 90% true result. The values of statistical features of all the set of pre-diagnosed mammogram images from MIAS database,has to be constructed in the appropriate format, so that the classifier of neural network or any other method can understand and can be effectively trained. The preliminary results showed that the statistical features of the mass are different for benign and malignant cases.
VII. CONCLUSION
The presented approach can be successfully used to detect the suspicious mass of a digital mammogram and to characterize the mass region based on calculation of statistical parameters. Investigation of the preliminary results obtained reveals that statistical parameters distinguish between benign and malignent. Thereafter, these parameters could be used to define criteria of decision that will permit to distinguish a mammogram as benign or malignent.This presented approach can acts as an supporting tool to radiologists in detecting masses/tumors in mammograms.
This approach has potential for further development because the accuracy of the classification depends upon the efficiency of the training to the neural network and the number of mammogram images used for training the neural network or any other method. One of the way to improve the efficiency is to extract more statistical and textural parameters from the ROI.
REFERENCES
[1] Karthikeyan Ganesan, U. Rajendra Acharya, Chua Kuang Chua, Lim Choo Min, K. Thomas Abraham, and Kwan-Hoong Ng: Computer-Aided Breast Cancer Detection Using Mammograms: A Review .Methodological Review IEEE REVIEWS IN BIOMEDICAL ENGINEERING, VOL. 6, 2013
[2] Indra K Maitra, Sanjay Nag,Prof. Samir K Banyopadhyay :Identification of Abnormal Masses in Digital Mammography Images , International Journal of Computer Graphics ,Vol. 2,No. 1 May, 2011.
[3] Sara Dehghani , Mashallah Abbasi Dezfooli :A Method For Improve Preprocessing Images Mammography, International Journal of Information and Education Technology, Vol. 1, No. 1, April 2011.
[4] U. Bick, F. Diekmann:Digital mammography, Springer, Berlin, 2009.
[5] H. Gholam:Registration of vibro-acoustography images and x ray mammography,Proceeding IEEE, 2005.
[6] D.Narain Ponraj, M.Evangelin Jenifer: A Survey on the Preprocessing Techniques of Mammogram for the Detection of Breast Cancer, Journal of Emerging Trends in Computing and Information Sciences, Vol. 2, No. 12, December 2011.
[7] Sharanya Padmanabhan and Raj i Sundararajan :Enhanced Accuracy of Breast Cancer Detection in Digital Mammograms using Wavelet Analysis , fN 47907, USA 978-1-4673-2322-2112/$31.00, 2012 IEEE
Technology (IJRASET)
0975–3087 & E-ISSN: 0975–9115 , Volume 4, Issue 1, 2012, pp.-241-244[9] Samir Kumar Bandyopadhyay: Detection of Abnormal Masses in Mammogram Images, International Journal of Computer Science and Information Technologies, Vol. 1 (5) , 2010.
[10] J. Sharma, J. K. Rai and R. P. Tewari: Identification of pre-processing technique for enhancement of mammogram images, 2014 International Conference on Medical Imaging, m-Health and Emerging Communication Systems (MedCom), Greater Noida, pp. 115-119, 2014.
[11] R. Ramani, Dr. N.Suthanthira Vanitha: The Pre-Processing Techniques for Breast Cancer Detection in Mammography Images, MECS (http://www.mecs-press.org/), 5, 47-54, April 2013.
[12] J. Nagi, S. Abdul Kareem, F. Nagi and S. Khaleel Ahmed: Automated breast profile segmentation for ROI detection using digital mammograms," 2010 IEEE EMBS Conference on Biomedical Engineering and Sciences (IECBES), Kuala Lumpur, 2010, pp. 87-92.
[13] Prof. Samir Kumar Bandyopadhyay: Pre-processing of Mammogram Images, International Journal of Engineering Science and Technology, Vol. 2(11), 2010.
[14] Pravin Palkar, Dr Pankaj Agrawal: Preprocessing of Mammograms for Computer-Aided Diagnosis of Breast Cancer
International Journal of Modern Computer Science (IJMCS),Volume 4, Issue 5,, ISSN: 2320-7868 (Online), October, 2016