Technology (IJRASET)
Time Series Analysis of Glacial Lake in Western
Himalayas Based on NDWI and MNDWI
Neeraj Kaushal1, Kamal Kumar2
Water Resources Department, PEC University of Technology, Chandigarh, India
Abstract— This Water always appears diversely, which makes its extraction not so simple. In this paper, we propose a new, simple, fast and accurate methodology based on a combination of the two indices NDWI and MNDWI for calculating lake area and analyzing the change using Landsat data. The water indices are designed to highlight inland water bodies in remotely sensed imagery. The water information by NDWI always mixed with built-up land noise and thus the area of a water body was overestimated. MNDWI could significantly highlight the water information, as it can easily distinguish shadow and water body and solve the problem to eliminate shadow in extracting water information. The application of these indices for water body mapping is mainly based on the thresholding method to separate water from non water areas especially in the context of determining the lake area.. A subpixel approach is then applied to the eliminate the problems of mixes pixels to enhance the results.
Keywords— Remote Sensing, Glacial Lakes, Water Indices, NDWI, MNDWI
I. INTRODUCTION
The average surface temperature on the Earth’s surface have been continuously increasing since the end of the Ice Age and has increased between 0.3ºC to 0.6ºC over the past hundred years [1]. This continuous change in temperature has lead to various changes in the Earth’s glaciological environment. Basically the melting of glacial ice has also been found to increase quite rapidly since the modern men have started to pollute the natural resources abundantly and frequently. This ice melt results in the formation of large number of high altitude glacial lakes which can cause real big problems if not countered. Generally a Glacial lake is defined as water mass existing in a sufficient amount and extending with a free surface in, under, beside, and/or in front of a glacier and originating from glacier activities and/or retreating processes of a glacier [2]. Outside the polar region, the Himalayas have the largest concentration of glaciers. Most of the Himalayan glaciers have retreated in recent past, leaving behind large number of glacial lakes. The Himalayan region itself contains hundreds of lakes varying from low elevation to the high elevation. Out of these many of the lakes of Himalaya are fresh water lakes, with or without inflow and outflow.
Water surface areas can be derived using optical and radar imagery by adopting several methods, such as single band method , classification , density slicing , spectral analysis and bands ratio methods . Many supervised and unsupervised classification for lake identification has been carried out by the researchers. Reference [2,3] attempted the automatic classification of glacial lakes using ASTER data , but the algorithm was not robust enough to be applied to other images except ASTER images. Reference [10] used LANDSAT images and suggested that the NDWI takes the advantage of the low water reflectance in the NIR band and high reflectance in blue band to classify glacial lakes. However, it was observed that glacial lakes get misclassified as shadow area using this method. Other problems in identifying the lakes are frozen, semi frozen lakes and misclassification due to cloud shadow. RADAR data can be used to avoid this problem as it penetrates cloud. Using RADAR image of melt condition, cloud shadow and frozen lakes problem gets easily eliminated. Other studies mentioned manual delineation of the glacial lakes using DEM on the basis of image interpretation technique such as tone, texture and association to avoid misclassification .
Technology (IJRASET)
II. METHODSANDDATAPROCESSING
A. Study Site
Suraj Tal is 65 km from Keylong, the district headquarters of the Lahaul-Spiti district. The lake is situated in the Upper Himalayan Zone or High Latitudinal Zone part of the Himalayas which has less population with climatic conditions similar to polar conditions. The elevation of the lake above sea level is 4,883 m, and the location is below the summit of the Baralacha Pass in the Lahaul division of district Lahaul and Spiti. The lake lies between 32°45’N 77°24’E to 32.75°N77°54’E. The lake is fed from the glaciers and nullahs (streams) originating from the Bara-lachala pass. It is the main source of water for Bhaga river which converge to form Chenab. The area of the lake greatly varies with the fluctuation of its water level. The water level rises at flood season and then the water surface suddenly expands. And it drops when dry period comes.
B. Study Materials and Data preprocessin
We selected the LANDSAT (TM,ETM+,OLI-TIRS) images for15 cloud-free days when satellite passed over the Suraj Taal Lake for the pre monsoon and post monsoon seasons. Snow and cloud conditions are the most crucial selection criteria for the satellite scenes because snow cover hampers glacier mapping, clouds shroud the surface and inhibit classification of the ground and cloud shadows can be misclassified as lakes. Thus, for lake mapping as well as for glacier mapping cloud free scenes from the end of the ablation period are most favorable (Paul et al. 2002). Based on 1:70,000 topographic map for the year 2011 a ground-truth map was generated for validation purposes.
C. Methods
1) Tools for Semi Automatic Detection: Lakes in glacierized areas show a wide range of turbidity, ranging from light blue or green to almost black. The major influences are sediment influx, water depth, the properties of the lake bottom, and the origin of the lake water (Wessels et al. 2002). Due to these different spectral information of lakes, unsupervised classification methods cannot be used for automated lake mapping. Based on the normalized difference vegetation index (NDVI) (Hardy and Burgan 1999), (McFeeters et al. 1996) developed the normalized difference water index (NDWI). The normalized difference water index (NDWI) was modified by substitution of a middle infrared band such as Landsat TM band 5 for the near infrared band used in the NDWI.
NDWI = (GREEN - NIR) / (GREEN + NIR) MNDWI = (GREEN - SWIR)/(GREEN + SWIR)
Both these indices use two spectral bands with maximum reflectance differences for an object (water for both). These indices reduce commission errors during classification, due to vegetation and bare soil classes. More over proposing a Modified Normalized Difference Water Index (MNDWI) also minimize errors due to the presence of shadows. In order to develop a tool for semi-automatic lake classification, models were generated within the model maker of the Erdas imagine 9.1 Software (general . After the preprocessing of the satellite image TM bands 1 (blue), 4 (near infrared (NIR)) and 5 (short wave infrared (SWIR)) was imported into the Erdas imagine 9.1 as single 8bit raster layers. All the images were processed and area calculation was done using calculation tools within the Erdas imagine 9.1 software.
2) Tool for automatic lake detection: As the lake pixels became course due to low resolution of data and the detection of lake
shore line was difficult to analyze , a soft classification was adopted. The pixels representing the shoreline in the NDWI/MNDWI derived image would be a mixed pixel and thus the area would be over or under estimated. In order to encounter this mixed pixel problem a subpixel approach namely Fuzzy Cluster Means was done in ERDAX IMAGINE 9.2. The flowchart below explains the methodology.
Technology (IJRASET)
Fig 1 : Flow chart for automatic lake detection.
III.RESULTSANDDISCUSSIONS
[image:4.612.211.481.85.242.2]The MNDWI and NDWI images of the subscene both clearly show open water features as the result of enhancement. Nevertheless, visual inspection can find that the built-up lands also present in the NDWI image in a medium grey tone suggesting having a positive brightness value. These built-up lands can be seen as noise mixed with water features. However, the built-up lands in the MNDWI image take a black tone and have a large contrast with the water features suggesting that the noise is notably suppressed or even removed.
TABLE 1 lists the statistical results of the subscene. The most noticeable characteristic is that the lake area show a large amount of change during the periods ranging from pre monsoon to post monsoon. Moreover built-up land in the NDWI image has a positive mean value This is because it reflects more green light than NIR light, just as water does. To avoid this a threshold value of zero was further applied to extract water features from both the NDWI and MNDWI images (HANQIU XU 2006). The extracted water information from the MNDWI achieves an overall accuracy of 92.85% and a Kappa value of 0.9227 because no built-up land patches were mixed with enhanced water features.
TABLEI: LAKE AREA CALCULATED USING INDICES
Year Month Area- NDWI Area- NDWI(Threshold) Area- MNDWI 1998 July 0.0573000 0.0414000 0.0463000
October 0.0123000 0.0195000 0.0069000 1999 July 0.0639000 0.0428000 0.0610000 2000 October 0.0077000 0.0010000 0.0082000 2002 August 0.0274000 0.0217000 0.0290000 October 0.0235000 0.0233000 0.0117000 2009 October 0.0088000 0.0088000 0.0026000 2010 July 0.0627000 0.0255000 0.0043000 October 0.0228000 0.0136000 0.0108000 2011 October 0.0081000 0.0017000 0.0107000 2012 November 0.0047000 no results 0.0047000 2013 October 0.0036000 0.0028000 0.0018000 2014 October 0.0064000 0.0049000 0.0061000
Landsat (TM , ETM+) Data
Pre processing
Environmental correction correction
Signature derivation
[image:4.612.112.518.440.717.2]Technology (IJRASET)
Fig 2 : Comparison of Results
A B C
D E F
Technology (IJRASET)
J K L
[image:6.612.54.554.72.337.2]M N
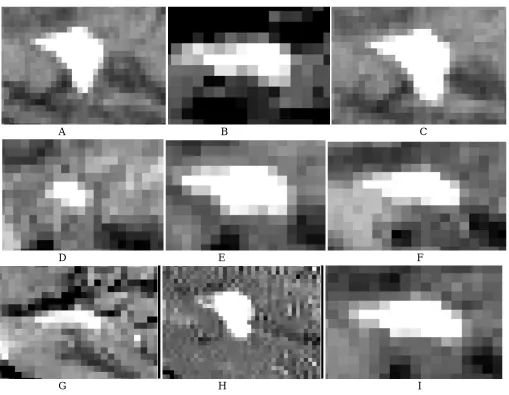
Fig 3: NWDI Images of A- July 98, B - Oct 98, C- July99, D- Oct 2000, E- Aug 2002, F- Oct 2002,G- Oct 2009, H- Jul 2010, I – Oct 2010, J – Oct 2011, K – Oct 2012, L- Oct 2013, M- Jul 2014,N – Oct 2014
A B
[image:6.612.91.527.380.683.2]Technology (IJRASET)
TABLE II
LAKE AREA CALCULATED USING CLASSIFICATION
Year Area-
NDWI(Threshold)
Sub pixel
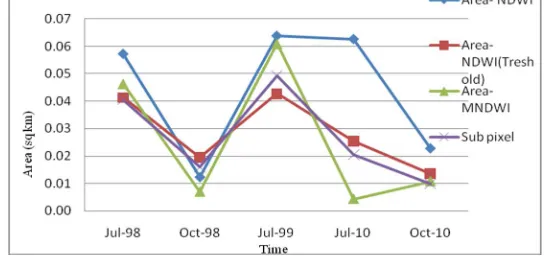
Jul-98 0.0414000 0.0406 Oct-98 0.0195000 0.0160000 Jul-99 0.0428000 0.0494 Jul-10 0.0255000 0.0206 Oct-10 0.0136000 0.0099
[image:7.612.175.453.315.444.2]The underestimation of the water area is only 1.21%. However, the extracted water patches from the NDWI image were mixed with many built-up land patches with positive values. This results in the overestimation of the water area and a low accuracy of 77.25%. accuracy and Kappa value for the NDWI image but causes an underestimation of 21% of the water area .The results were compared to the existing topo maps available for the year 2011 and could be analysed that the area determined by using a threshold and a sub pixel approach approved to be more accurate as compared to the other methods used for determining the lake areas.
Fig 5 : Comparison between subpixel and indices in lake area determination
IV.CONCLUSIONS
From the spectral reflectance pattern of clouds and cloud shadows, it can be observed that few sample pixels have lower reflectance values in NIR and SWIR bands compared to the green band. This implies that these pixels would be also be categorized as water, if the standard indexes such as NDWI/MNDWI were used so to remove this the sub pixel approach was used an enhanced area was calculated. Further, it is also clear from spectral plots of cloud that most of the cloud pixels have
higher reflectance in all the bands and get eliminated by the brightness threshold limits. The cloud shadow has higher NDWI and thus can lead to an error in measuring area. To avoid this the threshold should be selected in such a way that the error to reduce the lake area should be minimized.
REFERENCES
[1] ICIMOD, “Impact of climate change on Himalayan Glaciers and Glacial Lakes: Case studies on GLOF and Associated Hazards in Nepal and Bhutan,”
International Centre for Integrated Mountain Development(ICIMOD) ,2007.
[2] ICIMOD, “Formation of Glacial Lakes in the Hindu Kush-Himalayas and GLOF Risk Assessment. International Centre for Integrated Mountain
Development,” ICIMOD, 2010.
[3] S.K. McFeeters, “Using the normalized difference water index (NDWI) within a geographic information system to detect swimming pools for mosquito
abatement: A practical approach,” Remote Sens., 5, 3544–3561, 2013.
[4] S.K. McFeeters, “The use of the normalized difference water index (NDWI) in the delineation of open water features,” Int. J. Remote Sens., 17, 1425–1432,
1996.
[5] F. Sun, W. Sun, J. Chen, P. Gong, “Comparison and improvement of methods for identifying waterbodies in remotely sensed imagery,” Int. J. Remote Sens.,
33, 6854–6875, 2012.
Technology (IJRASET)
3033, 2006.
[8] Z. Tang, W. Ou, Y. Dai, Y. Xin, “Extraction of water body based on Landsat TM5 imagery—A case study in the Yangtze river,” Adv. Inf. Comm. Technol.,
393, 416–420,2013.
[9] Hao Jiang; Min Feng; Yunqiang Zhu; Ning Lu; Jianxi Huang; Tong Xia. An Automated Method for Extracting Rivers and Lakes from Landsat Imagery.
Remote Sens. 2014, 6, 5067-5089
[10] Huggel, C., A. Kääb, W. Haeberli, P. Teysseire, and F. Paul. 2002. "Remote sensing basedassessment of hazards from glacier lake outbursts: a case study in the
Swiss Alps." NRC Research Press. doi: 10.1139/T01-099.