R E S E A R C H
Open Access
Evidence for GC-biased gene conversion as a
driver of between-lineage differences in avian
base composition
Claudia C Weber
1, Bastien Boussau
2, Jonathan Romiguier
3, Erich D Jarvis
4and Hans Ellegren
1*Abstract
Background:While effective population size (Ne) and life history traits such as generation time are known to impact substitution rates, their potential effects on base composition evolution are less well understood. GC content increases with decreasing body mass in mammals, consistent with recombination-associated GC biased gene conversion (gBGC) more strongly impacting these lineages. However, shifts in chromosomal architecture and recombination landscapes between species may complicate the interpretation of these results. In birds, interchromosomal rearrangements are rare and the recombination landscape is conserved, suggesting that this group is well suited to assess the impact of life history on base composition.
Results:Employing data from 45 newly and 3 previously sequenced avian genomes covering a broad range of taxa, we found that lineages with large populations and short generations exhibit higher GC content. The effect extends to both coding and non-coding sites, indicating that it is not due to selection on codon usage. Consistent with recombination driving base composition, GC content and heterogeneity were positively correlated with the rate of recombination. Moreover, we observed ongoing increases in GC in the majority of lineages.
Conclusions:Our results provide evidence that gBGC may drive patterns of nucleotide composition in avian genomes and are consistent with more effective gBGC in large populations and a greater number of meioses per unit time; that is, a shorter generation time. Thus, in accord with theoretical predictions, base composition evolution is substantially modulated by species life history.
Background
Life history traits (LHTs) and, by extension, effective population size (Ne) have long been connected to patterns of sequence evolution. Lower body mass and shorter gen-eration time predict rapid molecular evolution [1-5], while small-bodied animals with putatively large populations tend to show overall decreases in the dN/dS ratio [6,7], reflecting variation in both substitution rates and selection efficiency between lineages. Meanwhile, the connection between population size, generation time, and base composition is less well understood. In principle, any life history-related trait affecting substitution patterns should also impact on the evolution and the dynamics of base composition. GC-biased gene conversion (gBGC)
associated with meiotic recombination leads to the pref-erential fixation of GC in AT/GC heterozygotes and is a major determinant of base composition. Direct
experi-mental evidence is currently limited to S. cerevisiae,
with a significant 1.3% excess of transmitted GC alleles thought to result from a bias in the mismatch repair machinery [8-11]. However, evidence for its effects is observed across a wide range of taxa [12-16], leading to a widespread association between GC content and cross-over rates [8,13,17-20].
Importantly, it has been suggested that LHTs predict how strong the effects of gBGC on compositional evolu-tion are [21]. Much as recombinaevolu-tion locally modulates Ne [22], Ne is in turn predicted to increase the efficacy of gBGC in the same manner that it increases the effi-cacy of selection. This is because GC alleles behave as though they were positively selected when their fixation is favored and the effect of drift will decrease with
* Correspondence:[email protected] 1
Department of Evolutionary Biology, Evolutionary Biology Centre, Uppsala University, Norbyvägen 18D, SE-752 36 Uppsala, Sweden
Full list of author information is available at the end of the article
increasing Ne [15,23]. Species with short generation times additionally experience a greater number of mei-oses per unit time, and therefore more frequent gBGC.
In agreement with this idea, Romiguier et al. [21]
observed that mammalian lineages show negative cor-relations between both body mass, expected to be negatively associated with Ne, and generation time and GC. Subsequent studies on mammals have reinforced these findings [24,25].
The interpretation of these results may however be complicated by differences in chromosomal architecture between species under comparison. Large-scale chromo-somal rearrangements may obscure the impact of LHTs on base composition by shifting the recombination land-scape [26,27]. Rodents, which exhibit weaker gBGC than primates despite having larger populations, are a striking example. This is thought to be a consequence of having lengthened chromosome arms and reduced crossover rates due to a shift to acrocentric centromeres [28]. Add-itional studies in different clades are therefore necessary to disentangle the effects of changes in the recombination map and changes in population size on GC content evolu-tion [25].
Here, we explore the idea that some of the caveats as-sociated with changes in chromosomal architecture might be avoided by studying birds. The avian karyotype comprises a large number of chromosomes (haploid count = 39 for chicken, typical for most birds) with a re-markably low rate of interchromosomal rearrangement between species [29-32]. For instance, despite a split time of 84 to 94 million years (My, reported in our com-panion phylogenomic study [33]), the karyotypes of chicken and zebra finch differ merely by one fission and one fusion event [34]. Accordingly, we expect the stabil-ity of the avian karyotype to translate to greater stabilstabil-ity in broad-scale recombination landscapes over time. This is empirically supported by a correlation in the rate of recombination in 1 Mb windows between homologous regions of chicken and zebra finch chromosomes [19].
Additionally, birds lack a functional copy of PRDM9
[35], which is expected to reduce shifts in the recombin-ation landscape associated with rapid hotspot turnover [36,37]. As a consequence, between-lineage variation in composition should be owing to differences in LHTs ra-ther than genome architecture. Meanwhile the effects of recombination on a given sequence will have remained consistent throughout its history, and are therefore ex-pected to leave clear signatures [36,38].
Avian genomes show considerable variation in chromo-some size, with the majority of chromochromo-somes being small micro-chromosomes. Given the requirement for at least one crossover per chromosome [39], this results in high crossover rates [40-42]. Signatures of gBGC ought to be most readily detected in lineages with more
fragmented karyotypes, that is, many small chromo-somes [16,24]. Indeed, the continuing reinforcement of intragenomic heterogeneity in GC content appears to be particularly pronounced in chicken [43], unlike in some mammals where erosion of GC-rich regions has oc-curred [15,21,28,44-46]; these studies have excluded CpG sites in the analyses so there is a remaining issue how such sites influence the evolution of base compos-ition. Finally, base composition varies greatly between different bird lineages [47].
Thus, birds have several features that make them espe-cially interesting for investigating the interactions between recombination, selection, base composition and substitu-tion rates. A recent effort that sequenced 45 whole bird genomes along with three previously published ones (48 total, see Additional file 1) covering all major avian orders now provides the opportunity to investigate these questions [48]. The availability of orthologous coding and intronic sequences from these species allows us to exam-ine trends that may be less apparent with fewer sequences or taxa. Here, we focus on the impact of between-lineage differences in effective population size and time-scaled recombination rates on base composition in birds, and test whether gBGC might explain the substantial vari-ation in GC content observed. We first ask whether there is a significant negative association between LHTs and GC content, and find this to be the case. We also test how robust this result is by employing alternative
proxies of Ne based on phylogenetic discord among
gene trees. We then consider the degree to which differ-ent classes of sites are affected, how it corresponds to recombination rate estimates, and whether the impact of gBGC on the base composition of avian genomes is ongoing.
Results
Correlation between GC3 and life history traits is consistent with stronger gBGC in large populations with short generation times
Given the substantial heterogeneity in GC3 content (the proportion of GC at third codon positions) between avian species [33,47] (Figure 1), we asked whether there is evi-dence that third codon sites, which should be the least constrained coding positions, might be subject to the in-fluence of recombination-associated gBGC. Species with smaller body mass are expected to have both shorter gen-eration times and larger effective population sizes, increas-ing both the number of meioses per unit time and the efficacy of gBGC [21,23]. If gBGC is a factor in determin-ing GC, small-bodied species ought then to have elevated GC. This is indeed what we observed, with species with greater body mass exhibiting lower GC3 than species with smaller body mass (Spearman’s rho = -0.5866,P= 6.2e-05,
Figure 1GC3 content varies substantially between different avian lineages.Total evidence nucleotide tree [33] showing differences in GC3 content between lineages. Ancestral GC3 was estimated by ML using contMap from R phytools for illustration. See Additional file 1 for species names.
[image:3.595.57.538.412.703.2]species for which data are available, maximum longevity (rho = -0.3645, P= 0.0616, n= 27) and age of first fe-male sexual maturity (rho = -0.5957,P= 0.0071,n= 19) showed similar trends, consistent with the possibility that short generation times lead to an increase in GC3 assuming equilibrium has not yet been reached. In the following we only examine body mass, as this maxi-mizes the number of species we can consider.
Nucleotide composition at both coding and non-coding sites is predicted by body mass
Selective constraint and mutational and neutral forces acting on base composition interact with each other and modulate to what extent the composition at a given class of site varies. In species with large effective population sizes, selection against weakly deleterious mutations is more efficient, which can lead to synonymous sites being constrained, for instance due to selection on transla-tional efficacy [49]. According to theory, this trend would be further exacerbated by locally increased Ne in regions of high recombination, owing to the increased efficacy of selection [22]. However, support for increased levels of codon usage bias in highly expressed genes is thus far absent in birds [50,51] and weak if at all present in mammals [51-55].
To nevertheless rule out the possibility that our findings can be accounted for by selection on synonymous sites, we assessed whether intronic sequences are similarly
negatively correlated with body mass and found this to be
the case (rho = -0.4411, P= 0.0038). Selection on mRNA
folding tends to be enhanced by high GC content and is thus suggested to constrain sequence evolution [56]. How-ever, as this is hypothesized to relate to translational effi-ciency [56,57] only mature mRNA structure is relevant. Thus, intronic GC content ought not to be subject to con-straint in this respect, and gBGC is a plausible explanation for the pattern observed.
As it is well-established that gBGC influences both synonymous and non-synonymous coding positions [58], we next tested whether the relationship between body mass and GC3 can be generalized to first and sec-ond codon positions. As expected, GC1 (rho = -0.5631,
P= 0.0001) and GC2 (rho = -0.5639, P= 0.0001) show
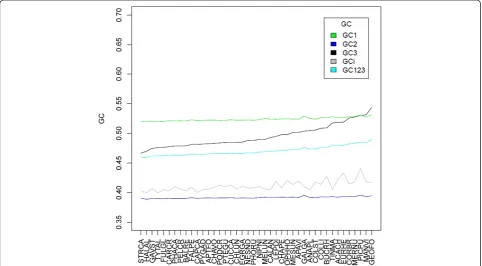
[image:4.595.57.540.439.705.2]significant negative correlations with body mass that are of a similar magnitude to that observed for GC3. However, as one would predict if first and second cod-ing positions are under stronger selective constraint than third positions, the range of GC values is substan-tially narrower (sd = 0.003 for GC1, sd = 0.0015 for GC2, sd = 0.0189 for GC3; see Figure 3). Owing to the structure of the genetic code, differences in GC2 between species ought to be associated with slight changes in amino acid usage between lineages. This is indeed ob-served (Additional file 2) and in agreement with previ-ous observations that amino acid usage correlates with base composition [59].
The fact that first, second, and third coding sites as well as intronic sites exhibit correlations with body mass is consistent with a pervasive influence of gBGC on base composition, while the strength of the effect on a given class of site appears to be modulated by the degree of se-lective constraint. These relationships are not explained by phylogenetic inertia, as controlling associations be-tween body mass and GC at different classes of sites for phylogeny did not render the correlations non-significant (Additional file 3).
Orthologs with high between-species GC heterogeneity show a stronger effect of gBGC on base composition
In addition to treating different classes of sites separ-ately, we can distinguish between orthologs that show high or low levels of compositional heterogeneity (that is, variance in GC) among species when addressing the relationship between gBGC and LHTs. Such heterogeneity is expected to be most pronounced in sequences that are differentially affected by recombination-associated GC fixation bias due to differences in generation time
and Ne; that is, sequences in highly recombining
re-gions. Conversely, sequences experiencing little recom-bination overall should be more homogenous between species. When only genes whose third sites do not strongly reject the homogenous TN93 + GAMMA model in favor of the non-stationary model of Galtier
and Gouy [60], hereafter referred to as ‘homogenous’
genes, were considered (n= 310) the correlation between body mass and GC3 became modestly weaker (rho = -0.4563,
P= 0.0026) than when considering ‘non-homogenous’
(n= 1,470) genes (rho = -0.5887,P= 5.7e-05).
The difference in the strength of the correlation is not owing to sample size, as none of 10,000 randomizations where 310 non-homogenous genes were randomly sam-pled gave a correlation between GC3 and body mass that was equal to or weaker (that is, less negative) than that observed for the homogenous set. However, given that both the standard deviation and mean of GC3 are lower for homogenous genes (sd = 0.0084, mean = 0.4565) than for non-homogenous genes (sd = 0.0201, mean = 0.4991), the smaller correlation coefficient is expected, particu-larly if a low and less heterogeneous GC3 is indicative of gBGC having a weaker influence on these sequences. That there is nevertheless a relationship between GC3 and body mass for homogenous genes, albeit with a shallower slope (see Figure 4), cautions against the assumption that gBGC has no influence at all where the homogenous model is not rejected.
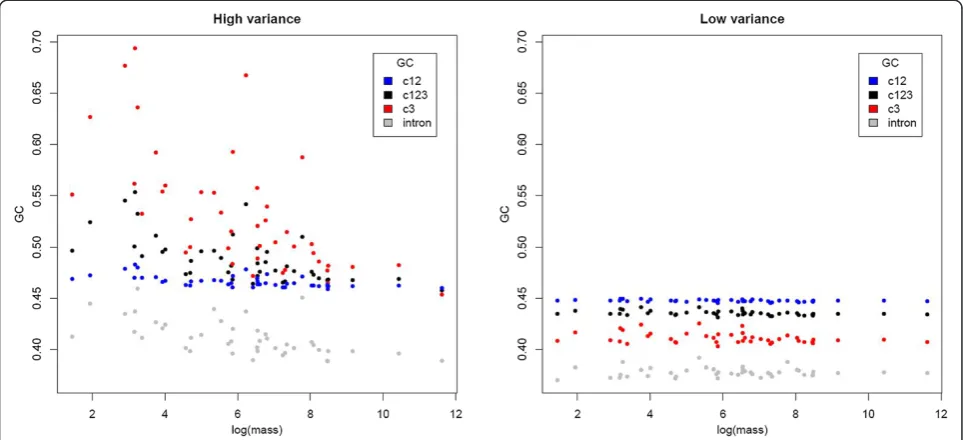
Additionally, we compared correlations between the 830 orthologs with the highest and lowest variance in GC3 [46], respectively, and obtained similar results. GC12 (rho = -0.6604,P= 2.8e-06), GC123 (rho = -0.6965,
P= 6.3e-07), and GC3 (rho = -0.7057, P= 4.4e-07) were
significantly negatively correlated with body mass for high-variance orthologs. The somewhat stronger correl-ation for GC3 is expected given the above definition of
‘high variance’. Low-variance orthologs showed a similar but weaker pattern. GC3 had the weakest correlation for the low-variance set (rho = -0.3138, P= 0.0409), as ex-pected given its reduced heterogeneity between species
(Figure 5). GC12 (rho = -0.3935,P= 0.0095) and GC123
(rho = -0.357, P= 0.0193) were somewhat more strongly
[image:5.595.56.541.496.715.2]correlated, but less so than for high-variance genes (Figure 5).
Introns associated with the high variance orthologs showed significant correlations between GC content and body mass (rho = -0.6451,P= 5.3e-06; Figure 5), whereas those associated with low-variance orthologs showed
no significant correlation (P= 0.4378). These trends
are consistent with base composition of introns of high-and low-variance genes evolving in a manner similar to the associated coding sequences, but with a weaker impact on the non-coding sequences.
High between-species variance is driven by GC evolution in small-bodied birds
In order to test if high GC3 variance orthologs were pro-duced by increases of GC3 in small-bodied species or decreases of GC3 in large-bodied species, we computed a time-corrected index of GC3 conservation for 19 pairs of species (following [61], see Materials and Methods). We again retrieved strong correlations with body mass when we considered this measure of GC3 dynamics in-stead of average GC3. GC3 conservation was higher between pairs of large-bodied species than pairs of small-bodied species (rho = 0.72,P= 8.2e-04; Figure 6) in agreement with predictions and with previous results in mammals [61]. GC-content heterogeneity between species is presumably due to increased gBGC in small-bodied spe-cies, whereas the GC-content of a gene tends to remain similar when evolving in large-bodied lineages.
GC correlates with multiple proxies of population size
While body mass is a convenient measure to consider in absence of data on actual effective population sizes,
correspondence between the two may not necessarily be strong in birds [62]. To ensure that our findings are ro-bust, we considered an additional approach. Shared ances-tral polymorphisms can lead to disagreement between gene and species trees for closely related lineages, particu-larly when Neis large. We may therefore estimate popula-tion size by using informapopula-tion on discordance between gene and species trees to compute coalescent-based in-ternal branch lengths representing ‘the quotient of the number of generations that elapsed between the more ancient divergence and the more recent divergence, and
the haploid population size N’ [63] (see Materials and
Methods).
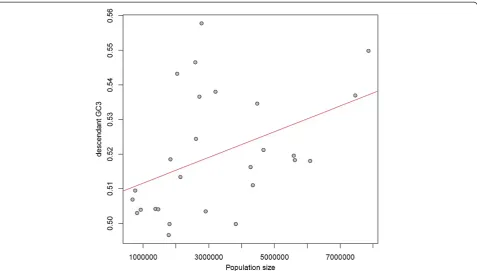
We examined correlations between the average GC3 for the descendants of a given branch and inferred popula-tion size for said branch. Only branches giving rise to two terminal branches were considered, as effective population sizes cannot be determined for terminal branches, and are unreliable for deeper branches, which tend to be very short in this data set. If large ancestral population size is predictive of higher GC in the descendants, we ex-pect a positive correlation between N and GC3. This is indeed what we observe regardless of the method of
branch length estimation (rho = 0.3041, P= 0.0856 for
our method; rho = 0.3471, P= 0.0522 for MP-EST).
[image:6.595.57.539.90.310.2]more robust (rho = 0.4963,P= 0.0092 for our method;
rho = 0.5233,P= 0.0048 for MP-EST; Figure 7). Similar
results were obtained when only branches where
boot-strap support values for the associated nodes are ≥50
were considered (rho = 0.5583, P= 0.0064). Given the
long time period that has elapsed since the putative ancestral populations were alive, descendant GC3 may not adequately reflect their base composition. We therefore also examined the correlation between the mean of the reconstructed equilibrium GC (GC3*) values at both ends of a given branch and N, which yielded a similar positive correlation (rho = 0.4726,
P= 0.0277 for branches with coalescent length ≥0.1
and bootstrap ≥50).
The Coevol approach [64], which we used to estimate ancestral generation time for the above calculations and which makes use of associations between substitution patterns and life history traits (see Materials and Methods), also allows correlations between trait data and base composition through time to be examined. Results for 10 concatenated alignment blocks were qualitatively consistent with the above, namely a negative correlation between age of first female sexual maturity (used to ap-proximate generation time) and GC, although not all reconstructions reached significant posterior probabil-ities (Additional file 4).
Recombination rates in chicken and zebra finch correlate with heterogeneity in GC
The above results indicate that base composition is ro-bustly associated with life history traits, and presumably population size, in agreement with the idea that the im-pact of gBGC is most pronounced in species with high
Ne and short generation times. However, to establish a
crossover-related process as a driver of between-species variation in GC content, we need to assess how com-positional differences between lineages relate to meiotic recombination. If gBGC is a major driver of base com-position, GC should be overall higher in regions of high recombination, which has indeed been established in multiple species [8,13,17-20]. In these regions, we might also expect GC to increase more rapidly in species where recombination occurs more frequently per unit time than in those with long generation times, resulting in greater heterogeneity between orthologs of the same sequence. It has recently been suggested that the avian ancestor was large compared to extant species [7], per-haps indicative of a lower baseline GC content. However,
even if the ancestral genome was not GC-poor, high Ne
[image:7.595.58.540.88.353.2]Ne. Under both scenarios, composition will be heteroge-neous between species in highly recombining regions, while composition in regions of low recombination should be dominated by other forces such as mutation bias.
The absence of recombination maps for the majority of the 48 bird species limits our ability to test whether sequences located in regions of relatively high recom-bination show more pronounced between-species het-erogeneity in GC content. We can, however, consider recombination maps from chicken [20] and zebra finch [19], two distantly related lineages, across 1 Mb windows and test for a relationship between standard deviation in
GC3 and crossover rate. In accord with recombination driving increased heterogeneity in GC3, we find that both chicken and zebra finch recombination rates show a posi-tive relationship with the between-species standard devi-ation in GC3 for each of 1,780 orthologs found across all species (Table 1). This cannot simply be owing to the
mean and variance being coupled, which we have no a
priorireason to expect, as regions where AT is high will have reduced rather than increased heterogeneity in AT between species.
[image:8.595.60.538.88.359.2]As a consequence of the correlation between recom-bination and variance in GC, the orthologs from the Figure 7Ancestral population size predicts descendant GC3.Reconstructed population sizes for internal branches with two descendant lineages are positively correlated with descendant GC3 content. Population size was inferred from relationships between ancestral generation time, split dates, and coalescent branch lengths computed from the degree of gene tree discordance. Note that the population sizes here are expected to be overestimates, as age of first female sexual maturity was used as a proxy for generation time (see Materials and Methods), and are intended to be interpreted in terms of rank order.
Table 1 Correlations between standard deviation in GC and median GC and recombination
Correlation with recombination Standard deviation of GC Mean GC
Chicken
GC3 rho = 0.2432 P= 2.3e-09 rho = 0.3283 P= 3.0e-16
GC3‘homogenous’ rho = 0.2136 P= 0.0016 rho = 0.2665 P= 7.6e-05
GC i rho = 0.2371 P= 2.0e-05 rho = 0.3761 P= 4.4e-12
Zebra finch
GC3 rho = 0.2915 P= 4.7e-11 rho = 0.2689 P= 1.4e-09
GC3‘homogenous’ rho = 0.2009 P= 0.0054 rho = 0.2027 P= 0.005
GC i rho = 0.1663 P= 0.0121 rho = 0.3636 P= 1.6e-08
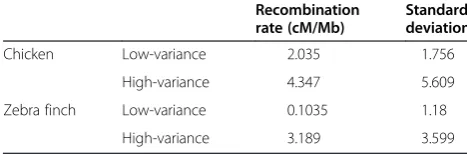
[image:8.595.56.541.599.724.2]previously considered high-variance gene set showed higher recombination and variance in recombination in chicken and zebra finch than the low-variance gene set (Wilcoxon test for median rate <2.2e-16; see
Table 2). Considering only ‘homogenous’ orthologs
yielded similar but modestly weaker correlations (see Table 1), consistent with our above observation that the association between body mass and GC3 extends to these loci. Moreover, intronic GC content and standard deviation also correlated positively with re-combination rates (see Table 1).
Chicken and zebra finch recombination rates for 1 Mb windows overlapping the 1,780 orthologs were positively correlated (rho = 0.3846,P<2.2e-16), indicating a degree of conservation of recombination rates for our set in line with previously reported estimates [19]. As there is no perfect correspondence between rates, the above correla-tions are likely to be weaker than if we were able to in-clude only loci whose recombination rates have remained constant across all species. For instance, if a previously highly recombining sequence moved to a region of low re-combination and experienced amelioration of GC, the strength of the relationship between chicken chromo-somal location and heterogeneity would be reduced. There is indeed evidence that chromosomal inversions are associated with altered recombination rates [26,27].
Chromosome size predicts GC content and heterogeneity
As interchromosomal rearrangements are rare in birds, we can further employ chromosomal class as a proxy for
‘very broad scale’ recombination rates. Given the
re-quirement for at least one crossover per chromosome [39], small chromosomes have higher recombination rates [19,20,41]. Therefore higher heterogeneity in GC3 compared to larger chromosomes is expected, along with the higher median GC3. Indeed, orthologs on the smaller chicken chromosomes 10-32 showed a higher median standard deviation in GC3 than the larger chro-mosomes 1-9 (see Table 3). Zebra finch exhibits the same pattern, which is not surprising given the high de-gree of karyotypic conservation. Similar results were ob-tained for intronic GC content, with both the chicken
and zebra finch median and standard deviation for GCi
being higher for orthologs on small chromosomes (Table 3).
Avian base composition is not at equilibrium
Previous work on birds has shown that GC content is increasing in a subset of avian lineages [43,47], coincid-ing with a reinforcement of isochore structure, whereas in other lineages GC has declined. In mammals it was originally assumed that GC was becoming eroded and homogenized based on observations in rodents and pri-mates. A more comprehensive analysis including add-itional species showed that these examples were in fact exceptions [21]. We therefore ask whether there is evi-dence for a general trend in GC evolution across all major avian orders. This is typically done by examining
the relationship between weak (W: GC→AT) and
strong (S: AT→GC) substitutions. Calculating (W→S)/
(W→S + S→W) for summed substitution counts
ob-tained by mapping W→S and S→W counts onto the
branches of the avian tree using mapNH and a homogenous T92 model yields an approximate GC3* value for each species [66]. This estimate represents the GC3 composition that would be expected for an in-finitely long branch.
At equilibrium, we would expect GC3 and GC3* to be approximately equal. However, in the majority of cases we observed that GC3* was in fact greater than current GC3, with the slope between the two measures being 2.85 (Figure 8), indicating that GC has increased [43]. These equilibrium frequencies should be interpreted with a degree of caution, as they are based on observa-tions of substituobserva-tions along branches of finite length and changes in base composition will ultimately lead to a shift in the balance of forces acting on a sequence. The
effect of distorted segregation favoring W→S changes
on composition ought to become less pronounced as the frequency of unfixed GC variants declines, while the
proportion of targets susceptible to C→T transitions
increases. Very high GC contents could in principle also be selected against in certain sequence contexts in suffi-ciently large populations, as GC content is a major pre-dictor of nucleosome occupancy and therefore DNA accessibility (see, for example, [67]). As such, the notion
that high Ne will accelerate gBGC [23] may not hold in
[image:9.595.55.289.656.733.2]all scenarios. Given that we do not control for the effects of CpG hypermutability on substitutions in our model, it is possible that we overestimate the true equilibrium frequencies here to an extent. Nevertheless, our data provide evidence that, if anything, GC3 has undergone recent increases in most species surveyed. The overall trend for GC3* to be higher than current GC3 is consist-ent with the idea that, on average, bird body masses have decreased throughout their evolution [7].
Table 2 Recombination rates differ between high- and low-variance orthologs
Recombination rate (cM/Mb)
Standard deviation
Chicken Low-variance 2.035 1.756
High-variance 4.347 5.609
Zebra finch Low-variance 0.1035 1.18
Although we cannot conclusively rule out the possibil-ity that the equilibrium GC frequencies we estimated are greater than the frequencies that would be reached in the future given sufficient time and constant population sizes, past work on primates has shown that a model where the efficiency of gBGC depends on recombination and effective population size fits the observed data well [14]. The primate results also suggest that the time re-quired to halve the difference between current and equi-librium composition is of the order of hundreds of millions of years outside of hotspot regions [14]. If we assume a range of 100,000 to 1,000,000 for avian effect-ive population sizes, we can demonstrate using a model similar to that of Duret and Arndt [14] that the number of generations required to halve the difference between GC3* and GC is large - between 124,218,180 and 565,739,002 generations - relative to the time scales we investigate here (see Additional file 5). We might there-fore plausibly expect GC3* to exceed current GC3.
Discussion
Multiple lines of circumstantial evidence described in this study support a role for recombination-associated gBGC in shaping avian base composition. First, lineages
with putatively higher Ne and shorter generation times
[image:10.595.55.542.112.181.2]show increased GC content at all classes of sites we ex-amined (coding and non-coding), as well as greater het-erogeneity in GC3. In addition to life history traits, estimated ancestral population size is a predictor of GC content. These results are consistent with both the ef-fects of a greater number of recombination events oc-curring per unit time and gBGC being more efficient in large populations [23], and accord with previous reports from mammals [21]. That non-coding sites are also af-fected argues against the effect being explained by selec-tion on coding sequences. On the other hand, the impact of gBGC is pervasive and appears strong enough to drive some modest differences in amino acid usage between lineages, and extends to loci with low heterogeneity Table 3 Median and standard deviation (sd) of GC for orthologs to chicken and zebra finch genes located on large (chromosomes 1-9) and small chromosomes (chromosome 10-) for third codon position and introns
GC small chrom. GC large chrom. Wilcoxon test sd GC small sd GC large Wilcoxon test
Chicken third sites 0.495 0.458 P= 2.0e-11 0.0457 0.0349 P<2.2e-16
Chicken intronic 0.493 0.449 P= 0.0020 0.0432 0.0353 P= 6.7e-07
Zebra finch third sites 0.497 0.457 P= 1.5e-13 0.0456 0.0348 P<2.2e-16
Zebra finch intronic 0.500 0.447 P= 0.00038 0.0418 0.0352 P= 4.3e-05
[image:10.595.60.540.440.703.2]in GC content. The positive correlation in both chicken and zebra finch between recombination and heterogen-eity in GC3 as well as median GC3 is consistent with a recombination-associated process increasing GC con-tent. We find that the process appears to be ongoing, with equilibrium GC composition being higher than present composition for the majority of species surveyed.
Interestingly, the ostrich, Struthio camelus, shows no
evidence of increasing GC content (GC3* = 0.4645; GC3 = 0.4666). A reduction in GC relative to the ancestral
state has previously been described in emus, Dromaius
novaehollandiae [47]. Meanwhile, the great tinamou,
Tinamus major, although closely related to both the emu and ostrich, shows a particularly high GC3*. In fact, os-trich has recently been shown to be outgroup to tinamou and emu [68], further indicating that phylogeny does not account for our observations (Additional file 3). Work on primates shows that the gBGC model fits the observed equilibrium frequencies well [14]. Nevertheless, future work will be required to address the extent to which selection opposing very high GC content or CpG methylation might affect equilibrium composition in coding sequences.
The counterintuitive observation that the range of in-tronic GC appears to be somewhat more restricted than GC3 (sd = 0.0189 for GCi) may be explained by selection on intronic nucleotide composition to facilitate correct intron recognition by the splicing machinery [69,70]. Repeat-masking intronic sequences had a negligible effect on overall intronic GC content (data not shown), indicat-ing that transposable elements do not play an important role in intronic nucleotide composition in birds as op-posed to mammals [71]. Alternatively, the weaker effect in introns could be due to a tendency for GC-rich introns to be deleted. Recombination is associated with genome con-traction [72] and constraint to maintain intronic sequence is expected to be weaker than for coding sequences with introns having an overall deletion bias [73].
Despite our comprehensive data set across the avian phylogeny and the advantages of the avian system, we acknowledge that some caveats remain. Given that we likely underestimate both generation times and coales-cent branch lengths, our reconstructions of population size are imperfect and expected to be larger than the true ancestral population sizes (see Materials and Methods). However, our main objective was to capture the ranks of the ancestral population sizes relative to one another in order to draw conclusions about their relationship with base composition.
At present, the absence of recombination rate data for the majority of our study taxa, as well as the lack of knowledge of historical rates, limits our ability to draw firm conclusions about fine-scale changes in recombin-ation landscapes over time and how this may impact the
patterns of base composition we observe. Sex-specific rates might also be expected to give different results in some study organisms. The impact of male recombin-ation on signatures of gBGC is stronger than for female recombination in mammals [14,28,74-76], possibly owing to interactions between replication-associated mutation patterns and crossover [77]. However, no such difference between the effects of male and female recombination on nucleotide composition is reported in chicken [78], al-though this may be a matter of resolution. Nevertheless, if anything we would expect shifts in the crossover land-scape to weaken correlations, making our analysis more conservative.
Future analyses employing both detailed crossover maps and rearrangement data will shed light on whether the reinforcement of GC-rich isochores in birds is in-deed related to a connection between the stable avian karyotype and stable recombination landscapes. One ex-planation that has been proposed for the long-lived
re-combination hotspots in dog is the loss of PRDM9 in
canids, leading to pronounced signatures consistent with long episodes of gBGC [36]. Like dogs, birds appear to lack a functional copy of the gene [35], implying that karyotypic stability may not be the only possible explan-ation for what we observe in birds.
Characterizing the strength of gBGC using a model such as that of Lartillot [24] will enable us to gather more information about the longevity of avian recom-bination hotspots in future studies. In mammals, a mere 20% of the strength of gBGC is accounted for by karyo-type and body mass, presumably owing to population size not being perfectly correlated with body mass, and karyotype not accounting for all of the variation in re-combination rates [24]. Levels of species inbreeding are also expected to play a role [79]. Therefore, gathering more information about how well body mass explains traces left in the genome by gBGC relative to other proxies such as gene tree discordance or levels of het-erozygosity will be important. The increasing availability of polymorphism data will also allow fixation biases to be modeled [25], perhaps providing more direct evi-dence for gBGC in the future.
At present, we cannot fully distinguish between the relative importance of the generation time and population size effects on the strength of GC-biased gene conversion because species with long generation times tend also to have small populations, and our results suggest that GC has not reached equilibrium in the majority of lineages.
As with recombination, Nevaries both along the genome
and between genomes. Indeed recombination itself modu-lates Nelocally. This is however likely to be of limited
im-portance. Differences in Ne between genes along the
recombining sequences might affect the efficacy of gBGC less than the overall species-specific Ne. Whether these predictions also hold for birds, where one might expect to
see more pronounced intragenomic variation in Neowing
to heterogeneous recombination rates, is as of yet not clear. Moreover, the extent to which selection on syn-onymous or non-coding sites might modulate the impact of gBGC on composition remains to be explored.
More generally, our results show that the relationship between life history traits and base composition is not limited to mammalian species, as would be expected for a mechanism that is conserved across a wide range of eukaryotic species. Interestingly, the sea lamprey genome, which contains a large number of micro-chromosomes has an extremely high GC3 content, in principle consist-ent with recombination driving an increase in GC. Sur-prisingly, despite the connection between the strength of gBGC and chromosome number, no significant correl-ation between GC and GC3 was reported [80]. Given the abundance of repetitive sequence in the lamprey and the fact that unmasked sequences were assayed, this may however be a method artefact rather than evidence against gBGC as a driver of GC in this particular genome.
Conclusions
Here, we have demonstrated the pervasive impact of gBGC on avian base composition and shown that life history affects lineage-specific patterns of GC evolution.
The observation that a species’GC content can be
pre-dicted from its life history for multiple taxa strengthens the plausibility of gBGC acting as a driver of between-lineage differences in composition in addition to its well-established role as a determinant of within-species variation. Our results are in line with the expectation that a mechanism that is conserved across multiple eukaryotic groups ought to leave similar traces in their genomes, as appears to be the case for mammals and birds.
Our findings are also of broad interest for phylogenetic reconstruction, as there is increasing evidence that base composition can substantially alter the topologies of the trees inferred from different classes of sequence [33,47]. This is further elaborated on in our large-scale phyloge-nomic analysis of the genome sequences used herein [33]. Beyond model misspecification related to base compos-ition, high recombination could affect phylogenetic infer-ence in several ways, for instance via its association with incomplete lineage sorting or, in lineages with rapid turn-over of hotspots, by frequent switches in the substitution regime [81]. Gathering further information on the dynam-ics of evolution of avian recombination landscapes in the future will shed light on whether the latter mechanism is likely to be of importance in birds. More generally, the impact of a mechanism that drives alleles to fixation
in absence of positive selection on lineage-specific sub-stitutions [10] may be of practical importance for the in-terpretation of evolutionary rates.
Materials and methods
Sequence data
This work was a companion study to a recent initiative to resolve the phylogeny of modern birds and coding and intronic sequence alignments were obtained from the Avian Phylogenomics Consortium [33,48], who pro-vide a detailed description of how data were generated. Briefly, this data set comprises 8,295 orthologous protein coding sequences identified by propagating chicken and zebra finch annotations to the remaining species and classifying orthology by combining information from alignment statistics, reciprocal best hits and synteny. In-trons for these orthologs were defined by identifying gene-models with conserved exon-intron boundaries. Multiple sequence alignments were generated by run-ning SATé + PRANK followed by SATé + MAFFT on concatenated exon sequences and two rounds of SATé + MAFFT on introns [33].
Nucleotide composition
GC content was calculated for first, second, and third coding positions, as well as at intronic sites for each spe-cies. Only those orthologs present in all species were
considered (n= 1,780) to ensure comparisons between
species were made between comparable coding se-quences. Nucleotide content was tallied for all sites at a given position before computing the proportion of GC nucleotides, so that short sequences do not introduce noise. Similarly, for introns only those associated with genes found in the above set of orthologs were consid-ered (n= 404). Additionally, nucleotide content was cal-culated in the above manner for all 8,295 orthologs for c123, c12, c3 and introns.
Life history traits
Body mass data were extracted from theCRC Handbook
of Avian Body Masses[82], with only data for unambigu-ously named tip nodes being used. Where multiple en-tries for a given species were present, the mean value was calculated. We therefore averaged across males and females where these were not already pooled in the data-set. Data on maximum longevity and age of first female sexual maturity were extracted from build 11 of the AnAge database [83] for each available species.
Reconstructed ancestral generation times
10 kb of concatenated sequence drawn randomly from the 1,185 1:1 orthologs. This approach allows ancestral traits to be estimated by combining a Brownian diffusion process and correlations between substitution rates and life history traits. As species dN/dS does not correlate with life history traits in the manner expected under nearly neutral theory in birds [84], we employed overall substitution rates for the reconstructions (that is, Coevol was run without the codon model option). The prior for the root was set to 100 My, which is close to the esti-mated age in the dated tree [33], with a standard devi-ation of 100 My, and a burn-in of 100 points was used to evaluate the chains. Reconstructed estimates were highly correlated between the 10 concatenated align-ments (Additional file 6), indicating that 10 kb of se-quence were sufficient to give reproducible results while being less computationally costly. We ran additional Coevol chains with the above parameters allowing for variation in equilibrium GC, which in turn allowed us to estimate GC3* for internal branches and examine the correlations between GC and age of first female sexual maturity through time.
Ancestral generation time g is typically calculated by
g=a+ [s⁄(1 -s)] wheresdenotes the expected adult sur-vival rate andais age of first female sexual maturity. As we lack a curated source forsfor our species, we consid-ered whether approximating ancestral survival by fitting a regression model to data from 271 bird species for
which bothgand aare available [85] would improve our
estimation of N. However, after performing these calcula-tions (s⁄(1 - s)) tended to be inflated in late-reproducing birds with high survival rates, leading to inferred gener-ation times that were greater than maximum longevity. We therefore opted to use age of first female maturity as a proxy for generation time.
Ancestral population size
Gene tree topologies were compared to the species tree with a double-recursive tree traversal similar to that used in PHYLDOG [86]. Briefly, the nodes of the gene tree (MP-EST in [33]) were first mapped onto nodes of the species tree (TENT ExaML in [33]), and then the number of gene lineages at the beginning and at the end of each branch of the species tree are recorded. These numbers are computed for all gene trees. Then these numbers are used to estimate branch lengths in coalescent units (co-alescent units correspond to the number of generations di-vided by the effective population size along a branch of the species tree) using the following formula, for the branchi:
length of branch i ¼ logððn12þnkkÞ=nkkÞ
where n12 is the number of times one gene was found
at the beginning of branch i, and two genes were found
at the end ofbranch i over all gene trees, andnkkis the
number of times k genes were found at the beginning
and the end of branch i all gene trees, k≠1. This for-mula is an approximation based on equation (2) in refer-ence [63], and was found to work well on simulated data (data not shown). Additionally, branch lengths were also calculated with MP-EST version 1.4 [87].
Thus, for a given branch the reconstructed population size is:
N ¼ internodal time span=
ð2coalescent branch lengthreconstructed generation timeÞ
where reconstructed generation time is the mean of the values inferred by Coevol for the nodes at either end of the branch. Internodal time spans were obtained from reference [33]. Note that underestimated coalescent branch lengths will inflate estimates of N by decreasing the divisor of the equation. This is expected to be particu-larly problematic for poorly resolved parts of the tree, where errors in the gene trees are most frequent. Noise due to lack of information may tend to homogenize the frequencies of the gene trees, leading branch lengths to be underestimated. High levels of recombination in avian ge-nomes are expected to exacerbate this problem.
Time corrected GC3 conservation
Following the method of Romiguieret al.[61], we
com-puted a time corrected index of GC3-conservation for 19 independent pairs of modern bird species. This index isγ= -t/log(τ), wheretis the divergence time of the spe-cies pair and τ the Kendall’s correlation coefficient of gene GC3 in species 1 vs species 2 (830 ortholog families with the highest GC3 variance).
In order to have comparable body-mass in each pair, we chose species that maximized the number of closely related pairs (Additional file 7). We excluded the two Paleognathes (ostrich and great tinamou) because of their extreme con-trast in body mass. Among the Neognathae, we chose the Haliaeetus albicilla (white-tailed eagle)/Cathartes aura(turkey vulture) pair over the intra-genusHaliaeetus albicilla/Haliaeetus leucocephalus pair (bald eagle) be-cause of the extremely short divergence time of the latter. These 19 time-corrected measures of GC3-conservation were then correlated with the mean body mass of the cor-responding species pair.
Recombination rates
Statistical analyses
All statistics were calculated in R.
Data availability
The genome sequences used in this study are available from GigaDB [88].
Additional files
Additional file 1:List of species abbreviations used in figures.
Additional file 2:Relationships between amino acid usage and body mass.
Additional file 3:Phylogenetic independent contrasts.
Additional file 4:Correlations though time between dS, age of female sexual maturity, and GC3.
Additional file 5:Estimates of equilibrium process half times.
Additional file 6:Correlations between Coevol reconstructed traits for 10 concatenated alignments.
Additional file 7:Species pairs used for GC3 conservation analysis.
Abbreviations
dN/dS:ratio of synonymous to non-synonymous substitutions; gBGC: GC-biased gene conversion; GC3: GC content at third codon positions; GC3*: equilibrium GC at third codon positions; LHTs: Life history traits; Mb: Megabase pair; Ne: Effective population size; S: strong substitution; W: weak substitution.
Competing interests
The authors declare that they have no competing interests.
Authors’contributions
CCW conceived the study, designed and performed the analyses, and wrote the manuscript. BB calculated coalescent branch lengths and conceived the ancestral population size analysis. JR designed and performed the GC3 concordance analyses. EDJ helped develop the study and made genomes available. HE initiated and supervised the project, and helped write the manuscript. All authors read, edited, and approved the manuscript.
Acknowledgments
Computational analyses were performed using resources provided by the Uppsala Multidisciplinary Center for Advanced Computational Science (UPPMAX) of Uppsala University, supported by the Swedish National Infrastructure for Computing (SNIC). The study was funded by the European Research Council (AdG 249976), Knut and Alice Wallenberg Foundation (Wallenberg Scholar Grant and the Swedish Research Council (2010-5650; all to HE). JR received funding from ANR-10-BINF-01-02‘Ancestrome’and European Research Council (AdG 232971; principal investigator Nicolas Galtier). EDJ received funding from the Howard Hughes Medical Institute. We would like to thank Laurence Hurst, Benoît Nabholz, Sankar Subramanian, and Nicolas Galtier for helpful discussions. We also thank two anonymous reviewers for their comments on the manuscript.
Author details
1Department of Evolutionary Biology, Evolutionary Biology Centre, Uppsala
University, Norbyvägen 18D, SE-752 36 Uppsala, Sweden.2Laboratoire de Biométrie et Biologie Evolutive, Université de Lyon, Université Lyon 1, CNRS, UMR5558, Villeurbanne, France.3CNRS, Université Montpellier 2, UMR 5554, ISEM, Montpellier, France.4Department of Neurobiology, Howard Hughes
Medical Institute, Duke University Medical Center, Durham, NC, USA.
Received: 8 April 2014 Accepted: 19 November 2014
References
1. Wilson Sayres MA, Venditti C, Pagel M, Makova KD:Do variations in substitution rates and male mutation bias correlate with life-history traits? A study of 32 mammalian genomes.Evolution2011,65:2800–2815.
2. Lartillot N, Delsuc F:Joint reconstruction of divergence times and life-history evolution in placental mammals using a phylogenetic covariance model. Evolution2012,66:1773–1787.
3. Thomas JA, Welch JJ, Lanfear R, Bromham L:A generation time effect on the rate of molecular evolution in invertebrates.Mol Biol Evol2010, 27:1173–1180.
4. Bromham L:The genome as a life-history character: why rate of molecular evolution varies between mammal species.Philos Trans R Soc Lond B Biol Sci 2011,366:2503–2513.
5. Lanfear R, Kokko H, Eyre-Walker A:Population size and the rate of evolution. Trends Ecol Evol2014,29:33–41.
6. Akashi H, Osada N, Ohta T:Weak selection and protein evolution.Genetics 2012,192:15–31.
7. Nabholz B, Uwimana N, Lartillot N:Reconstructing the phylogenetic history of long-term effective population size and life-history traits using patterns of amino acid replacement in mitochondrial genomes of mammals and birds.Genome Biol Evol2013,5:1273–1290.
8. Mancera E, Bourgon R, Brozzi A, Huber W, Steinmetz LM:High-resolution mapping of meiotic crossovers and non-crossovers in yeast.Nature2008, 454:479–485.
9. Lesecque Y, Mouchiroud D, Duret L:GC-biased gene conversion in yeast Is specifically associated with crossovers: Molecular mechanisms and evolutionary significance.Mol Biol Evol2013,30:1409–1419.
10. Galtier N, Duret L:Adaptation or biased gene conversion? Extending the null hypothesis of molecular evolution.Trends Genet2007,23:273–277. 11. Galtier N, Piganeau G, Mouchiroud D, Duret L:GC-content evolution in
mammalian genomes: the biased gene conversion hypothesis.Genetics 2001,159:907–911.
12. Webster MT, Hurst LD:Direct and indirect consequences of meiotic recombination: implications for genome evolution.Trends Genet2012, 28:101–109.
13. Muyle A, Serres-Giardi L, Ressayre A, Escobar J, Glémin S:GC-biased gene conversion and selection affect GC content in theOryza genus(rice). Mol Biol Evol2011,28:2695–2706.
14. Duret L, Arndt PF:The impact of recombination on nucleotide substitutions in the human genome.PLoS Genet2008,4:e1000071. 15. Duret L, Galtier N:Biased gene conversion and the evolution of
mammalian genomic landscapes.Annu Rev Genomics Hum Genet2009, 10:285–311.
16. Pessia E, Popa A, Mousset S, Rezvoy C, Duret L, Marais GAB:Evidence for widespread GC-biased gene conversion in eukaryotes.Genome Biol Evol 2012,4:675–682.
17. Birdsell JA:Integrating genomics, bioinformatics, and classical genetics to study the effects of recombination on genome evolution.Mol Biol Evol 2002,19:1181–1197.
18. Spencer CCA, Deloukas P, Hunt S, Mullikin J, Myers S, Silverman B, Donnelly P, Bentley D, McVean G:The influence of recombination on human genetic diversity.PLoS Genet2006,2:e148.
19. Backström N, Forstmeier W, Schielzeth H, Mellenius H, Nam K, Bolund E, Webster MT, Ost T, Schneider M, Kempenaers B, Ellegren H:The recombination landscape of the zebra finchTaeniopygia guttata genome.Genome Res2010,20:485–495.
20. Groenen MAM, Wahlberg P, Foglio M, Cheng HH, Megens H-j, Crooijmans RPM, Besnier F, Lathrop M, Muir WM, Wong GK-S, Gut I, Andersson L:A high-density SNP-based linkage map of the chicken genome reveals sequence features correlated with recombination rate.Genome Res2009,19:510–519. 21. Romiguier J, Ranwez V, Douzery EJP, Galtier N:Contrasting GC-content
dynamics across 33 mammalian genomes: relationship with life-history traits and chromosome sizes.Genome Res2010,20:1001–1009. 22. Gossmann TI, Woolfit M, Eyre-Walker A:Quantifying the variation in the
effective population size within a genome.Genetics2011,189:1389–1402. 23. Nagylaki T:Evolution of a finite population under gene conversion.
Proc Natl Acad Sci U S A1983,80:6278–6281.
24. Lartillot N:Phylogenetic patterns of GC-biased gene conversion in placental mammals and the evolutionary dynamics of recombination landscapes.Mol Biol Evol2013,30:489–502.
25. de Maio N, Schlötterer C, Kosiol C:Linking great Apes genome evolution across time scales using polymorphism-aware phylogenetic models. Mol Biol Evol2013,30:2249–2262.
Hernandez RD, Melton C, Venkat A, Nobrega MA, Bontrop R, Myers S, Donnelly P, Przeworski M, McVean G:A fine-scale chimpanzee genetic map from population sequencing.Science2012,336:193–198. 27. Farré M, Micheletti D, Ruiz-Herrera A:Recombination rates and genomic
shuffling in human and chimpanzee–a new twist in the chromosomal speciation theory.Mol Biol Evol2013,30:853–864.
28. Clément Y, Arndt PF:Substitution patterns are under different influences in primates and rodents.Genome Biol Evol2011,3:236–245.
29. Ellegren H:Evolutionary stasis: the stable chromosomes of birds.Trends Ecol Evol2010,25:283–291.
30. Shetty S, Griffin DK, Graves JA:Comparative painting reveals strong chromosome homology over 80 million years of bird evolution. Chromosome Res1999,7:289–295.
31. Derjusheva S, Kurganova A, Habermann F, Gaginskaya E:High chromosome conservation detected by comparative chromosome painting in chicken, pigeon and passerine birds.Chromosome Res2004,12:715–723. 32. Guttenbach M, Nanda I, Feichtinger W, Masabanda JS, Griffin DK, Schmid M:
Comparative chromosome painting of chicken autosomal paints 1–9 in nine different bird species.Cytogenet Genome Res2003,103:173–184. 33. Jarvis ED, Mirarab S, Aberer AJ, Li B, Houde P, Li C, Ho SYW, Faircloth BC,
Nabholz B, Howard JT, Suh A, Weber CC, da Fonseca RR, Li J, Zhang F, Li H, Zhou L, Narula N, Liu L, Ganapathy G, Boussau B, Bayzid MS, Zavidovych V, Subramanian S, Gabaldón T, Capella-Gutiérrez S, Huerta-Cepas J, Rekepalli B, Munch K, Schierup M,et al:Whole-genome analyses resolve early branches in the tree of life of modern birds.Science2014,346:1320–1331. 34. Warren WC, Clayton DF, Ellegren H, Arnold AP, Hillier LW, Künstner A:The
genome of a songbird.Nature2010,464:757–762.
35. Oliver PL, Goodstadt L, Bayes JJ, Birtle Z, Roach KC, Phadnis N, Beatson S, Lunter G, Malik HS, Ponting CP:Accelerated evolution of thePrdm9speciation gene across diverse metazoan taxa.PLoS Genet2009,5:e1000753.
36. Axelsson E, Webster MT, Ratnakumar A, Ponting CP, Lindblad-Toh K:Death ofPRDM9coincides with stabilization of the recombination landscape in the dog genome.Genome Res2012,22:51–63.
37. Lesecque Y, Glémin S, Lartillot N, Mouchiroud D, Duret L:The Red Queen model of recombination hotspots evolution in the light of archaic and modern human genomes.PLoS Genet2014,10:e1004790.
38. Mugal CF, Arndt PF, Ellegren H:Twisted signatures of GC-biased gene conversion embedded in an evolutionary stable karyotype.Mol Biol Evol 2013,30:1700–1712.
39. Martini E, Diaz RL, Hunter N, Keeney S:Crossover homeostasis in yeast meiosis.Cell2006,126:285–295.
40. McQueen HA, Siriaco G, Bird AP, Mcqueen HA:Chicken
microchromosomes are hyperacetylated, early replicating, and gene rich. Genome Res1998,8:621–630.
41. ICGSC:Sequence and comparative analysis of the chicken genome provide unique perspectives on vertebrate evolution.Nature2004, 432:695–716.
42. Axelsson E, Webster M, Smith N, Burt D, Ellegren H:Comparison of the chicken and turkey genomes reveals a higher rate of nucleotide divergence on microchromosomes than macrochromosomes.Genome Res2005,15:120–125.
43. Webster MT, Axelsson E, Ellegren H:Strong regional biases in nucleotide substitution in the chicken genome.Mol Biol Evol2006,23:1203–1216. 44. Duret L, Semon M, Mouchiroud D, Galtier N:Vanishing GC-rich isochores
in mammalian genomes.Genetics2002,1847:1837–1847.
45. Belle EMS, Duret L, Galtier N, Eyre-Walker A:The decline of isochores in mammals: an assessment of the GC content variation along the mammalian phylogeny.J Mol Evol2004,58:653–660.
46. Smith NGC, Eyre-Walker A:The compositional evolution of the murid genome.J Mol Evol2002,55:197–201.
47. Nabholz B, Künstner A, Wang R, Jarvis ED, Ellegren H:Dynamic evolution of base composition: causes and consequences in avian phylogenomics. Mol Biol Evol2011,28:2197–2210.
48. Zhang G, Li C, Li Q, Li B, Larkin DM, Lee C, Storz JF, Antunes A, Greenwold MJ, Meredith RW, Odeen A, Cui J, Zhou Q, Xu L, Pan H, Wang Z, Jin L, Zhang P, Hu H, Yang W, Hu J, Xiao J, Yang Z, Liu Y, Xie Q, Yu H, Lian J, Wen P, Zhang F, Li H,et al:Comprehensive avian phylogenomic analyses reveal novel and fundamental insights on genomic and phenotypic complexities of bird evolution.Science 2014,346:1311–1320.
49. dos Reis M, Wernisch L:Estimating translational selection in eukaryotic genomes.Mol Biol Evol2009,26:451–461.
50. Künstner A, Nabholz B, Ellegren H:Significant selective constraint at 4-fold degenerate sites in the avian genome and its consequence for detection of positive selection.Genome Biol Evol2011,3:1381–1389.
51. Doherty A, McInerney JO:Translational selection frequently overcomes genetic drift in shaping synonymous codon usage patterns in vertebrates.Mol Biol Evol2013,30:2263–2267.
52. Urrutia AO, Hurst LD:Codon usage bias covaries with expression breadth and the rate of synonymous evolution in humans, but this is not evidence for selection.Genetics2001,159:1191–1199.
53. Plotkin JB, Kudla G:Synonymous but not the same: the causes and consequences of codon bias.Nat Rev Genet2011,12:32–42.
54. Chamary J-V, Parmley JL, Hurst LD:Hearing silence: non-neutral evolution at synonymous sites in mammals.Nat Rev Genet2006,7:98–108. 55. Piganeau G, Mouchiroud D, Duret L, Gautier C:Expected relationship
between the silent substitution rate and the GC content: implications for the evolution of isochores.J Mol Evol2002,54:129–133.
56. Park C, Chen X, Yang J-R, Zhang J:Differential requirements for mRNA folding partially explain why highly expressed proteins evolve slowly. Proc Natl Acad Sci U S A2013,110:E678–E686.
57. Zur H, Tuller T:Strong association between mRNA folding strength and protein abundance in S. cerevisiae.EMBO Rep2012,13:272–277. 58. Galtier N, Duret L, Glémin S, Ranwez V:GC-biased gene conversion
promotes the fixation of deleterious amino acid changes in primates. Trends Genet2009,25:1–5.
59. Warnecke T, Weber CC, Hurst LD:Why there is more to protein evolution than protein function: splicing, nucleosomes and dual-coding sequence. Biochem Soc Trans2009,37:756–761.
60. Galtier N, Gouy M:Inferring pattern and process: maximum-likelihood implementation of a nonhomogeneous model of DNA sequence evolution for phylogenetic analysis.Eevolution1998, 15:871–879.
61. Romiguier J, Ranwez V, Douzery EJP, Galtier N:Genomic evidence for large, long-lived ancestors to placental mammals.Mol Biol Evol2013,30:5–13. 62. Nee S, Read A, Greenwood J, Harvey P:The relationship between
abundance and body size in British birds.Nature1991,351:312–313. 63. Rosenberg NA:The probability of topological concordance of gene trees
and species trees.Theor Popul Biol2002,61:225–247.
64. Lartillot N, Poujol R:A phylogenetic model for investigating correlated evolution of substitution rates and continuous phenotypic characters. Mol Biol Evol2011,28:729–744.
65. Duret L, Eyre-Walker A, Galtier N:A new perspective on isochore evolution. Gene2006,385:71–74.
66. Romiguier J, Figuet E, Galtier N, Douzery EJP, Boussau B, Dutheil JY, Ranwez V:Fast and robust characterization of time-heterogeneous sequence evolutionary processes using substitution mapping. PLoS One2012,7:e33852.
67. Warnecke T, Batada NN, Hurst LD:The impact of the nucleosome code on protein-coding sequence evolution in yeast.PLoS Genet 2008,4:e1000250.
68. Haddrath O, Baker AJ:Multiple nuclear genes and retroposons support vicariance and dispersal of the palaeognaths, and an Early Cretaceous origin of modern birds.Proc Biol Sci2012,279:4617–4625.
69. Amit M, Donyo M, Hollander D, Goren A, Kim E, Gelfman S, Lev-Maor G, Burstein D, Schwartz S, Postolsky B, Pupko T, Ast G:Differential GC content between exons and introns establishes distinct strategies of splice-site recognition.Cell Rep2012,1:543–556.
70. Gelfman S, Cohen N, Yearim A, Ast G:DNA-methylation effect on cotranscriptional splicing is dependent on GC architecture of the exon-intron structure.Genome Res2013,23:789–799.
71. Duret L, Hurst LD:The elevated GC content at exonic third sites is not evidence against neutralist models of isochore evolution.Mol Biol Evol 2001,18:757–762.
72. Nam K, Ellegren H:Recombination drives vertebrate genome contraction. PLoS Genet2012,8:e1002680.
73. Johnson KP:Deletion bias in avian introns over evolutionary timescales. Mol Biol Evol2004,21:599–602.
75. Dreszer TR, Wall GD, Haussler D, Pollard KS:Biased clustered substitutions in the human genome: the footprints of male-driven biased gene conversion.Genome Res2007,17:1420–1430.
76. Berglund J, Pollard KS, Webster MT:Hotspots of biased nucleotide substitutions in human genes.PLoS Biol2009,7:e26.
77. Pink CJ, Hurst LD:Late replicating domains are highly recombining in females but have low male recombination rates: implications for isochore evolution.PLoS One2011,6:e24480.
78. Popa A, Samollow P, Gautier C, Mouchiroud D:The sex-specific impact of meiotic recombination on nucleotide composition.Genome Biol Evol 2012,4:412–422.
79. Glémin S:Surprising fitness consequences of GC-biased gene conversion. II Heterosis. Genetics2011,187:217–227.
80. Smith JJ, Kuraku S, Holt C, Sauka-Spengler T, Jiang N, Campbell MS, Yandell MD, Manousaki T, Meyer A, Bloom OE, Morgan JR, Buxbaum JD, Sachidanandam R, Sims C, Garruss AS, Cook M, Krumlauf R, Wiedemann LM, Sower SA, Decatur WA, Hall JA, Amemiya CT, Saha NR, Buckley KM, Rast JP, Das S, Hirano M, McCurley N, Guo P, Rohner N,et al:Sequencing of the sea lamprey (Petromyzon marinus) genome provides insights into vertebrate evolution.Nat Genet2013,45:415–421.
81. Romiguier J, Ranwez V, Delsuc F, Galtier N, Douzery EJP:Less is more in mammalian phylogenomics: AT-rich genes minimize tree conflicts and unravel the root of placental mammals.Mol Biol Evol2013,30:2134–2144. 82. Dunning JBJ:CRC Handbook of Avian Body Masses.2nd edition. Boca Raton,
FL: CRC Press; 2007.
83. de Magalhães JP, Costa J:A database of vertebrate longevity records and their relation to other life-history traits.J Evol Biol2009,22:1770–1774. 84. Weber CC, Nabholz B, Romiguier J, Ellegren H:Kr/Kc but not dN/dS
correlates positively with body mass in birds, raising implications for inferring lineage-specific selection.Genome Biol2014,15:542. 85. Møller AP:Sociality, age at first reproduction and senescence:
comparative analyses of birds.J Evol Biol2006,19:682–689.
86. Boussau B, Szöllosi GJ, Duret L, Gouy M, Tannier E, Daubin V:Genome-scale coestimation of species and gene trees.Genome Res2013,23:323–330. 87. Liu L, Yu L, Edwards SV:A maximum pseudo-likelihood approach for
estimating species trees under the coalescent model.BMC Evol Biol2010, 10:302.
88. Zhang G, Li B, Li C, Gilbert MTP, Jarvis ED, The Avian Phylogenomics Consortium, Wang J:The avian phylogenomics project data.GigaScience Database2014, http://dx.doi.org/10.5524/101000
doi:10.1186/s13059-014-0549-1
Cite this article as:Weberet al.:Evidence for GC-biased gene conversion as a driver of between-lineage differences in avian base composition. Genome Biology201415:549.
Submit your next manuscript to BioMed Central and take full advantage of:
• Convenient online submission
• Thorough peer review
• No space constraints or color figure charges
• Immediate publication on acceptance
• Inclusion in PubMed, CAS, Scopus and Google Scholar
• Research which is freely available for redistribution
![Figure 1 GC3 content varies substantially between different avian lineages. Total evidence nucleotide tree [33] showing differences in GC3content between lineages](https://thumb-us.123doks.com/thumbv2/123dok_us/8647273.866623/3.595.57.538.412.703/substantially-different-lineages-evidence-nucleotide-differences-content-lineages.webp)