LTE SYSTEM TEST-BED AND EXPERIMENTAL RESULTS
1MOHAMMED JALOUN, 2KAOUTAR BOUKHRISSI, 3ZOUHAIR GUENNOUN
1Laboratoire d’électronique et de Communication-LEC, Ecole Mohammedia d’ingénieurs-EMI, Université Mohammed V-Agdal-UM5A
2Laboratoire d’électronique et de Communication-LEC, Ecole Mohammedia d’ingénieurs-EMI, Université Mohammed V-Agdal-UM5A
3
Laboratoire d’électronique et de Communication-LEC, Ecole Mohammedia d’ingénieurs-EMI, Université Mohammed V-Agdal-UM5A
E-mail: [email protected],[email protected],[email protected]
Abstract
This paper presents the result of an LTE trial test case that has been performed for morocco Telecom operator which intends to rollout the LTE starting from 2014, the aim is to verify the functionality and performance of LTE equipment in realistic deployment scenarios, with a combination of stationary tests and drive tests, and it focuses on Single User Throughput, Sector Throughput, Latency, and MIMO performance verification.
Keywords: LTE, Test Bed, Experimental Result, Throughput, Latency, MIMO
1. INTRODUCTION
The LTE as defined by 3GPP is a highly flexible radio interface [1] [2], the first release referred as Rel8 is already coming to end and it is supposed to significantly increase peak data rate to 100Mbit/s (downlink) and 50Mbit/s (uplink).and will provide a network delay of less than 5ms. LTE supports both FDD and TDD and targets also a smooth evolution from earlier 3GPP system such as TD-SCDMA and WCDMA/HSPA as well as 3GPP2 systems such as cdma2000. LTE can use spectrum allocations ranging from 1.4 to 20 MHz with a single carrier and addresses all frequency bands currently identified for IMT systems by ITU-R [3].
LTE includes substantial changes to both sides of the mobile network both the radio access network and the core network. But while it will require significant capital investment, LTE is expected to unlock new revenue streams and provide better competitive positioning by allowing operators to offer superior mobile broadband services and a better quality of service in a way that greatly improves the efficient use of network resources, but before the rollout, operators need to perform field test in order to prove that the performance of an operating network matches the offer. In that perspective, an LTE performance tests has been conducted in morocco Telecom Operator
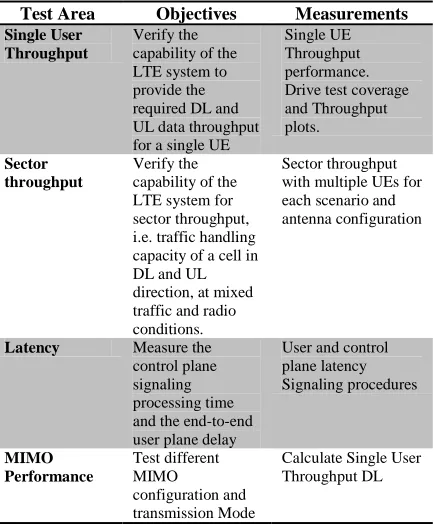
[image:1.612.311.528.425.688.2]and the objectives of the test-bed is summarized in table 1:
Table 1: LTE Test-Bed Objectives And Measurements
Test Area Objectives Measurements
Single User Throughput
Verify the capability of the LTE system to provide the required DL and UL data throughput for a single UE
Single UE Throughput performance. Drive test coverage and Throughput plots.
Sector throughput
Verify the capability of the LTE system for sector throughput, i.e. traffic handling capacity of a cell in DL and UL direction, at mixed traffic and radio conditions.
Sector throughput with multiple UEs for each scenario and antenna configuration
Latency Measure the control plane signaling processing time and the end-to-end user plane delay
User and control plane latency Signaling procedures
MIMO Performance
Test different MIMO
configuration and transmission Mode
In order to evaluate the deployed LTE system, the below list of KPIs [2] has been collected during the trial tests:
SINR: Signal to Interference plus Noise Ratio is commonly used to measure the quality of wireless connections, typically, the energy of a signal fades with distance and take a lot of environmental parameters into account (e.g. the background noise, interfering strength of other simultaneous transmission).
RSSI: E-UTRA Carrier Received Signal Strength Indicator, comprises the total received wideband power observed by the UE from all sources, including co-channel serving and non-serving cells, adjacent channel interference, thermal noise etc.
RSRP: Reference signal received power is determined for a considered cell as the linear average over the power contributions (in [W]) of the resource elements that carry cell-specific reference signals within the considered measurement frequency bandwidth. If receiver diversity is in use by the UE, the reported value shall be equivalent to the linear average of the power values of all diversity branches.
RSRQ: Reference Signal Received Quality is defined as the ratio N×RSRP/(E-UTRA carrier RSSI), where N is the number of RB’s of the E-UTRA carrier RSSI measurement bandwidth. The measurements in the numerator and denominator shall be made over the same set of resource blocks.
2. LTE THEORETICAL BACKGROUND
To compare the experimental results with theoretical, it is necessary to briefly describe the major goals, which were motivating the design of the LTE system as specified in [2]:
High user data rates (peak upload and download rates).
Reduced latency (one-way delay and RTT) Improved system capacity & coverage
(MIMO)
2.1 High user data rate
3GPP-LTE introduces the air interface access technologies from the use of orthogonal frequency division multiplexing (OFDMA) used in the downlink transmission and Single Carrier FDMA (Frequency Division Multiple Access) in the uplink [4].
2.1.1 OFDMA
OFDMA is a digital encoding and modulation technique. Information is transported over an OFDMA channel via a sequence of symbols over a set of subcarriers. The channel bandwidth is divided into equally-spaced subcarriers. The equal spacing of orthogonal subcarriers is designed to minimize interference between adjacent subcarriers.
A Physical Resource Block (PRB) or Resource Block (RB) is the physical resource used for transmission. Capacity allocation in LTE is based on Physical Resource Blocks.
A PRB is composed of 12 subcarriers in the frequency domain per 1 slot period (0.5 ms) in time domain. Since each subcarrier occupies 15 kHz, a PRB occupies 180 kHz in the frequency domain. A different concept is the scheduling resource block that is composed of two Physical Resource Blocks (1 ms duration) since the scheduling is done per 1 ms (TTI duration)
A resource element (RE) is the theoretical minimum capacity allocation unit. It is formed by 1 subcarrier per 1 symbol.
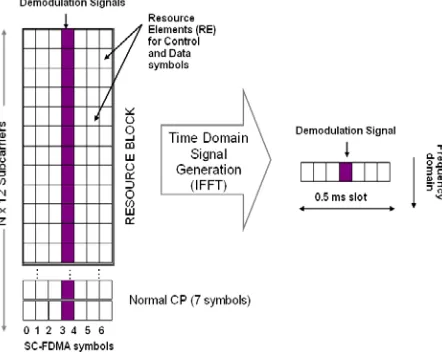
[image:2.612.328.508.403.653.2]Figure 1 represents the resource element concept and (physical) resource block concept in the case of normal CP being used (7 symbols per slot). There are 84 resource elements per PRB.
Figure 1 - Physical RB and RE concepts [5]
Figure 2: LTE theoretical peak throughputs [6]
2.1.2 SC-FDMA
Single Carrier-Frequency Division Multiple Access is the technology chosen for the uplink air interface because it does not suffer from high peak-to-average power ratio (PAPR) as OFDMA. SC-FDMA is a more power efficient variation of OFDMA that still employs subcarriers, FFT, cyclic prefix and other OFDM concepts.
The concept of Physical Resource Block is also valid for uplink: 12 subcarriers in frequency domain by 1 slot in time domain. The demodulation signal, as mentioned before, is always sent in symbol 3 across the whole bandwidth used by the terminal. The remaining resource elements are used for control and data.
The representation of a resource block in the time domain (after the IFFT processing) is shown in figure 3. Every modulated symbol is spread across the 12 subcarriers.
Figure 3: Uplink Resource Block [5]
2.2 Reduced latency
Latency is important when considering real time and interactive services. There are two types of latency:
User plane latency: is the average time between the first transmission of a data packet and the reception of a physical layer ACK. One-way user plane latency is half the round trip (RTT) user plane latency. LTE requirement is that one-way latency across the radio access network (RAN) is as low as 5 ms in optimal conditions but the value is dependent on the system loading and radio propagation conditions. This value corresponds to an RTT of 10 ms which is challenging to achieve in practice.
Control plane latency: (connection setup delay) is the time required for the transitions between different LTE states. LTE is based on two main states: RRC_IDLE and RRC CONNECTED (i.e. active). LTE system needs to support transition from idle into active is less than 100ms excluding paging delay and NAS (Non-Access Stratum signalling delay).
2.3 Improved System capacity & coverage (MIMO)
The LTE standard for mobile broadband includes multi-antenna transmission modes that improve performance in terms of coverage, spectral efficiency and peak throughput.
In The LTE specifications [4], data is mapped to layers after having been encoded and modulated. The number of transmitted layers is called the transmission rank. 3GPP LTE Release 8 (Rel-8) permits up to four layers to be transmitted in the downlink and six transmission modes (see Table 2).
In mode TM1, the layer is transmitted from one antenna port. In mode TM2, a single layer is encoded with a space-frequency block code (SFBC) based on the Alamouti code, and transmitted from multiple antennas.
[image:3.612.86.307.541.717.2]In closed-loop spatial multiplexing (TM4), one or more layers are transmitted using a precoder matrix that is selected from a predefined codebook.
Transmission mode TM5 (multi-user MIMO) enables single-layer transmission to several users who simultaneously share the same frequency allocation.
[image:4.612.311.527.133.518.2]Transmission mode TM6 is similar to transmission mode TM4, except that it is restricted to rank-one transmission.
Table 2: MIMO Transmission Modes In 3GPP LTE Rel-8
Mode Transmission scheme
Characteristics
TM1 single-antenna port Compatible with the transmission with a single antenna
TM2 Transmit diversity Reduces interference, it is applicable in an environment with low value of SINR.
TM3 Open-loop space
division multiplexing
Increases the throughput, this method is applicable in an environment with large values of SINR and conditions of mobility.
TM4 Closed-loop spatial multiplexing
According to the channel conditions, this method increases the throughput; it is applicable for large values of SINR but in conditions of low mobility.
TM5 Multi-user MIMO To increase the cell capacity
TM6 Closed-loop
precoding with rank of 1
To improve the cell coverage
3. Test Assumptions and Test Bed
This section describes the general set of test assumptions that govern our field test cases. 3.1 Test Bed
The measurement campaign was
performed using the Huawei equipments [8] with a collaboration of the morocco Telecom operator LTE test bed; which comprised a cluster of 4 eNodeBs FDD and a cluster of 2 eNodeBs TDD, the evolved Node Bs provides the air interface to the UE and it is connected to MMEs and S-GWs via the S1 interface. All radio functionality is integrated in the eNodeB, i.e. it is the termination point for all radio related protocols. The S1 interface connects the E-UTRAN to the evolved packet core (EPC). It is specified as an open interface that divides the system into radio-specific E-UTRAN and EPC which handles switching, routing and service control.
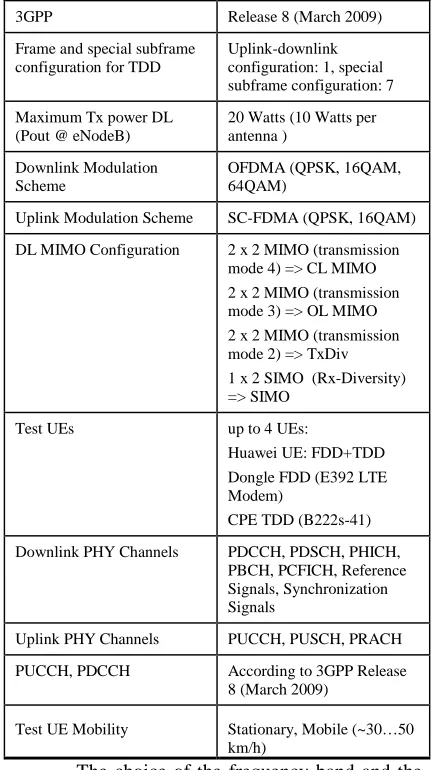
The main functionalities of our assumptions are shown in table 3
Table 3: LTE Test Bed Main Functionality
3GPP Release 8 (March 2009)
Frame and special subframe configuration for TDD
Uplink-downlink configuration: 1, special subframe configuration: 7
Maximum Tx power DL (Pout @ eNodeB)
20 Watts (10 Watts per antenna )
Downlink Modulation Scheme
OFDMA (QPSK, 16QAM, 64QAM)
Uplink Modulation Scheme SC-FDMA (QPSK, 16QAM)
DL MIMO Configuration 2 x 2 MIMO (transmission mode 4) => CL MIMO
2 x 2 MIMO (transmission mode 3) => OL MIMO
2 x 2 MIMO (transmission mode 2) => TxDiv
1 x 2 SIMO (Rx-Diversity) => SIMO
Test UEs up to 4 UEs:
Huawei UE: FDD+TDD Dongle FDD (E392 LTE Modem)
CPE TDD (B222s-41)
Downlink PHY Channels PDCCH, PDSCH, PHICH,
PBCH, PCFICH, Reference Signals, Synchronization Signals
Uplink PHY Channels PUCCH, PUSCH, PRACH
PUCCH, PDCCH According to 3GPP Release
8 (March 2009)
Test UE Mobility Stationary, Mobile (~30…50
km/h)
[image:4.612.313.525.586.674.2]The choice of the frequency band and the carrier bandwidth are important as they affect the coverage and the cell capacity, table 4 shows the parameters related to frequency of the test bed eNodeBs.
Table 4: Frequency Parameters Of The Test Bed
Technology Site Name Frequency Band
Carrier Bandwidth
LTE FDD CAS-4156 LTE 800 10 Mhz
CAS-4122 LTE 1800 10 Mhz
LTE TDD CAS-1207 LTE 2600 20 Mhz
CAS-1148 LTE 2600 20 Mhz
Figure 4: LTE Test Bed Architecture
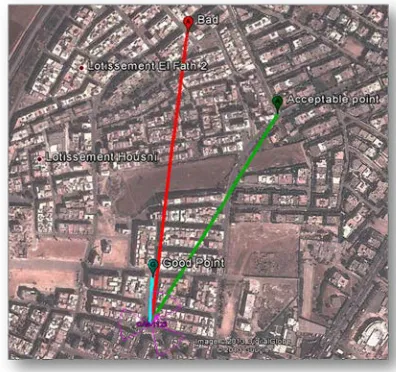
The list of the LTE sites are shown on the aerial photograph of the area with drive routes drawn in (figure 5)
- 2 Sites LTE-TDD : CAS-1207/CAS-1148.
- 5 Sites LTE-FDD: CAS-1122/CAS- 1156/CAS-1155/CAS-1093/CAS-1049.
Figure 5:Aerial Photograph Of The Area Used For Test
And LTE Sites
It is assumed that the performance results are validated against the SINR distribution described in table 5, where SINR is Signal to Interference and Noise Ratio. These categories will be used to determine static test locations and provide a reasonable distribution of poor, average and good quality users in different tests.
During test execution, SINR varies under stationary conditions depending on MIMO mode and actual load situation during the time of the test, however test locations are kept and the actual values are recorded for post-processing, two
locations each for Good, Average and Poor SINR is obtained in order to allow flexibility in field testing.
TABLE 5: SINR Ranges And Conditions
Signal Conditions (dB) Range
Good SINR SINR ≥ 18
Average SINR 5≤ SINR < 18
Poor SINR 0 ≤ SINR < 5
4. RESULTS AND DISCUSSION
Below are analyzed and discussed the results of our LTE trial
4.1 Single User Test
The purpose of this test is to verify the capability of the LTE system to provide the required downlink (DL) data throughput for a single UE under different radio conditions.
A drive test has been conducted across the Site 4122, the levels of the RSRQ are shown on the map of figure 6, and the signal quality level is indicated by different colors which depend of the location of the user relative to the eNodeB.
[image:5.612.90.298.364.540.2] [image:5.612.313.512.367.435.2]Figure 6: Signal Quality Indicator trace
Figure 7: CDF Throughput Distribution Results
Operators are interested in knowing the distribution of throughput and latency KPI figures (e.g. peak user data rate, cell UL/DL throughput, network delay, etc.) across the cells of a “reference cluster”. However, it is impossible or rather it would be associated with prohibitive high costs to measure these KPIs in a live network environment in so many cell positions that a Cumulative Distribution Function (CDF) can be calculated for 5%, 50%, or 95% of the cell area. For this reason, it is proposed to replace the distribution function by KPI figures measured on 3 characteristic positions of the cell:
a. Good radio conditions (line of sight close to cell center within 50m, small noise and low path loss)
b. Medium radio conditions (BTS distance = ½ cell radius, channel with medium noise conditions, medium path losses)
c. Cell Edge conditions (in overlapping area, received power from neighbor cells at about the same level).
[image:6.612.95.492.68.545.2]The test also has been performed for two cases Indoor and Outdoor situation; figure 8 shows the geographic localization of the corresponding 3 points.
Figure 8: Geographic Localization Of The Test Points
Table 6: Tests Location And Mimo Mode
TM 3 TM 2
Outdoor 29.09 100% 0%
Indoor 28.51 99.5% 0.5%
Outdoor 7.42 41% 59%
Indoor 1.44 0.10% 99.90%
Outdoor 4.02 0% 100%
Indoor -3.63 37.40% 62.60%
Mimo Mode
Good
(18<S INR ) 90 m
Medium
(5<S INR<=18) 410 m
Cell Edge
(S INR<=5) 510 m
S INR S cenario Distance S INR(dB)
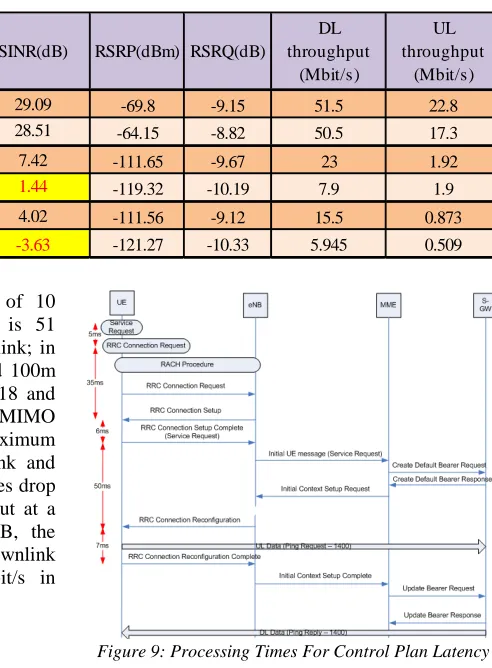
[image:6.612.329.527.246.432.2]Table 7: Single User Throughput Results
Outdoor 29.09 -69.8 -9.15 51.5 22.8
Indoor 28.51 -64.15 -8.82 50.5 17.3
Outdoor 7.42 -111.65 -9.67 23 1.92
Indoor 1.44 -119.32 -10.19 7.9 1.9
Outdoor 4.02 -111.56 -9.12 15.5 0.873
Indoor -3.63 -121.27 -10.33 5.945 0.509
DL throughput
(Mbit/s)
UL throughput
(Mbit/s)
Medium
(5<SINR<=18) 410 m
Cell EDGE
(SINR<=5) 510 m
SINR(dB) Distance
From Site
Good
(18<SINR ) 90 m
RSRP(dBm) RSRQ(dB)
SINR Scenario
With an LTE carrier bandwidth of 10 MHz, the maximum throughput reached is 51 Mbit/s on downlink and 22.8 Mbit/s on uplink; in this case, the user must be outdoors around 100m from the eNodeB with SINR greater than 18 and using Open-Loop Spatial Multiplexing MIMO transmission mode. In indoor case the maximum rates achieved are 50.5 Mbit/s on downlink and 17.3 Mbit/s in the uplink. These performances drop as the user moves far from the eNodeB, but at a distance of 410m away from the eNodeB, the performance remain acceptable and downlink throughput can reach values of 23 Mbit/s in outdoor.
4.2 Latency test
The test includes 2 different test parts, focusing on control plane signaling processing time and the user plane Round Trip Time (RTT). 4.2.1 Control plan latency
[image:7.612.271.517.112.446.2]This delay is the time taken by the UE to switch from RRC_IDLE to RRC CONNECTED; it is measured from the signaling traces shown below in figure 9.
Figure 9: Processing Times For Control Plan Latency
Calculation.
Based on the analysis shown in figure 9, the average control plane latency (=96ms) is within the 3GPP 25.913 requirement (=100ms).
4.2.2 User plan latency
To determine the user plane latency, ping is made from UE to IP host, with 1 hop away from SAE GW and the RTT time is measured.
The latency results depending on the file size. With three different sizes, we were able to identify the following latencies in the best conditions:
♦ A file of 32 Bytes = 256 Bits requires a latency of 13.6 ms.
♦ A file of 1000 Bytes = 8 Kilobits requires a latency of 21.9 ms.
Figure 10: User Plane Latency RTT ping Results
For the User Plan Latency test, Ping command is used with 32Bytes, 1000Bytes and 1600Bytes. Figure 10 shows that the RTT latency increases as the packet size increases. In good situation, the average E2E RTT is about 22ms which is very close to the 3GPP requirement. 4.3 Sector Throughput
Sector Throughput is a key investigation area for customers who would like to evaluate the cell capacity with no load to full load conditions. Until commercial UEs are available in large numbers, realistic full load testing is not feasible in field conditions. This can, however, be approximated with a small number of UEs in radio link conditions that result in fully occupying all frequency blocks in the serving spectrum.
Sector throughput is investigated by using 2 users in 3 scenarios:
♦ Scenario A: User 1 and 2 are placed stationary in excellent radio conditions
♦ Scenario B: User 1 is placed stationary in excellent radio conditions and User 2 in Acceptable conditions.
♦ Scenario C: User 1 is placed stationary in poor radio conditions and User 2 in Acceptable conditions.
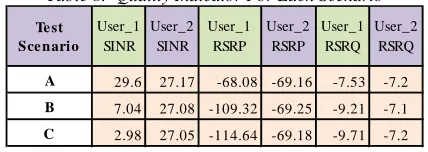
The test results are shown in table 8, and the test is performed on the Site CAS-1122 (FDD 10 Mhz and MIMO 2x2).
Table 8: Quality Indicator For Each Scenario
Te st Sce nario
User_1 SINR
User_2 SINR
User_1 RSRP
User_2 RSRP
User_1 RSRQ
User_2 RSRQ
A 29.6 27.17 -68.08 -69.16 -7.53 -7.2
B 7.04 27.08 -109.32 -69.25 -9.21 -7.1
C 2.98 27.05 -114.64 -69.18 -9.71 -7.2
Sharing a resource block with two users influences the throughput; in the Downlink for
example, the cell capacity is shared between the 2 users and reached 25 Mbit/s each in the first scenario A.
The Capacity of the cell is measured by averaging the Throughput of all UEs during the middle 20 seconds, when all UE are conducting FTP DL in the last 40 seconds. Each test case is repeated 3 times in order to confirm the test results. The achieved test results indicating cell capacity along with the given number of UE in the specified SINR combination are shown in table 9.
TABLE 9:LTECell Throughput Average
Scenario A B C UE 1 25.2 12.2 7.6
UE 2 25 34.4 34.4
Cell Capacity 50.2 46.6 42
Average Cell Capacity
DL Multi User Throughput & Cell Capacity (Mbps)
46.3
4.4 MIMO Performance
The different DL antenna configuration discussed previously can be adjusted according to the channel conditions, traffic conditions, and mobile capability, we distinguish 2 MIMO modes:
Adaptive Mode:
• OL_ADAPTIVE: dynamic switching
between TxDiv (TM1) and SM-MIMO (TM2) based on Channel Quality Indication (CQI) and Rank Indication (RI) reports.
• CL_ADAPTIVE: dynamic switching
between one codeword and two codeword based on Channel Quality Indication (CQI), Rank Indication (RI) reports and Precoding Matrix Indicator (PMI).
• OC_ADAPTIVE: Users could switch automatically between Open-loop and closed loop Adaptive Modes.
Fixed Mode:
• NO_ADAPTIVE: Only type of MIMO transmission is used, TM2, TM3, TM4 and TM6 could be configured on the system.
[image:8.612.328.508.238.324.2] [image:8.612.87.301.626.702.2]The distribution of MIMO transmission modes for each configuration can be represented by the figure 11:
Figure 11: MIMO Mode distribution for each MIMO Configuration
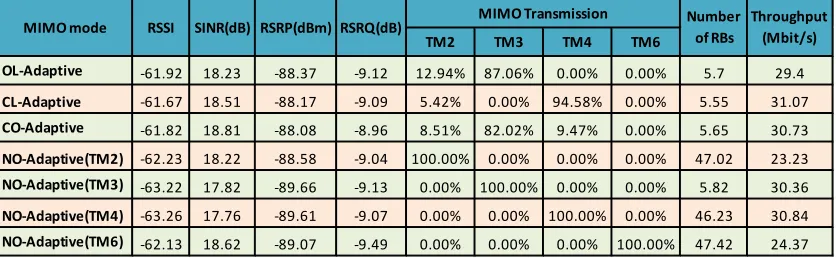
[image:9.612.100.518.320.449.2]The non-adaptive methods use a single mode of MIMO and operating at 100%, while, adaptive modes utilize in large percentage the selected mode either in open loop or closed loop but remain flexible to use another mode, as shown in table 10, for the open loop adaptive: the TM 3 (spatial multiplexing) mode is used 87.06% and TM2 (transmit diversity) is used 12.94%.
Table 10: Performance Indicators For Different MIMO Mode.
TM2 TM3 TM4 TM6
OL-Adaptive -61.92 18.23 -88.37 -9.12 12.94% 87.06% 0.00% 0.00% 5.7 29.4
CL-Adaptive -61.67 18.51 -88.17 -9.09 5.42% 0.00% 94.58% 0.00% 5.55 31.07
CO-Adaptive -61.82 18.81 -88.08 -8.96 8.51% 82.02% 9.47% 0.00% 5.65 30.73
NO-Adaptive(TM2) -62.23 18.22 -88.58 -9.04 100.00% 0.00% 0.00% 0.00% 47.02 23.23
NO-Adaptive(TM3) -63.22 17.82 -89.66 -9.13 0.00% 100.00% 0.00% 0.00% 5.82 30.36
NO-Adaptive(TM4) -63.26 17.76 -89.61 -9.07 0.00% 0.00% 100.00% 0.00% 46.23 30.84
NO-Adaptive(TM6) -62.13 18.62 -89.07 -9.49 0.00% 0.00% 0.00% 100.00% 47.42 24.37 Number
of RBs
Throughput (Mbit/s) MIMO mode RSSI SINR(dB) RSRP(dBm) RSRQ(dB) MIMO Transmission
[image:9.612.92.298.489.611.2]The Consumption of resource blocks for each MIMO mode is shown in the following diagram of figure 12:
Figure 12: Number Of Rbs Consumed For Each MIMO Mode
From the measurement results, we can conclude that the non adaptive modes consumes a lot of radio resources which causes throughput and coverage degradation, to optimize resource consumption, the adaptive mode is much favored, specifically, Closed-loop adaptive mode (CL-Adaptive) consumes the minimum of radio blocs (5.55) in order to improve performance, and a throughput of more than 31 Mbit/s.
5. CONCLUSION
This paper has focused on LTE trial field measurements; after describing the test bed, site configuration and the setting parameters, we presented the test results and analysis in terms of Single throughput, Cell capacity, latency and MIMO configuration. This document will help operators to define their “Request for Proposal” in order to successfully implement LTE.
REFRENCES:
[1] S.Sesia, I.Toufik and M.Baker,“LTE – The UMTS Long Term Evolution- From the Theory to Practice”,1rst ed. 2009 John Wiley & Sons Ltd.
[2] 3GPP TS36.300, “Evolved Universal Terrestrial Radio Access (E-UTRA) and Evolved Universal Terrestrial Radio Access Network (E-UTRAN); Overall description”.
[3] Motorola, “Spectrum Analysis for Future LTE Deployments” Motorola White paper 2007 http://www.motorolasolutions.com/web.
[4] 3GPP TS 36.211 3rd Generation Partnership Project, Technical Specification Group Radio Access Network: Evolved Universal Terrestrial Radio Access (E-UTRA), Physical Channels and Modulation. Release 8.
[5] L. Serna, T. Novosad, C. Johnson “LTE Radio Network Planning Guidelines” v 1.0, June 02,2009.
[6] Mohammed Jaloun, Zouhair Guennoun, “LTE-A Implementation scenarios: RF Planning Comparison”, 32 International Journal of Mobile Computing and Multimedia Communications, 4(1), 32-43, January-March 2012.
[8] Huwaei LTE equipement;URL:
![Figure 1 - Physical RB and RE concepts [5]](https://thumb-us.123doks.com/thumbv2/123dok_us/8914258.960922/2.612.328.508.403.653/figure-physical-rb-and-re-concepts.webp)