www.hydrol-earth-syst-sci.net/15/241/2011/ doi:10.5194/hess-15-241-2011
© Author(s) 2011. CC Attribution 3.0 License.
Earth System
Sciences
Real-time remote sensing driven river basin modeling using radar
altimetry
S. J. Pereira-Cardenal1, N. D. Riegels1, P. A. M. Berry2, R. G. Smith2, A. Yakovlev3, T. U. Siegfried4, and
P. Bauer-Gottwein1
1Department of Environmental Engineering, Technical University of Denmark, Miljøvej, Building 113, 2800 Kgs, Lyngby, Denmark
2Earth and Planetary Remote Sensing Laboratory, De Montfort University, The Gateway, Leicester, LE19BH, UK 3Hydrological Forecasting Department – UzHydromet, Tashkent, Uzbekistan
4The Water Center, The Earth Institute, Columbia University, New York, USA
Received: 20 October 2010 – Published in Hydrol. Earth Syst. Sci. Discuss.: 25 October 2010 Revised: 10 January 2011 – Accepted: 12 January 2011 – Published: 21 January 2011
Abstract. Many river basins have a weak in-situ
hydrom-eteorological monitoring infrastructure. However, water re-sources practitioners depend on reliable hydrological models for management purposes. Remote sensing (RS) data have been recognized as an alternative to in-situ hydrometeoro-logical data in remote and poorly monitored areas and are increasingly used to force, calibrate, and update hydrologi-cal models.
In this study, we evaluate the potential of informing a river basin model with real-time radar altimetry measure-ments over reservoirs. We present a lumped, conceptual, river basin water balance modeling approach based entirely on RS and reanalysis data: precipitation was obtained from the Tropical Rainfall Measuring Mission (TRMM) Multi-satellite Precipitation Analysis (TMPA), temperature from the European Centre for Medium-Range Weather Forecast’s (ECMWF) Operational Surface Analysis dataset and refer-ence evapotranspiration was derived from temperature data. The Ensemble Kalman Filter was used to assimilate radar altimetry (ERS2 and Envisat) measurements of reservoir wa-ter levels. The modeling approach was applied to the Syr Darya River Basin, a snowmelt-dominated basin with large topographical variability, several large reservoirs and scarce hydrometeorological data that is located in Central Asia and shared between 4 countries with conflicting water manage-ment interests.
Correspondence to: P. Bauer-Gottwein ([email protected])
The modeling approach was tested over a historical period for which in-situ reservoir water levels were available. As-similation of radar altimetry data significantly improved the performance of the hydrological model. Without assimila-tion of radar altimetry data, model performance was limited, probably because of the size and complexity of the model domain, simplifications inherent in model design, and the uncertainty of RS and reanalysis data. Altimetry data as-similation reduced the mean absolute error of the simulated reservoir water levels from 4.7 to 1.9 m, and overall model RMSE from 10.3 m to 6.7 m. Model performance was vari-able for the different reservoirs in the system. The RMSE ranged from 10% to 76% of the mean seasonal reservoir level variation.
Because of its easy accessibility and immediate availabil-ity, radar altimetry lends itself to being used in real-time hy-drological applications. As an impartial source of informa-tion about the hydrological system that can be updated in real time, the modeling approach described here can provide use-ful medium-term hydrological forecasts to be used in water resources management.
1 Introduction
hydrological processes. Because the uncertainties inherent in such models are large, calibration and data assimilation techniques are essential to achieve satisfactory model perfor-mance. However, in-situ data availability is limited, partic-ularly in the developing world, where many river basins are poorly gauged. Satellite-based data with high temporal res-olution have the potential to fill critical information gaps in such ungauged or poorly gauged basins (e.g. Grayson et al., 2002; Lakshmi, 2004).
Remote sensing data can be used in hydrological models in two ways (Brunner et al., 2007): as input parameters (or forcing data) and as calibration data. The most popular re-mote sensing data sources for hydrological applications are multispectral imagery for the determination of actual evap-otranspiration (e.g. Bastiaanssen et al., 1998; Jiang et al., 2001; Stisen et al., 2008b), active microwave sensors for mapping of soil moisture distribution (e.g. Parajka et al., 2006), total water storage change estimates from GRACE (e.g. Hinderer et al., 2006; Winsemius et al., 2006), river and lake level variations from radar altimetry (e.g. Birkett, 2000; Alsdorf et al., 2001; Bjerklie et al., 2003; Calmant et al., 2008; Getirana et al., 2009) and interferometric SAR (e.g. Alsdorf et al., 2001; Wdowinski et al., 2004; Gondwe et al., 2010). Several previous studies have used remote sens-ing data in the context of river basin water balance model-ing (e.g. Campo et al., 2006). Andersen et al. (2002) built a distributed hydrological model of the Senegal River Basin using precipitation derived from METEOSAT data and leaf area index (LAI) estimated from the normalized difference vegetation index (NDVI) from NOAA AVHRR data. Stisen et al. (2008a) developed a distributed hydrological model of the same catchment using potential evapotranspiration (PET) estimated from global radiation, precipitation from satellite-derived cold cloud duration, and LAI calculated from NDVI. Boegh et al. (2004) usedRS-data to derive PET and LAI as input to a distributed agro-hydrological model. Francois et al. (2003) used Synthetic Aperture Radar (SAR) estimates of soil moisture in a lumped rainfall-runoff model. Neal et al. (2009) assimilated water level estimates derived from multi-temporal SAR imagery into a coupled hydrological and hydrodynamic model of an ungauged basin. In a similar approach, Montanari et al. (2009) used SAR-derived water levels to update the model states of a simple rainfall-runoff model, which was coupled to a one-dimensional flood inun-dation model.
More recently, the potential of using remote sensing data in real time or near real time to update hydrological model state variables has been recognized. Data assimilation (DA) methods were first used in the fields of oceanography and meteorology, but have been used in hydrology since the 1990s (McLaughlin, 1995; Evensen, 2003). Several DA techniques are available, including the Particle Filter (Aru-lampalam et al., 2002) and the Reduced Rank Square Root Filter (Verlaan et al., 1997); The Ensemble Kalman Filter (Evensen, 2003) is used here because it has a simple
con-ceptual formulation, it is easy to implement and is compu-tationally efficient. Previous studies using data assimilation techniques on hydrological modeling included land surface models (e.g. Reichle et al., 2002), surface water models (e.g. Madsen et al., 2005) and groundwater models (e.g. Franssen et al., 2008). The value of DA for models used in water re-sources management is based on its ability to improve oper-ational forecasts.
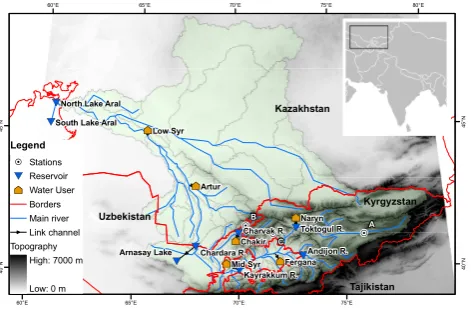
This study presents a semi-distributed river basin model of the Syr Darya River basin in Central Asia (Fig. 1) and analyses how operational model performance in real-time forecasting can be improved if the model is informed with real-time reservoir water levels based on radar altimetry. In situ data availability in the Syr Darya is extremely lim-ited and model forcing variables are therefore exclusively based on remote sensing and reanalysis data. Precipita-tion is obtained from the Tropical Rainfall Measuring Mis-sion (TRMM) Multisatellite Precipitation Analysis (TMPA; Huffman et al., 2007); daily temperature is obtained from the European Centre for Medium-Range Weather Forecast (ECMWF) Operational Surface Analysis dataset (Molteni et al., 1996); and reference evapotranspiration is derived from daily temperature using Hargreaves equation (Allen et al., 1998). The water level in a cascade of four reservoirs is sim-ulated in the model, and satellite radar altimetry data (Berry et al., 2005) are used to update the water level in the reser-voirs using the Ensemble Kalman filter.
2 Study area
The Syr Darya River is located in the Central Asian republics of Kyrgyzstan, Uzbekistan, Tajikistan, and Kazakhstan and, along with the Amu Darya River, is one of two principal trib-utaries to the Aral Sea (Fig. 1). About 22 million people in the region depend on irrigated agriculture for their liveli-hoods, and 20% to 40% of GDP in the riparian countries is derived from agriculture, most of which is irrigated (Buck-nall et al., 2003). Much of the region has an arid climate, with strongly seasonal precipitation and temperature patterns. The extensive development of irrigation in the basin is associated with a number of environmental problems including desicca-tion of the Aral Sea, which has lost up to 90% of its pre-1960 volume and has received international attention as an envi-ronmental disaster area (Micklin, 2007).
# * # * # * # * # * # * ² ³ ² ³ ² ³ ² ³ ² ³ ² ³ # * # * ! H ! H ! H Artur Naryn Chakir Low Syr
Mid Syr Fergana Andijon R. Charvak R. Toktogul R.
Chardara R. Arnasay Lake
Kayrakkum R. South Lake Aral
North Lake Aral
C B A 60°E 60°E 65°E 65°E 70°E 70°E 75°E 75°E 80°E 4 0
°N 40°N
4
5
°N 45°N
Legend ! H Stations # * Reservoir ² ³ Water User
Borders Main river Link channel Topography
High: 7000 m Low: 0 m
Uzbekistan
Kazakhstan
[image:3.595.51.287.63.218.2]Tajikistan Kyrgyzstan
Fig. 1. Base map of the Syr Darya River Basin (SDRB).
effects of snowmelt and glacial runoff, about 80% of runoff in the basin occurs between March and September. The on-set of the snowmelt period shifts from early spring to early summer with increasing elevation, distributing snowmelt runoff over a period of several months. In the summer months, glacial ablation peaks and prolongs the period of peak runoff. Annual runoff averages about 39 km3/year (ap-prox. 96 mm/year), and approximately 90% of the river’s mean annual flow is regulated by reservoirs (Savoskul et al., 2003).
The Syr Darya River was extensively developed for irriga-tion and hydropower during Soviet times, particularly after 1960, with the primary goal of producing cotton. Total ir-rigated area in the Aral Sea basin increased from 5 million hectares in 1965 to 7.9 million hectares in 2000 (Micklin, 2007). About 1.7 million hectares are currently irrigated di-rectly from the Syr Darya River (Siegfried et al., 2007). Cot-ton is an important source of foreign exchange in Uzbekistan, and continued production through irrigated agriculture is a priority for the government (World Bank, 2004).
A significant change to the natural hydrological pattern of the basin occurred with the construction of the Tok-togul Reservoir in 1974. Because the timing of the March– September natural runoff peak coincides with the irrigation season, substantial reservoir storage is not required to regu-late seasonal runoff. However, the aggressive expansion of irrigation during Soviet times created a need for multi-year storage to store excess flows in wet years to supplement dry year flows. Toktogul Reservoir was constructed on the Naryn River (the principal tributary to the Syr Darya) to serve this purpose. The reservoir is the largest storage facility in the Aral Sea basin and has a total capacity of 19.5 km3(14 km3 active storage). The construction of the reservoir was ac-companied by the building of four smaller downstream reser-voirs and power plants to maximize electricity generation from reservoir releases. The five facilities, commonly called the Naryn Cascade, have a combined generation capacity of 2870 MW (World Bank, 2004).
Toktogul Reservoir and the Naryn Cascade are at the heart of a dispute over management of the Syr Darya River that has existed since the downfall of the Soviet Union in 1991. In the Soviet system, the reservoir was operated to benefit irrigated agriculture and power was produced incidentally as flows were released to meet downstream demands. In 1992, the Central Asian riparian states agreed to continue Soviet water allocation policies and established the Interstate Com-mission for Water Coordination (ICWC) to oversee the allo-cation process. However, the new system immediately came under strain as the competing interests of the newly indepen-dent states emerged. Toktogul Reservoir came under the con-trol of Kyrgyzstan, which is less dependent on irrigated agri-culture and lacks fossil fuel resources for energy generation. Kyrgyzstan had been supplied with fossil fuels under the So-viet system but found itself in the position of having to pur-chase energy supplies on world markets after 1991. Kyrgyzs-tan turned to hydropower for its own energy needs, which peak in winter because of heating demands, placing the coun-try’s operational objectives in direct opposition to those of its downstream neighbors; Kyrgyzstan would prefer to store summer peak flows for winter power generation, while the downstream countries would like winter releases minimized to conserve water for the summer season (Biddison, 2002; World Bank, 2004; Siegfried et al., 2007). Increased winter releases also cause flooding, as many of the downstream ir-rigation works are not built to handle high flows and ice in the river bed reduces winter conveyance capacity (Biddison, 2002).
In these circumstances of mutual distrust between the up-and downstream countries, global datasets up-and assimilation of radar altimetry hold great promise for increasing trans-parency, reducing forecast uncertainty, and increasing the speed at which forecasts can be developed and updated. Be-cause remotely-sensed data products are available to all, their increased use in the region has the potential to reduce distrust by providing a common base of information. The increasing availability of these products in real-time also has the poten-tial to accelerate the forecasting process so that water alloca-tion plans can be agreed upon earlier in the irrigaalloca-tion season.
3 Methods and data
3.1 River basin water balance modeling
Rainfall-runoff model (NAM)
Ensemble Kalman Filter Water allocation model (MikeBasin)
Reservoir level “best estimate”
Temperature Precipitation
PET
Modeled river dicharge
Irrigation requirements Raskin (1992) Reservoir releases
Reservoir level estimates
[image:4.595.55.284.67.218.2]Radar altimetry RR parameters
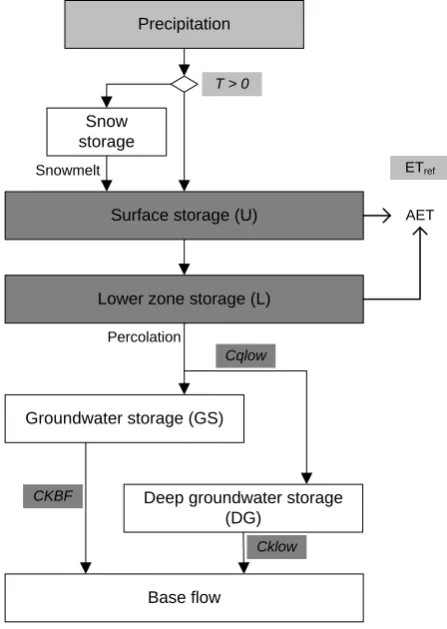
Fig. 2. Block diagram of the modeling and assimilation approach,
showing input data (left side), processing (center) and output data (right side). The input data in dark shading have been perturbed to create the ensembles. The processes on slanted shading only occur when there is altimetry data available.
daily time steps from 1 January 2000 to 31 December 2007. A modeling flow chart is presented in Fig. 2.
The NAM model (Nedbør-Afstrømningsmodel, Danish for rainfall-runoff model) is a lumped conceptual modeling system consisting of mass balance equations that account for the water content in four different storages representing processes occurring in the land phase of the hydrological cycle: snow storage, surface storage, lower soil zone stor-age and groundwater storstor-age (DHI, 2000). The minimum data requirements of the modeling system are precipitation, reference evapotranspiration and observed discharge. Daily mean temperature is also required if snowmelt contributes to runoff. A comparison of data requirements and performance of NAM with other lumped hydrological models is provided by Refsgaard et al. (1996). The four storages are typically modeled using a set of 17 parameters, about 10 of which are commonly used for model calibration.
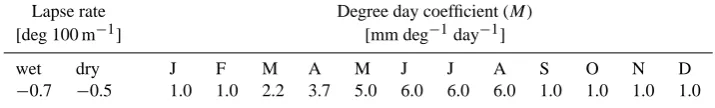
Due to the limited amount of observed in-situ river dis-charge data, it was impossible to achieve a unique and sta-ble calibration based on 10 free model parameters. More-over, we observed that overland flow does not significantly contribute to the hydrological regime in the Syr Darya river basin. A more robust version of NAM was developed us-ing only five free calibration parameters: two parameters scribing surface and soil moisture storage and the others de-scribing groundwater response times. The structure of this simplified version of NAM is shown in Fig. 3. Table 1 lists the parameters chosen to enforce this model structure. Over-land flow and interflow are effectively switched off by this choice of parameters. Instead of working with two ground-water reservoirs (as we decided to do), one could probably have obtained an equally good fit with an interflow com-ponent and one groundwater reservoir. However, given the large size of the subcatchments, we decided to represent all
Percolation Snowmelt
Snow storage
Surface storage (U)
Lower zone storage (L)
Groundwater storage (GS)
Deep groundwater storage (DG)
Base flow Precipitation
ETref
CKBF
Cklow Cqlow T > 0
[image:4.595.315.539.73.388.2]AET
Fig. 3. Structure of the rainfall-runoff model. Items on light
shad-ing are input data, those on dark shadshad-ing relate to the calibration parameters.
runoff processes by linear reservoirs. Because of its simplic-ity, the modeling approach is robust and appropriate given the general scarcity of observation data in the SDRB.
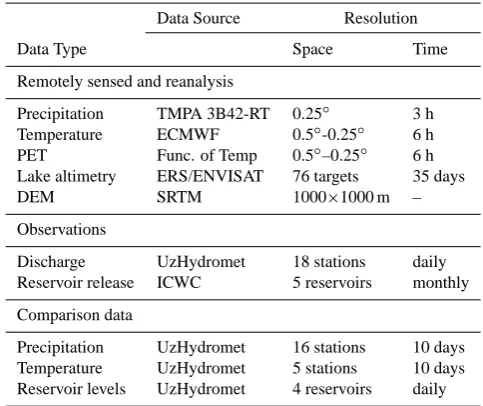
Precipitation falls as snow if the temperature is below 0 degrees Celsius and as liquid precipitation (PL) otherwise. Each single catchment is divided into 10 separate elevations zones of equal area and the precipitation discrimination is done for each individual elevation zone separately, using temperature lapse rates based on Tsarev et al. (1994). Snow melt (SM) is modeled using a simple degree-day approach:
SMpot=
M×T ,T >0 0,else
SM=min SS/1t,SMpot
(1)
Table 1. NAM parameters chosen to enforce the rainfall-runoff model structure shown in Fig. 3.
Parametera Description Units Value
CQOF Overland flow runoff coefficient – 0
CKIF Time constant for interflow hours 1e6
CK1,2 Time constants for routing overland flow hours 10
TOF Rootzone threshold value for overland flow – 0.999
TIF Rootzone threshold value for inter flow – 0.999
TG Rootzone threshold value for groundwater recharge – 0
aFor a detailed description of these parameters and their interaction the reader is referred to DHI (2000).
Table 2. Snowmelt parameters used in the rainfall-runoff model (NAM).
Lapse rate Degree day coefficient (M)
[deg 100 m−1] [mm deg−1day−1]
wet dry J F M A M J J A S O N D
−0.7 −0.5 1.0 1.0 2.2 3.7 5.0 6.0 6.0 6.0 1.0 1.0 1.0 1.0
surface storage (U in mm). The surface storage is depleted by evapotranspiration (ET). The ET rate is assumed to be equal to the reference ET rate. The surface storage has a maximum capacity (Umax, in mm), which is a calibration pa-rameter. If the surface storage is filled to maximum capacity, additional snow melt or liquid precipitation spills to the soil storage (L, in mm). A balance equation is solved for the soil storage:
dL
dt =SP−AET−PER (2)
The symbol SP indicates spills from the surface storage to the soil storage. Water in the soil storage is depleted by actual soil ET (AET) and percolation (PER). Actual soil ET and percolation are calculated as functions of soil water storage: AET=(ETref−ETU)·
L Lmax
(3)
PER=SP· L Lmax
(4)
where ETrefis the reference ET (mm day−1), ETU is the ET
drawn from the surface storage andLmax is the maximum soil storage (mm). Lmax is a calibration parameter. Per-colation flows to two parallel groundwater reservoirs which are conceptualized as shallow and deep aquifers, respectively (GS, DG, in mm). A balance equation is solved for each of the two groundwater reservoirs:
dGS
dt =Cqlow·PER−BFshallow dDG
dt =(1−Cqlow)·PER−BFdeep
(5)
Baseflow from the groundwater reservoirs to the river is cal-culated using a linear reservoir approach:
BFshallow=CKBF1 ·GS BFdeep=CKlow1 ·DG
(6)
where CKBF and CKlow are the response times of the two linear reservoirs (days). The response times as well as the factor Cqlow, which governs the partition of percolation be-tween the shallow and deep aquifers, are calibration param-eters. Rainfall-runoff processes are thus simulated using a very simple approach with five calibration parameters only:
Umax,Lmax, CKBF, CKlow and Cqlow.
[image:5.595.118.476.240.294.2]while those with 3–7 years of discontinuous data were used for validation. Prediction catchments are defined as those lo-cated in runoff-generating areas, where no discharge data are available. In total there were 9 calibration catchments, 9 val-idation catchments, 14 prediction catchments and 60 inactive catchments. Semi-automatic calibration was carried out for the calibration catchments.
The Mike Basin river network consists of nodes and reaches. The catchments dewater into the river network at catchment nodes. The water transfer from one node to the next is instantaneous, i.e. at every node a simple water bal-ance equation is solved. The only nodes that can store water temporally are the reservoir nodes. Irrigation sites are intro-duced into the model as water demand nodes. Figure 1 shows the Mike Basin river network layout.
Information on the reservoirs was obtained from the Sci-entific Information Council of the Interstate Commission for Water Coordination in Central Asia (ICWC, 2009). The reservoirs in the Syr Darya River Basin are implemented as rule curve reservoirs. The reservoir water balance is cal-culated from inflow, outflow and losses. Only evaporation losses were considered in this study and were computed using reference evapotranspiration. The level-area-volume curve is used to convert volume to water level. This in-formation was provided by UzHydromet. Once the water level reaches the flood control level, all additional water is instantaneously routed downstream. Historical observed re-lease time series are available from the ICWC (2009). The observed releases were prescribed as minimum downstream release time series for the various reservoirs over the histor-ical simulation period. In real-time application mode of the model, these releases are replaced by planned/projected re-leases.
The irrigation areas in the Syr Darya River Basin are lumped into 6 major demand sites, following Raskin et al. (1992). These are High Naryn, Fergana, Mid Syr, Chakir, Artur and Low Syr. Irrigation areas and crop distributions were taken from Raskin et al. (1992). Irrigation water de-mand was calculated using the FAO-56 methodology (Allen, 2000). Growing season time periods were estimated based on FAO-56. During the growing season, the soil water balance is calculated on a daily time step from precipitation, crop evap-otranspiration and irrigation for each demand site. Precipi-tation is taken from the TMPA product (see below) and crop evapotranspiration is calculated using the FAO dual crop co-efficient approach and reference ET. Irrigation abstractions are calculated using the standard FAO-56 irrigation model. This model assumes that irrigation is triggered if the soil ter content decreases below 50% of the readily available wa-ter. Soil water contents at field capacity and wilting point were uniformly set to 0.15 and 0.05 respectively. A total loss fraction of 0.3 was generally assumed for all demand sites.
3.2 Data assimilation
The Ensemble Kalman Filter (EnKF) has become a popular data assimilation technique in many environmental model-ing applications because of its ease of implementation and its computational efficiency (Evensen, 2003). In the EnKF approach, the covariance matrix used in a traditional Kalman Filter is computed from an ensemble of model states. The mean of the ensemble is assumed to be the “truth” and the model error (or covariance) is represented by the covariance of the ensemble members. The ensemble members are then updated according to model and observation errors, as in a traditional Kalman Filter. Let xf be the ns×ne matrix of model forecasts containing ns model states (number of reser-voirs with altimetry measurements in our case) for ne ensem-ble members:
xf=
xf1,...,xfne (7)
wherexf1. . . xfne are the forecast vectors containing all state variables for each ensemble member. The model error co-variance Pfis
Pf=xf−x¯f xf−x¯fT (8)
where the overbar denotes an average over the ensemble. The model states of every ensemble member are then updated with the Kalman update equation
xai =xfi+Kyi−Hxfi, (9)
wherexai is the vector of updated model states for the ith ensemble member, H is an no×ns operator (no is the number of observations) that transforms the states into observation space andyis an no×1 vector that contains the observations for every state variable. The Kalman gain K is defined by
K=PHTHPHT+R
−1
(10) where R is the no×no error covariance matrix of the obser-vations. A normally distributed, uncorrelated distribution is assumed for the observation errors.
1. Uncertainty of the precipitation product used to force the rainfall-runoff model. The study area is large and has a complex topography. Comparisons between different precipitation products and the few available ground stations have shown significant deviations. Each ensemble member is therefore forced with a different precipitation input. The precipitation time series are generated using the relative error specified for our pre-cipitation product (TRMM-3B42, see below). The error in the precipitation product is assumed to be normally distributed.
2. The calibration parameters of the subcatchment rainfall-runoff models are highly uncertain. The ensemble members were run with individual random realizations of the 5 calibration parameters. All 5 parameters were assumed to be log-normally distributed around the cal-ibration result and the sampling standard deviation was set to 0.6 log10 units for Umax and Lmax, 0.2 log10 units for CKBF and CKlow, and 0.1 log10 units for Cqlow, where Cqlow is expressed in percent. For the linear reservoir time constants, the log-normal distribu-tion is the natural choice, as they are related to aquifer transmissivities, which are typically log-normally dis-tributed. For the size of the storage compartmentsU
andL, in the absence of field data, it is not clear whether normal or log-normal distribution is more appropriate. The log-normal distribution has the advantage of guar-anteed non-negativity.
3. The irrigated areas and crop distributions at the 6 ma-jor demand sites are uncertain because the information from Raskin et al. (1992) is fairly old and probably does not match the present configuration of the irrigation dis-tricts. The ensemble members were therefore run with irrigation areas which were multiplied with a normally distributed random number with mean of 1 and a stan-dard deviation of 0.2.
3.3 Input and forcing datasets
All input and forcing datasets were obtained from re-mote sensing and reanalysis datasets. Table 3 provides an overview of the various data sources used in this study.
The digital elevation model (DEM) of the area was ob-tained from the Shuttle Radar Topography Mission (SRTM). The mission is described by Rabus et al. (2003), and an as-sessment of its results is provided by Rodriguez et al. (2006). The data with a 3 arc second (90 m) spatial resolution were resampled to 1 km spatial resolution. The 1 km DEM was used to delineate the river network and the subcatchments using automatic GIS routines.
[image:7.595.307.549.96.299.2]The Tropical Rainfall Measuring Mission (TRMM) Mul-tisatellite Precipitation Analysis (TMPA; Huffman et al., 2007) was used as the data source for precipitation in the
Table 3. Source and spatio-temporal resolution of the various datasets used in the model.
Data Source Resolution
Data Type Space Time
Remotely sensed and reanalysis
Precipitation TMPA 3B42-RT 0.25◦ 3 h Temperature ECMWF 0.5◦-0.25◦ 6 h PET Func. of Temp 0.5◦–0.25◦ 6 h Lake altimetry ERS/ENVISAT 76 targets 35 days DEM SRTM 1000×1000 m –
Observations
Discharge UzHydromet 18 stations daily Reservoir release ICWC 5 reservoirs monthly
Comparison data
Precipitation UzHydromet 16 stations 10 days Temperature UzHydromet 5 stations 10 days Reservoir levels UzHydromet 4 reservoirs daily
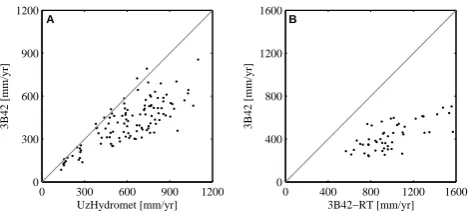
Syr Darya basin. The 3B42 research product was found suit-able because of its temporal and spatial resolution (3 h and 0.25◦, respectively) and the incorporation of surface obser-vation data. The TMPA rainfall estimates have been vali-dated in diverse regions, e.g. USA (Villarini et al., 2007), Argentina (Su et al., 2008) and Brazil (Collischonn et al., 2008). The 3B42 product comes as a 3-hourly product and includes pixel-based uncertainty estimates (standard devia-tions). The 3B42 product showed significantly lower itation amounts than observed at the available ground precip-itation stations (Fig. 4a). Moreover, water balance calcula-tions resulted in time-accumulated runoff coefficients as high as 0.9 for some subcatchments, which are clearly unrealis-tic. For the application of the model in real-time mode, the 3B42 product was compared with the TMPA real time prod-uct, 3B42-RT. For the period of comparison (October 2008 to December 2009), precipitation over the subcatchments of the Syr Darya river basin from 3B42-RT was 2.4 times higher than the precipitation calculated from 3B42 (Fig. 4b). Both rainfall products are based on satellite data and thus subject to large uncertainties. One possible solution to the problem of precipitation bias is to include a precipitation scaling fac-tor as an adjustable model parameter. However, we decided to adopt the overall precipitation amount from 3B42-RT and scaled the 3B42 product with a factor of 2.4, because the resulting time-accumulated runoff coefficients were on the order of 0.3, which is a realistic value for semi-arid moun-tainous areas.
0 300 600 900 1200 0
300 600 900 1200
UzHydromet [mm/yr]
3B42 [mm/yr]
A
0 400 800 1200 1600
0 400 800 1200 1600
3B42−RT [mm/yr]
3B42 [mm/yr]
[image:8.595.50.286.62.169.2]B
Fig. 4. Comparison of precipitation datasets. (A) Mean observed
annual precipitation at 16 stations and corresponding pixel from 3B42 research product. (B) Mean catchment precipitation from real time and research 3B42 products.
which includes 2-m temperature, was used instead (ECMWF, 2009). The data are available in near real time and can thus be used in both historical and real-time mode. It has a tem-poral resolution of 6 h (00:00, 06:00, 12:00 and 18:00 UTC) and a spatial resolution of 0.5◦up to 2006, and 0.25◦ there-after. The temperature fields were averaged over daily pe-riods, with a local time correction to the median longitude of the Syr Darya basin (70◦E), i.e. UTC+06:00. The pixel-wise daily mean temperature was then area-averaged over the catchments. The mean catchment elevation was used as the reference elevation when extrapolating the temperature to the different elevation zones in the catchment.
Input data for reference ET calculation based on the Penman-Monteith equation were not available. Reference ET was therefore computed from temperature using Harg-reaves equation (Allen et al., 1998):
ETref=0.0023(Tmean+17.8)(Tmax−Tmin)0.5·Ra (11) where Tmean is defined as the daily average of Tmax and Tmin(not the average of all available temperature measure-ments) andRa is the extraterrestrial radiation (converted to mm day−1using the latent heat of vaporization) for the cor-responding Julian day and latitude. Hargreaves et al. (2003) present a comprehensive evaluation of the performance of Eq. (11). A temperature averaging period above 5 days is recommended; although some water resource studies (e.g. the IWMI World Climate Atlas) use 10-day temperature av-erages (Hargreaves et al., 2003). The ETreffields were calcu-lated daily, then averaged over 10-day periods, and the result-ing values area-averaged over the different catchments. Fig-ure 5 presents a summary comparison between the various remote sensing forcing products and different in-situ control points.
3.4 Radar altimetry
Satellite radar altimetry was initially used in order to study the marine geoid and ocean dynamics (Rapley, 1990). How-ever, over the past two decades different research groups have
1 2 3 4 5 6 7 8 9 10 11 12
0 50 100
1 2 3 4 5 6 7 8 9 10 11 12
0 50 100 150
Average monthly precipitation [mm]
1 2 3 4 5 6 7 8 9 10 11 12
0 50 100 150
−20 0 20 UzH
3B42
UzH ECMWF
−20 0 20 40
Average 10−day temperature [ºC]
[image:8.595.311.546.64.199.2]−10 0 10 20
Fig. 5. 3B42 average monthly precipitation and ECMWF 10-day
average temperatures against observed (UzHydromet) data at three locations (see Fig. 1 for locations).
derived inland water heights from space-based radar altime-try (e.g. Cazenave et al., 1997; Berry et al., 2005; Cretaux et al., 2006). In this study, altimetry data re-tracked by the Earth and Planetary Remote Sensing Laboratory (EAPRS) over four large reservoirs were assimilated into the Mike Basin model in order to update the water levels of the reser-voirs. The data used are derived from the ERS-2 and EN-VISAT satellites, which cover 82◦N to 82◦S and have re-peat cycles of 35 days. The altimetry data re-tracked by the EAPRS lab provide water level time series over a large num-ber of inland water bodies in the Syr Darya River basin. In to-tal, 39 usable ERS-2 targets and 37 usable ENVISAT targets were identified over rivers and lakes in the basin, but only those over the Toktogul, Chardara, Kayrakkum and Charvak Reservoirs (Fig. 1) were assimilated into the model. Frap-part et al. (2006) report an accuracy of 0.25–0.53 m for the Radar Altimeter 2 (on board of ENVISAT) over lake targets in the Amazon basin. We found slightly lower precisions for the reservoirs in the Syr Darya, when comparing historical in-situ water levels and radar altimetry (Table 4). However, compared to the typical seasonal variation of the water lev-els in the reservoirs (between 7 and 50 m, see Table 4), the standard errors of the altimetry time series are small.
4 Results
Table 4. Altimetry targets over each reservoir. The altimetry error is reported here as the RMSE of the altimetry time series with respect
to the historical in-situ level time series. Level range and volume range denote the typical seasonal water level and volume variations in the reservoirs (derived from historical records). Residence time is the mean residence time in the reservoir.
Reservoir Satellite RMSE Level rangea Volume rangeb Residence time
[m] [m] [106m3] [days]
Chardara ERS 0.63, 0.85 11.5 4700 91
ENVISAT 0.37, 0.48
Toktogul ERS 0.68 57.5 14 000 377.95
ENVISAT 0.89
Charvak ERS 1.81 55.4 1580 83.7
ENVISAT 1.42
Kayrakkum ERS 0.61 7.7 2600 46.1
aObserved during the period 2000–2008.
bICWC (2009).
20000 2001 2002 2003 2004 2005 2006 2007 2008 100
200 300 400 500
Discharge [m
3/s]
2000 2001 2002 2003 2004 2005 2006 2007 2008 0
200
Precipitation [mm/day]
Discharge ensemble Observed discharge Precipitation
2000 2001 2002 2003 2004 2005 2006 2007 2008 −20
0 20
Temperature [ºC]
2000 2001 2002 2003 2004 2005 2006 2007 20080 200 400 600 800
SWE [mm]
Simulated snow water equivalent Temperature
Fig. 6. Rainfall-runoff modeling results in catchment 69.
large uncertainty and possible bias of the precipitation forc-ing; (2) coarse spatial resolution of the rainfall-runoff model. The average subcatchment size is 6700 km2, which is large considering the complexity of this mountain region. How-ever, refining the subcatchments is difficult because calibra-tion data for the rainfall-runoff model are scarce. (3) Net melting of glaciers and ice is not considered in the model. (4) Un-modeled abstractions from the rivers within the sub-catchments. The representation of the water users is based on Raskin et al. (1992) and consists of six aggregated ma-jor demand sites. Relatively minor abstractions in the up-stream subcatchments may therefore not be accurately mod-eled. Moreover, the surface water abstraction has likely changed significantly since the early 1990s.
If the river basin water balance model is run in “no-assimilation” mode and is not informed via assimilation of radar altimetry, its utility for water resources management applications is limited due to the weak predictive capabil-ity of the rainfall-runoff model. Performance in the no-assimilation run is particularly limited for the Kayrakkum
[image:9.595.51.285.285.426.2]Table 5. Results of the rainfall-runoff model calibration. The columnR2contains the coefficient of determination of the rainfall-runoff model for each subcatchment.
Catchment Station ID Umax [mm] Lmax [mm] CKBF [hr] CKlow [hr] Cqlow [%] R2 WBEa[%]
Calibration 2 16 055 10 100 480 8760 20 0.52 9
47 16 169 40 400 960 8760 30 0.62 3
55 16 176 40 400 720 8760 20 0.67 2
61 16 193 40 400 480 8760 10 0.69 97
145 16 198 10 100 960 8760 20 0.28 −25
62 16 202 40 400 480 8760 10 0.59 61
64 16 230 40 400 480 8760 10 0.74 34
148 16 279 10 100 960 8760 30 0.80 −13
147 16 290 10 100 960 8760 30 0.79 −12
Validation 8 16 059 10 100 720 8760 20 0.45 27
12 16 121 10 100 720 8760 20 0.57 5
14 16 127 10 100 720 8760 20 0.51 −43
15 16 134 10 100 720 8760 20 0.43 −3
16 16 135 10 100 720 8760 20 0.42 −37
18 16 136 10 100 720 8760 20 0.66 −28
9 16 146 10 100 720 8760 20 0.58 −36
75 16 205 10 100 720 8760 20 0.44 55
49 16 510 10 100 720 8760 20 0 9
aWater balance error.
Table 6. Reservoir water level residuals with and without assimilation of radar altimetry data. All numbers are given in meters.
Toktogul Chardara Kayrakkum Charvak Meana
DA mean(res) −3.07 −0.46 3.08 −0.87 1.87
std(res) 5.33 1.15 5.26 15.11 6.71
No DA mean(res) −9.57 −3.18 3.62 −2.35 4.68
std(res) 8.49 3.38 5.85 23.59 10.33
a: Mean of absolute residuals across all reservoirs.
moderate increase up to about day 40 after assimilation is followed by more pronounced increases after day 40. The orbit repeat cycle of Envisat is 35 days and assimilation of radar altimetry can thus keep the model error at a moderate level.
5 Discussion and conclusions
A modeling approach using only remotely-sensed and re-analysis data has been developed and applied to the Syr Darya River Basin. The ability of the river basin model to predict reservoir water levels in “no-assimilation” mode was limited. The generally low model performance can be due to inaccuracies in the RS input data, to the simplifications inherent in model structure (e.g. monthly snowmelt coeffi-cient, lack of a glacial accumulation/ablation model), or to un-modeled dynamics in the hydrology of the basin (e.g.
variation of irrigation water demand). Limited availability of in-situ discharge data for model calibration required that high resolutionRSdata be aggregated over very large areas (sometimes as large as 37 000 km2). If more discharge sta-tions were available, smaller subcatchments could be used and the high spatial resolution of the data products would have been better exploited. While these limitations are se-vere, they are fairly typical for the situation in many large, complex and poorly gauged river basins on the planet.
[image:10.595.145.453.388.460.2]2000 2001 2002 2003 2004 2005 2006 2007 860
880 900
Toktogul
2000 2001 2002 2003 2004 2005 2006 2007
242 244 246 248 250 252
Chardara
2000 2001 2002 2003 2004 2005 2006 2007
335 340 345
Kayrakkum
2000 2001 2002 2003 2004 2005 2006 2007
750 800 850
Charvak
[image:11.595.329.525.65.262.2]Assimilation No assimilation Observed Level
Fig. 7. Reservoir level simulation for the historical period (in mamsl): with assimilation of radar altimetry (black), without as-similation of radar altimetry (red), and observed in-situ water levels (blue) for an ensemble size of 50. The shaded area indicates the 2.5 and 97.5% quantile range of the ensemble, and the crosses are altimetry measurements. For interpretation of the color reference in this figure, the reader is referred to the electronic version of this article.
Kalman filter implementation used in this study has reason-able computational requirements, with an ensemble size of 50 resulting in a good trade-off between model performance and computation time.
The accuracy of radar altimetry measurements depends on several factors: the topography of the area, the along-track extent of the target, the ability to correct the signal for atmo-spheric effects, etc. For this site we report accuracies ranging from 0.37 m at Chardara Reservoir to 1.8 m at Charvak (Ta-ble 4). Charvak has by far the smallest surface area, making it a difficult target for the automatic system used to retrieve the altimetry time series. We believe that the accuracy of the altimetry product is encouraging, given the difficult charac-teristics of the targets.
The modeling approach can be exploited to its full poten-tial, if the modeling system is run in real time. A near real time (NRT) version of the model has been implemented and results are made available on the internet (http://tethys.eaprs. cse.dmu.ac.uk/RiverLake/info/river modeling). The NRT model uses the real time precipitation product (3B42-RT) in-stead of the research product (3B42). The 3B42-RT product does not incorporate gauge data, but becomes available ca.
0 25 50 75 100
0 2 4 6 8 10 12 14 16
Days after last assimilation
Residual [m]
Charvak Toktogul Kayrakkum Chardara
Fig. 8. Average absolute residuals of reservoir level after
assimila-tion of altimetry data.
6 h after observation (see Huffman et al., 2007; Huffman, 2008, 2009). The temperature data are available 7 h after observation. Updated reservoir levels are computed by the model with a total real-time delay of 2 days. The model has been operated in NRT mode throughout the year 2010. Due to a recent major orbit change of the ENVISAT mission, real time altimetry data are currently not available and the opera-tion of the NRT model has been suspended.
It is important to recognize that the assimilation of reser-voir water levels violates the water balance in the system. In the state updating procedure (Eq. 9) water is simply added or abstracted from the reservoirs. Thus, the model is not suitable for long-term water resources scenario calculations, where mass balance has to be maintained. The applica-tion scenario for the tool is medium-term forecasting. The model is able to provide “best estimates” of reservoir lev-els (and thus water availability) with lead times of a few months. These best estimates are based on a hydrological model and the most recent available water levels. The model can also assimilate real-time water level data from in-situ sta-tions. However, in-situ data typically become available at later times. Moreover, remotely sensed water levels have the advantage of being accessible to all interested stakeholders and countries and can thus be considered as entirely impar-tial information.
[image:11.595.50.284.66.328.2]runs. We generally assume that a measurement of one model state (water level in one of the reservoirs) does not contain in-formation about the water level in the other reservoirs, i.e. we assume that H in Eq. (9) is an identity matrix. This assump-tion is reasonable, because the system is highly regulated. However, apart from the reservoir targets, Pereira-Cardenal et al. (2009) identified 37 ENVISAT altimetry targets on river cross sections available for the Syr Darya. These targets may show correlation with one or several of the simulated reser-voirs and can be used for real-time modeling in the future, using a modified Ensemble Kalman filtering approach. Al-though the EnKF application presented in this study is fairly simplistic, the EnKF was chosen over simpler alternatives such as state insertion or relaxation because of its flexibility and efficiency in combining models and measurements. The EnKF itself does not take much CPU time in our case, be-cause the river basin water balance model is very fast. The bulk of the simulation time is taken for the computation of the runoff ensembles. Computing the runoff ensembles would be necessary for any approach that uses both model and mea-surement uncertainty, thus also for a relaxation approach.
Because the altimetry data become available every 35 days, one important objective is to avoid that the model drifts too far between assimilation times. In a modification of the presented approach, one could distribute the innovation (dif-ference between model forecast and measurement) in a time window around the time of observation and assimilate into the model.
The data assimilation approach described here could bene-fit the annual water allocation process in the Syr Darya basin by providing an efficient and transparent technology for up-dating hydrological forecasts in real time. The real-time ca-pability could be used together with hydro-economic models of the basin (Cai et al., 2002) in real-time, adaptive water re-sources management. In the current management setup, the riparian states are supposed to agree on an allocation plan at the beginning of April; however, agreement is often de-layed until well into the growing season, creating significant uncertainties for irrigation planning and increasing tensions between the riparian states. An obstacle to co-operation is the deteriorated state of the hydro-meteorological monitor-ing network that existed in Soviet times (Schar et al., 2004). In addition, national hydro-meteorological agencies now re-sponsible for data collection are reluctant to share data and the annual process of data collection and forecasting can be delayed by poor communications infrastructure (Biddison, 2002). Because of all these issues, the real-time forecasting tool developed in this study has the potential to contribute to more efficient water resources management in the region.
In summary, radar altimetry data over inland water bodies are an innovative data source for hydrological applications. It can be used to update hydrological models in real time and can significantly enhance science-based decision support to water resources managers, particularly in poorly gauged river basins.
Acknowledgements. The TMPA data were provided by the
NASA/Goddard Space Flight Center’s Laboratory for Atmospheres and PPS, which develop and compute the TMPA as a contribution to TRMM. The ECMWF temperature data were obtained through the Danish Meteorological Institute; the authors would like to thank Thomas Lorenzen for his support in providing these data. We thank the International Research School of Water Resources (fiva) for sup-porting T. Siegfried’s stay at the Technical University of Denmark. We thank Guy J.-P. Schumann and one anonymous referee for their thorough and detailed reviews of the manuscript.
This work is part of the River & Lake Project (Performance Improvement and Data Assimilation into Catchment Models for the Exploitation of River and Lake Products from Altimetry, ESRIN Contract No. 21092/07/I-LG), work package 700.
Edited by: N. Verhoest
References
Allen, R. G.: Using the FAO-56 dual crop coefficient method over an irrigated region as part of an evapotranspiration intercompar-ison study, J. Hydrol., 229, 27–41, 2000.
Allen, R. G., Pereira, L. S., Raes, D., and Smith, M.: Crop evapo-transpiration: guidelines for computing crop water requirements, Food and Agriculture Organization of the United Nations, Irriga-tion and Drainage Paper 56, Rome, 1998.
Alsdorf, D., Birkett, C., Dunne, T., Melack, J., and Hess, L.: Wa-ter level changes in a large Amazon lake measured with space-borne radar interferometry and altimetry, Geophys. Res. Lett., 28, 2671–2674, 2001.
Andersen, J., Dybkjaer, G., Jensen, K. H., Refsgaard, J. C., and Rasmussen, K.: Use of remotely sensed precipitation and leaf area index in a distributed hydrological model, J. Hydrol., 264, 34–50, 2002.
Arulampalam, M. S., Maskell, S., Gordon, N., and Clapp, T.: A tutorial on particle filters for online nonlinear/non-Gaussian Bayesian tracking, IEEE T. Signal Proces., 50, 174–188, 2002. Bastiaanssen, W. G. M., Menenti, M., Feddes, R. A., and Holtslag,
A. A. M.: A remote sensing surface energy balance algorithm for land (SEBAL) – 1. Formulation, J. Hydrol., 213, 198–212, 1998. Berry, P. A. M., Garlick, J. D., Feeman, J. A., and Mathers, E. L.: Global inland water monitoring from multi-mission altimetry, Geophys. Res. Lett., 32, L16401, doi:10.1029/2005GL022814, 2005.
Biddison, J. M.: The study on water energy nexus in Central Asia, Asian Development Bank, Manila, 2002.
Birkett, C. M.: Synergistic remote sensing of Lake Chad: Variabil-ity of basin inundation, Remote Sens. Environ., 72, 218–236, 2000.
Bjerklie, D. M., Dingman, S. L., Vorosmarty, C. J., Bolster, C. H., and Congalton, R. G.: Evaluating the potential for measuring river discharge from space, J. Hydrol., 278, 17–38, 2003. Boegh E., Thorsen, M., Butts, M. B., Hansen, S., Christiansen, J.
Brunner, P., Franssen, H. J. H., Kgotlhang, L., Bauer-Gottwein, P., and Kinzelbach, W.: How can remote sensing contribute in groundwater modeling?, Hydrogeol. J., 15, 5–18, 2007. Bucknall, J., Klytchnikova, I., Lampietti, J., Lundell, M., Scatasta,
M., and Thurman, M.: Irrigation in central asia: Social, eco-nomic, and environmental considerations, World Bank, Wash-ington DC, 2003.
Cai, X. M., McKinney, D. C., and Lasdon, L. S.: A framework for sustainability analysis in water resources management and application to the Syr Darya Basin, Water Resour. Res., 38, 1085, doi:10.1029/2001WR000214, 2002.
Calmant, S., Seyler, F., and Cretaux, J. F.: Monitoring Continental Surface Waters by Satellite Altimetry, Surv. Geophys., 29, 247– 269, 2008.
Campo, L., Caparrini, F., and Castelli, F.: Use of multi-platform, multi-temporal remote-sensing data for calibration of a dis-tributed hydrological model: an application in the Arno basin, Italy, Hydrol. Process., 20, 2693–2712, 2006.
Cazenave, A., Bonnefond, P., Dominh, K., and Schaeffer, P.: Caspian sea level from TOPEX-POSEIDON altimetry: Level now falling, Geophys. Res. Lett., 24, 881–884, 1997.
Collischonn, B., Collischonn, W., and Tucci, C. E. M.: Daily hy-drological modeling in the Amazon basin using TRMM rainfall estimates, J. Hydrol., 360, 207–216, 2008.
Cretaux, J. F. and Birkett, C.: Lake studies from satellite radar al-timetry, C. R. Geosci., 338, 1098–1112, 2006.
DHI: NAM Technical Reference and Model Documentation, DHI – Water & Environment, Denmark, 2000.
DHI: Mike Basin – River Basin Management in GIS,
avail-able at: http://www.dhigroup.com/Software/WaterResources/
MIKEBASIN.aspx, last access: May 2009.
ECMWF: Operational Surface Analysis Data Set, available at: http://ecmwf.int/products/data/archive/descriptions/od/oper/ an/sfc/index.html, last access: April 2009.
Evensen, G.: The Ensemble Kalman Filter: theoretical formula-tion and practical implementaformula-tion, Ocean Dynam. 53, 343–367, 2003.
Evensen, G.: Data Assimilation: the Ensemble Kalman Filter, Springer, Berlin, Germany, 2007.
Francois, C., Quesney, A., and Ottl´e, C.: Sequential assimilation of ERS-1 SAR data into a coupled land surface-hydrological model using an extended Kalman filter, J. Hydrometeorol. 4, 473–487, 2003.
Franssen, H. J. H. and Kinzelbach, W.: Real-time groundwater flow modeling with the Ensemble Kalman Filter: Joint estimation of states and parameters and the filter inbreeding problem, Water Resour. Res., 44, W09408, doi:10.1029/2007WR006505, 2008. Frappart, F., Calmant, S., Cauhope, M., Seyler, F., and Cazenave,
A.: Preliminary results of ENVISAT RA-2-derived water levels validation over the Amazon basin, Remote Sens. Environ., 100, 252–264, 2006.
Getirana, A. C. V., Bonnet, M. P., Calmant, S., Roux, E., Rotunno, O. C., and Mansur, W. J.: Hydrological monitoring of poorly gauged basins based on rainfall-runoff modeling and spatial al-timetry, J. Hydrol., 379, 205–219, 2009.
Gondwe, B. R. N., Hong, S. H., Wdowinski, S., and
Bauer-Gottwein, P.: Hydrologic Dynamics of the
Ground-Water-Dependent Sian Ka’an Wetlands, Mexico, Derived from InSAR and SAR Data, Wetlands, 30, 1–13, 2010.
Grayson, R. B., Bloschl, G., Western, A. W., and McMahon, T. A.: Advances in the use of observed spatial patterns of catchment hy-drological response, Adv. Water Resour., 25, 1313–1334, 2002. Hargreaves, G. H. and Allen, R. G.: History and evaluation of
Harg-reaves evapotranspiration equation, J. Irrig. Drain. E-ASCE, 129, 53–63, 2003.
Hinderer, J., Andersen, O., Lemoine, F., Crossley, D., and Boy, J. P.: Seasonal changes in the European gravity field from GRACE: A comparison with superconducting gravimeters and hydrology model predictions, J. Geodyn., 41, 59–68, 2006.
Huffman, G. J.: TRMM and Other Data Precipitation Data Set Doc-umentation, Laboratory for Atmospheres, NASA Goddard Space Flight Center and Science Systems and Applications, Inc., avail-able at: ftp://precip.gsfc.nasa.gov/pub/trmmdocs/3B42 3B43 doc.pdf, 2008.
Huffman, G. J.: Readme for Accessing Experimental
Real-Time TRMM Multi-Satellite Precipitation Analysis (TMPA-RT) Data Sets, Laboratory for Atmospheres, NASA Goddard Space Flight Center and Science Systems and Applications, Inc., available at: ftp://precip.gsfc.nasa.gov/pub/trmmdocs/rt/ 3B4XRT README.pdf, 2009.
Huffman, G. J., Adler, R. F., Bolvin, D. T., Gu, G. J., Nelkin, E. J., Bowman, K. P., Hong, Y., Stocker, E. F., and Wolff, D. B.: The TRMM multisatellite precipitation analysis (TMPA): Quasi-global, multiyear, combined-sensor precipitation estimates at fine scales, J. Hydrometeorol., 8, 38–55, 2007.
Interstate Commission for Water Coordination of Central Asia: Por-tal of Knowledge for Water and EnvironmenPor-tal Issues in Central Asia, available at: http://www.cawater-info.net/analysis/water/ toktogul e.htm, last access: February 2009.
Jiang, L. and Islam, S.: Estimation of surface evaporation map over southern Great Plains using remote sensing data, Water Resour. Res., 37, 329–340, 2001.
Lakshmi, V.: The role of satellite remote sensing in the Prediction of Ungauged Basins, Hydrol. Process., 18, 1029–1034, 2004. Madsen, H.: Automatic calibration of a conceptual rainfall-runoff
model using multiple objectives, J. Hydrol., 235, 276–288, 2000. Madsen, H. and Skotner C.: Adaptive state updating in real-time river flow forecasting – a combined filtering and error forecasting procedure, J. Hydrol., 308, 302–312, 2005.
McLaughlin, D.: Recent Developments in Hydrologic Data Assim-ilation, Rev. Geophys., 33, 977–984, 1995.
Micklin, P.: The Aral Sea disaster, Annu. Rev. Earth Pl. Sc., 35, 47–72, 2007.
Molteni, F., Buizza, R., Palmer, T. N., and Petroliagis, T.: The ECMWF ensemble prediction system: Methodology and vali-dation, Q. J. Roy. Meteor. Soc., 122, 73–119, 1996.
Montanari, M., Hostache, R., Matgen, P., Schumann, G., Pfis-ter, L., and Hoffmann, L.: Calibration and sequential updating of a coupled hydrologic-hydraulic model using remote sensing-derived water stages, Hydrol. Earth Syst. Sci., 13, 367–380, doi:10.5194/hess-13-367-2009, 2009.
Neal, J., Schumann, G., Bates, P., Buytaert, W., Matgen, P., and Pappenberger, F.: A data assimilation approach to discharge esti-mation from space, Hydrol. Process., 23(25), 3641–3649, 2009. Parajka, J., Naeimi, V., Blschl, G., Wagner, W., Merz, R., and
Pereira-Cardenal, S. J., Riegels, N. D., and Bauer-Gottwein, P.: ENVISAT-ERS EXPLOITATION: Performance Improvement and Data Assimilation into Catchment Models for the Exploita-tion of River and Lake Products from Altimetry: The Syr Darya Case Study. European Space Agency, internal project report, ES-RIN Contract No. 21092/07/I-LG, work package 700, 2009. Rabus, B., Eineder, M., Roth, A., and Bamler, R.: The shuttle radar
topography mission - a new class of digital elevation models ac-quired by spaceborne radar, ISPRS J. Photogramm., 57, 241– 262, 2003.
Rapley, C.: Satellite Radar Altimeters, in: Microwave remote sensing for oceanographic and marine weather forecast mod-els, edited by: Vaughan, R. A., Kluwer Academic Publishers, Boston, 45–63, 1990.
Raskin, P., Hansen, E., Zhu, Z., and Stavisky, D.: Simulation of Water-Supply and Demand in the Aral Sea Region, Water Int., 17, 55–67, 1992.
Refsgaard, J. C. and Knudsen, J.: Operational validation and in-tercomparison of different types of hydrological models, Water Resour. Res., 32, 2189–2202, 1996.
Reichle, R. H., McLaughlin, D. B., and Entekhabi, D.: Hydrologic data assimilation with the ensemble Kalman filter, Mon. Weather Rev., 130, 103–114, 2002.
Rodriguez, E., Morris, C. S., and Belz, J. E.: A global assessment of the SRTM performance, Photogramm. Eng. Rem. S., 72, 249– 260, 2006.
Savoskul, O. S., Chevnina, E. V., Perziger, F. I., Vasilina, L. Y., Baburin, V. L., Danshin, A. I., Matyakubov, B. and Murakaev, R. R.: Water, climate, food, and environment in the Syr Darya Basin: contribution to the project ADAPT: Adaptation strate-gies to changing environments, available at: www.weap21.org/ downloads/AdaptSyrDarya.pdf, 2003.
Schar, C., Vasilina, L., Pertziger, F., and Dirren, S.: Seasonal runoff forecasting using precipitation from meteorological data assimi-lation systems, J. Hydrometeorol., 5, 959–973, 2004.
Schiemann, R., Luthi, D., Vidale, P. L., and Schar, C.: The precipi-tation climate of Central Asia – intercomparison of observational and numerical data sources in a remote semiarid region, Int. J. Climatol., 28, 295–314, 2008.
Shenzis, I. D.: On computation of snow coverage melting in the mountains by air temperature, Proceedings of SANIGMI 91(172), 35–42, 1985 (in Russian).
Siegfried, T. and Bernauer, T.: Estimating the performance
of international regulatory regimes: Methodology and
em-pirical application to international water management in the Naryn/Syr Darya basin, Water Resour. Res., 43, W11406, doi:10.1029/2006WR005738, 2007.
Stisen, S., Jensen, K. H., Sandholt, I., and Grimes, D. I. F.: A re-mote sensing driven distributed hydrological model of the Sene-gal River basin, J. Hydrol., 354, 131–148, 2008a.
Stisen, S., Sandholt, I., Norgaard, A., Fensholt, R., and Jensen, K. H.: Combining the triangle method with thermal inertia to esti-mate regional evapotranspiration - Applied to MSG-SEVIRI data in the Senegal River basin, Remote Sens. Environ., 112, 1242– 1255, 2008b.
Su, F. G., Hong, Y., and Lettenmaier, D. P.: Evaluation of TRMM Multisatellite Precipitation Analysis (TMPA) and its utility in hy-drologic prediction in the La Plata Basin, J. Hydrometeorol., 9, 622–640, 2008.
Tsarev, B. and Kovshenkova, E.: Spatial and temporal structure of temperature lapse rate in mountains of Central Asia, Proceedings of SANIGMI 147(228), 30–41, 1994 (in Russian).
Verlaan, M.: The Reduced Rank Square Root (RRSQRT) Kalman filter, available at: http://ta.twi.tudelft.nl/users/verlaan/RRSQRT. html, last access: March 2008.
Verlaan, M. and Heemink, A. W.: Tidal flow forecasting using re-duced rank square root filters, Stoch. Hydrol. Hydraul., 11, 349– 368, 1997.
Villarini, G. and Krajewski, W. F.: Evaluation of the research version TMPA three-hourly 0.25 degrees×0.25 degrees rain-fall estimates over Oklahoma, Geophys. Res. Lett., 34, L05402, doi:10.1029/2006GL029147, 2007.
Wdowinski, S., Amelung, F., Miralles-Wilhelm, F., Dixon, T. H., and Carande, R.: Space-based measurements of sheet-flow char-acteristics in the Everglades wetland, Florida, Geophys. Res. Lett., 31, L15503, doi:10.1029/2004GL020383, 2004.
Winsemius, H. C., Savenije, H. H. G., van de Giesen, N. C., van den Hurk, B. J. J. M., Zapreeva, E. A., and Klees, R.: Assess-ment of Gravity Recovery and Climate ExperiAssess-ment (GRACE) temporal signature over the upper Zambezi, Water Resour. Res., 42, W12201, doi:10.1029/2006WR005192, 2006.