www.hydrol-earth-syst-sci.net/19/691/2015/ doi:10.5194/hess-19-691-2015
© Author(s) 2015. CC Attribution 3.0 License.
On the sensitivity of urban hydrodynamic modelling to rainfall
spatial and temporal resolution
G. Bruni1, R. Reinoso2, N. C. van de Giesen1, F. H. L. R. Clemens1,3, and J. A. E. ten Veldhuis1
1Department of Water Management, Faculty of Civil Engineering and Geosciences, Delft University of Technology, Delft, the Netherlands
2Department of Geoscience and Remote Sensing, Faculty of Civil Engineering and Geosciences, Delft University of Technology, Delft, the Netherlands
3Deltares, Delft, the Netherlands
Correspondence to: G. Bruni ([email protected])
Received: 13 May 2014 – Published in Hydrol. Earth Syst. Sci. Discuss.: 6 June 2014 Revised: 29 November 2014 – Accepted: 23 December 2014 – Published: 4 February 2015
Abstract. Cities are increasingly vulnerable to floods gen-erated by intense rainfall, because of urbanisation of flood-prone areas and ongoing urban densification. Accurate infor-mation of convective storm characteristics at high spatial and temporal resolution is a crucial input for urban hydrologi-cal models to be able to simulate fast runoff processes and enhance flood prediction in cities. In this paper, a detailed study of the sensitivity of urban hydrodynamic response to high resolution radar rainfall was conducted. Rainfall rates derived from X-band dual polarimetric weather radar were used as input into a detailed hydrodynamic sewer model for an urban catchment in the city of Rotterdam, the Netherlands. The aim was to characterise how the effect of space and time aggregation on rainfall structure affects hydrodynamic mod-elling of urban catchments, for resolutions ranging from 100 to 2000 m and from 1 to 10 min. Dimensionless parameters were derived to compare results between different storm con-ditions and to describe the effect of rainfall spatial resolu-tion in relaresolu-tion to storm characteristics and hydrodynamic model properties: rainfall sampling number (rainfall resolu-tion vs. storm size), catchment sampling number (rainfall res-olution vs. catchment size), runoff and sewer sampling num-ber (rainfall resolution vs. runoff and sewer model resolution respectively).
Results show that for rainfall resolution lower than half the catchment size, rainfall volumes mean and standard de-viations decrease as a result of smoothing of rainfall gradi-ents. Moreover, deviations in maximum water depths, from 10 to 30 % depending on the storm, occurred for rainfall
res-olution close to storm size, as a result of rainfall aggrega-tion. Model results also showed that modelled runoff peaks are more sensitive to rainfall resolution than maximum in-sewer water depths as flow routing has a damping effect on in-sewer water level variations. Temporal resolution aggrega-tion of rainfall inputs led to increase in de-correlaaggrega-tion lengths and resulted in time shift in modelled flow peaks by several minutes. Sensitivity to temporal resolution of rainfall inputs was low compared to spatial resolution, for the storms anal-ysed in this study.
1 Introduction
It is therefore expected that the effect of spatial rainfall vari-ability on water flows is greater in urban catchments than in rural ones, where local variation of rainfall input is smoothed and delayed within the soil as a result of infiltration in pervi-ous areas (Obled et al., 1994, among others). Previpervi-ous stud-ies have shown that urban catchments, characterised by a fast hydrological response due to both low interception and infil-tration, are highly sensitive to small-scale spatial and tem-poral variability of the precipitation field (Bell and Moore, 2000; Einfalt et al., 2004; Gires et al., 2013) In the past, a lot of studies have addressed requirements and approaches for flood modelling (Schmitt et al., 2004; Balmforth and Dibben, 2006; Parker et al., 2011; Pathirana et al., 2011; Priest et al., 2011; Neal et al., 2012; Ozdemir et al., 2013). More recently, studies have shown the impact of rainfall variability on hy-drodynamic models outputs (Gires et al., 2012; Liguori et al., 2012; Vieux and Imgarten, 2012).
As resolutions of available data and models have in-creased, rainfall variability information at high resolution has become a critical component to study hydrological re-sponse in urban drainage systems using hydrological mod-els. Weather radars are more suitable for this purpose than rain gauge networks as they have better spatial coverage. Weather radars, such as S-band and C-band radars, are al-ready used by meteorological institutes worldwide in order to (indirectly) measure and predict precipitation at national and regional scales. Nonetheless, several studies have shown that the spatial resolution of operational radar network mea-surements is insufficient to meet the scale of urban hydrody-namics (Berne et al., 2004; Emmanuel et al., 2011; Schellart et al., 2012). Because of their relatively low cost and small size, X-band radars are ideally suited for local rainfall es-timation. These radars measure at high resolutions, both in space and time, and much closer to the ground than S- or C-band radars, which for operational purposes, cover large dis-tances and thus point higher especially at locations several tens of kilometres away from the radar sites. X-band radars have been tested locally and show better performances in catching the rapidly changing characteristics of intense rain-fall than rain gauges (Jensen and Pedersen, 2005). This is particularly the case when the distance between rain gauges is larger than 3 to 4 km (Wood et al., 2000).
The effects of radar spatial resolution on hydrological model outputs were addressed by Ogden and Julien (1994) by using length scales to characterise rainfall data and catch-ments, such as storm de-correlation length, grid size of rain-fall data, characteristic catchment length and grid size of the distributed runoff model. In their study, Ogden and Julien aimed to explain variability in hydrological responses based on rainfall and catchment characteristics, for two catchments of 30 and 100 km2, using fully distributed rainfall–runoff models. They recommended rainfall spatial resolution of 0.4 the square root of the watershed area, in order to avoid devia-tions in runoff flows. This corresponds to 1 km resolution for a 10 km2watershed, and 4 km resolution for a 100 km2
wa-tershed, as was also found by Segond et al. (2007). Several other studies on natural catchments also found that the in-fluence of rainfall resolution is directly related to the spatial variability of the storm and of the catchment that transforms rainfall into runoff (Krajewski et al., 1991; Winchell et al., 1998; Koren et al., 1999, among others).
The purpose of this paper was to analyse the sensitivity of urban hydrodynamic model outputs to spatial and temporal resolutions of rainfall inputs derived from weather radar data at intra-urban scale. Sensitivity was analysed according to spatial characteristics of rainfall and urban catchment prop-erties as well as model topology. Sensitivity was quantified using dimensionless parameters that describe relationships between rainfall resolution and spatial characteristics of the urban catchment, storm cells and model topology. Some of them were chosen according to their previous use by Odgen and Julien (1994). In this study rainfall estimates were used derived from dual-polarimetric X-band radar (IDRA), op-erated by Delft University of Technology (TU Delft) and located at CESAR, Cabauw Experimental Site for Atmo-spheric Research (Leijnse et al., 2010; Otto and Russchen-berg, 2011). A detailed urban hydrodynamic model for a catchment in the city of Rotterdam was chosen as a pilot case. Catchment conditions are representative of urban dis-tricts in lowland areas, especially delta cities, where almost half of the world population lives. Lowland catchments are characterised by flat terrain, therefore the mechanism domi-nating sewer flow is different from sloped terrain, where flow is driven by gravitation. This study aims at analysing the sensitivity of this urban hydrodynamic model to changes in rainfall spatial and temporal resolution. The study’s focus is on model uncertainty related to rainfall input; model perfor-mance is not tested here, since storms were virtually applied to the catchment, which did not allow a proper model vali-dation based on water level and flow observations. However, model geometry was strictly checked and model parameters were estimated based on literature values and experts opin-ion, so that the model is considered to be a reliable represen-tation of local pluvial response.
Results were used to address the following questions: – Does small-scale precipitation variability affect
hy-drological response and can a highly detailed semi-distributed model properly describe such a response? – Is high-resolution rainfall information required when a
storm does not present pronounced space–time variabil-ity?
– Does sensitivity of small-sized urban catchments to spa-tial and temporal variability of precipitation depend on catchment scale?
on radar spatial resolution requirements for urban drainage modelling of small-scale urban catchments at district level, i.e. up to 3 km2.
The paper is organised as follows. Section 2 presents the case study, hydrodynamic modelling approach and provides an analysis and description of rainfall fields used to conduct the sensitivity analysis. In Sect. 3 scale lengths are defined and then used to obtain a set of dimensionless parameters that will characterise relationships between rainfall fields, spatial resolution of rainfall and catchment characteristics. In Sect. 4 results of the scale analysis are shown and discussed. Lastly, conclusions are presented in Sect. 5.
2 Presentation of the case study and data sets 2.1 Case study and model description
This paper focuses on the central district of Rotterdam, the Netherlands (Fig. 1). The district is densely populated and includes mainly residential areas with approximately 30 000 inhabitants, as well as businesses and shopping centres. The district has a size of 3.4 km2. Two green areas are located in the southern part of the district, sized 6 and 24 ha. The south-ern border of the district is formed by the Meuse River. The district belongs to a polder area below sea level. As a result, the area is nearly flat and there is not a dominant flow direc-tion. During rainfall, excess storm water needs to be pumped out into the river system or temporarily stored elsewhere. Meanwhile, net rainfall fills sewer systems and storage basins up to the level of external weirs, where overflows to surface water take place if rainfall continues. An underground stor-age facility with a capacity of 10 000 m2has been built in the district to reduce flood risk during heavy rainfall events.
[image:3.612.308.550.106.208.2]A hydrodynamic urban drainage model has been built for the catchment area using SOBEK-Urban software (Deltares, 2014). Although fully distributed models best describe the effect of rainfall variability on a catchment, the use of a highly detailed semi-distributed model with runoff areas of approximately the same size or smaller than the highest rain-fall input resolution of 100 m×100 m, is a close alternative. The combined sewer system was modelled in 1-D and con-sists of around 3000 manhole nodes (most of them are with runoff) and 11 external weirs, which serve as outflow points. The model contains four pressurised pipes interconnecting parts of the sewer system. Two external pumping stations transport water to the waste water treatment plant and to the river. Rainfall–runoff processes are modelled in SOBEK-RR (Deltares, 2014). The main components in this model are face water storage, evaporation, infiltration and delay of sur-face runoff before entering the sewer system. Sursur-face water storage occurs when rainwater forms puddles. When the wa-ter level exceeds the given maximum street storage, runoff is generated. Infiltration is computed on pervious surfaces by the Horton equation. Runoff to the sewer system is computed
Table 1. Surface characteristics of the central district catchment in
Rotterdam used for hydrodynamic modelling: percentage, runoff coefficient and storage coefficient.
Overall Runoff Storage Type of percentage coefficient coefficient
area (%) (min−1) (mm)
Open paved flat 40 0.2 0.5
Closed paved flat 14 0.2 0.5
Roof flat 16 0.2 2
Roof sloped 30 0.5 0
(slope larger than 4 %)
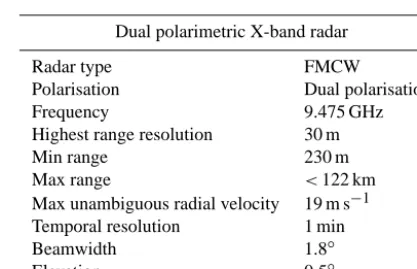
Table 2. Specification of the X-band radar of CESAR.
Dual polarimetric X-band radar
Radar type FMCW
Polarisation Dual polarisation
Frequency 9.475 GHz
Highest range resolution 30 m
Min range 230 m
Max range <122 km
Max unambiguous radial velocity 19 m s−1 Temporal resolution 1 min
Beamwidth 1.8◦
Elevation 0.5◦
as a function of net rainfall and runoff factors, which depend on length, roughness, slope and percentage of impervious-ness of the areas. According to Dutch guidelines (Stichting RIONED, 2004), four different area types were used with dif-ferent sets of runoff parameter values (Table 1): closed paved, open paved, roof flat and roof sloped (with slope larger than 4 %) areas. The open paved area type represents paved streets with bricks, which allow water to infiltrate and to be retained within the road surface. Green areas are not taken into ac-count by the model, as they are assumed to be disconnected from the sewer system. The rainfall–runoff module is lumped and its basic unit is the “runoff area”. Each runoff area con-tains different types of surface, the runoff of which enters the sewer system through the manhole nodes. Further details of the software package used in this study are provided in the Appendix.
2.2 Rainfall data
[image:3.612.324.533.245.379.2]Figure 1. Localisation of Centrum district (in red in the right panel), situated in Rotterdam urban area (right panel and in red in the left
panel), the Netherlands (left panel).
Russchenberg, 2011). The X-band radar has been operational intermittently since 27 June 2008. From the available data sets provided by CESAR, four rainfall storms could be se-lected for analysis based on a minimum mean rainfall volume of 3 mm over the area size of the studied catchment, the size of which is 3.4 km2. Lower rainfall volumes produce insuffi-cient runoff to allow proper hydrodynamic analysis. Accord-ing to the classification adopted by Emmanuel et al. (2012), events are grouped as follows:
– Event 1 and Event 2: storm organised in rain bands; – Event 3: storm less organised;
– Event 4: light rain.
In Event 1, a long-lived squall line was measured on 3 Jan-uary 2012. The convective storm moved eastward with a ve-locity of 20 m s−1approximately. A squall line is a line of convective cells that forms along a cold front with a predom-inately trailing stratiform precipitation (Storm et al., 2007). Squall lines are typically associated with a moderate shear between 10 and 20 m s−1 and strong updraft (Weisman and Rotunno, 2004). If winds increase rapidly with height ahead of a strong front, thunderstorms triggered along the bound-ary may organise into severe storms called supercell storms. The X-band radar was able to capture storm features asso-ciated with supercell. The overall duration of the event was short, 1 h in total, but the most intense peak lasted 10 min at the end of the storm, and with rainfall intensities higher than 100 mm h−1. The most affected part of the catchment was the central and the northwestern part, while the southern part was affected by light rain. Event 2, occurring on 10 Septem-ber 2011, can be characterised as a cluster of convective and organised storm cells that moved in a northeast direction. The
storm moved northeastward with a velocity of 16 m s−1 ap-proximately. The storm system showed a convective spread area larger than the first event and with slower shift. The storm lasted 2 h, between 18:00–20:00 UTC, with the most intense part concentrated between 19:00 and 20:00 UTC. In-tensities ranged between 30 and 60 mm h−1, and the whole central part, from south to north of the catchment was af-fected, while east and west bands were less exposed. In Event 3, which occurred on 28 June 2011 from 22:00 to 24:00 UTC, mesoscale observations showed a non-organised squall line moving northeast, with a speed of 15 m s−1 ap-proximately and containing rainfall rate cores of at least 10 mm h−1. Rainfall rate values of 50 mm h−1were founded over small areas during 22:00–23:00 UTC, travelling from southwest toward northeast and affecting all the catchment. Lastly, Event 4, which occurred on 29 October 2012, was a stratiform precipitation moving eastward at 13 m s−1 approx-imately and showing uniform rainfall rates. Rainfall retrieval was based on reflectivity only, of about 8 mm h−1. Storms motions and directions were estimated based on a centroid-based storm association algorithm, inspired by Johnson et al. (1998). For each event, total rainfall volumes in terms of minimum, maximum and mean value of all pixels affecting the area can be found in Fig. 2, as well as their standard de-viation, giving a first insight into the variability of the event. Figure 3 presents radar images showing the maximum inten-sity minute of each one of the selected rainfall events, as well as the location of the catchment with respect to them and the main direction of the storms.
3 Methods
Figure 2. Characteristics of the four selected storm events: rainfall
volume range (maximum and minimum for all 100 m×100 m pix-els over the catchment area), mean and standard deviations.
scales. Building upon the approach introduced by Ogden and Julien (1994), length scales were developed for urban catch-ments and adjusted and extended for application to hydrody-namic urban drainage models (Table 3, Fig. 4). A scale de-pendency between storm, catchment and model topology for small-scale urban catchments, was studied based on rainfall fields derived from polarimetric radar, using spatial resolu-tions of 100, 500, 1000 and 2000 m, obtained by upscaling the original resolution. The finest spatial resolution, namely 100 m, was chosen for being the highest resolution at which radar rainfall data were provided. The 1000 m resolution was selected for being the resolution at which most of the na-tional weather radar networks work, the 500 m was chosen as an intermediate resolution between X-band radar and C-band national radar network resolutions. The 2000 m reso-lution was used to represent uniform rainfall conditions over the catchment. Results were analysed to investigate the effect of different spatial and temporal rainfall data resolutions on rainfall volumes, peak runoff and in-sewer water depths at locations inside the catchment, according to dimensionless parameters specified.
3.1 Scale lengths
3.1.1 Rainfall lengths
Rainfall length LR was defined as the rainfall resolutions used as input into the hydrodynamic model to observe the re-sponse of the catchment. Rainfall data were spatially aggre-gated from the original resolution (30 m near the radar, 100 m elsewhere) to 500, 1000 and 2000 m. In this work storms where captured at distances from radar such that the finest grid resolution was 100 m×100 m.
3.1.2 Storm and catchment lengths
To characterise storm size, de-correlation length of the storm
LDwas defined as the distance from which rainfall rates are statistically independent. For each of the four storms under study, de-correlation lengths were determined as the range of the experimental anisotropic semi-variogram computed over the study area. The semi-variogram function was originally defined by Matherson (1963) as half the average squared dif-ference between points separated by a distanceh(Eq. 1). It is calculated as
γ (h)= 1
2m(h) X
i
[(Z (xi+h)−Z (xi) )2], (1)
wherem(h) is the set of all pairwise Euclidean distances
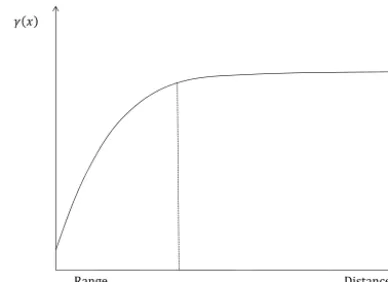
h, andZ are the rainfall values at spatial locations. Storm de-correlation length was defined as the range of the semi-variogram, i.e. the distance at which the sill is first reached; the sill is defined as the limit of the semi-variogram tend-ing to infinite lag distances (see Fig. 5). Besides the value of the lag distance, in this paper the direction is also taken into account: we computed the anisotropic semi-variogram (Goovaerts, 2000; Haberlandt, 2007; Emmanuel et al., 2012), in four directions, spaced 45◦. Since the limiting length is the minimum storm length, the minimum of the four ranges was taken as storm length for the study.
Storm de-correlation length was compared to pixel size of radar rainfall estimatesLRand to catchment lengthLC, com-puted as the square root of the catchment size.
3.1.3 Model lengths
Characteristic lengths of the model topology are a result of modeller’s choices based on available data, options of ap-plied software and acceptable computational effort. Runoff lengthLRAcharacterises the spatial resolution of the runoff model and was defined as the square root of the averaged runoff areas’ size. Runoff length quantifies the size of the grid over which runoff is generated: ifLRALC, the catch-ment is divided into sufficiently small elecatch-ments to describe the spatial variability of the catchment characteristics. More-over, spatial variability in rainfall rates can be properly cap-tured by the runoff model ifLR< LRA. IfLR> LRA, rain-fall rates can no longer be correctly attributed to associated runoff areas, which may distort the hydrological response pattern (Ogden and Julien, 1994).
Table 3. Scale lengths related to catchment, runoff areas and sewer density, for the total catchment as well as length scale ranges for the 10
subcatchments.
Length scales (m) Code Event 1 Event 2 Event 3 Event 4
Storm de-correlation length LD 950 1000 1480 1600
Runoff length: mean (median) LRA 28 (23)
Sewer length LS 43
Catchment length LC 2.024
Subcatchment runoff length (range) (Sub)LRA 21–59 Subcatchment sewer length (range) (Sub)LS 33–78 Subcatchment length (range) (Sub)LC 429–2.024
Figure 3. Plots of the maximum intensity time step for the four storm events, main direction of the storm (grey arrow), and virtual position
of the catchment with respect to storm movement (black square). Zonal distances in east–west and north–south direction from X-band radar position. The latter is at (0, 0) and the maximum range is 15 km. Events 1, 3 and 4 were detected in the southwestern quadrant of the radar coverage, while Event 2 was detected in the northwestern quadrant.
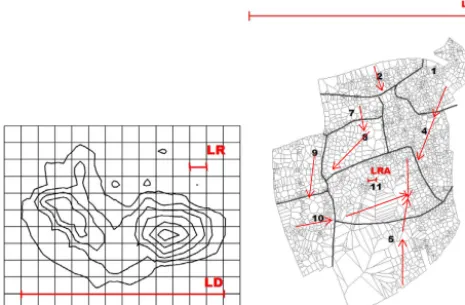
3.1.4 Definition of subcatchments
The analysis involving model lengths was conducted at subcatchment scale to compare results for different model lengths: the district was divided into 11 subcatchments (Fig. 4). In lowland areas, drainage systems are often inter-linked and looped and flow direction changes over the course
Figure 4. Storm de-correlation length (LD)and rainfall resolution (LR)in left panel. Catchment length (LC), runoff length (LRA)in right panel; the catchment is divided into 11 independent subcatch-ments. Red arrows represent main flow directions. Runoff areas are also displayed, their average size is reported in Table 2.
1. We ran simulations under long-lasting uniform storms; 2. We made sure no overflow towards surface water bodies
occurred (in that case, a direction change would affect the sewer flow);
3. We detected sewer pipes withQ=0;
4. We delineate subcatchments as if the latter were re-moved;
5. We compared flows at outlets of the 11 subcatch-ments in “looped” conditions (the original model) and “branched” conditions (model after the removal of cross boundary conduits); we found high agreement between the two results; therefore we accepted the catchments’ delineation as a satisfactory approximation.
A visual inspection of the sewer network helped to under-stand the direction of flow: since no overflows occurred for the events used in this study, the system drains received water toward the main pumping station. Under this condition the main sewer conduits collect all water from peripheral con-duits. We could therefore observe the flow direction in the main conduit.
3.2 Dimensionless parameters
Using the length scales, dimensionless parameters were com-puted to analyse relationships between spatial characteristics of rainfall, catchment and its hydrological response.
3.2.1 Rainfall sampling number (LR/LD)
“Rainfall sampling number” (LR/LD)was defined as the ra-tio between rainfall length (LR) and storm de-correlation length (LD) in order to study rainfall gradient smoothing
in terms of the relationship between the estimated rainfall field and the storm inherent structure. This parameter is sim-ilar to the “storm smearing” effect defined by Ogden and Julien (1994); it accounts for the deformation of the storm structure caused by rainfall measurements of coarser resolu-tion than the storm length. For instance, rainfall intensities in storm cells with sizes smaller than applied rainfall spatial resolution will be averaged out, leading to an underestima-tion in rainfall rates in the area affected by the storm cells and a overestimation in the area surrounding the cells.
In other words, asLRtends toLD, rain rates in high inten-sity regions tend to decrease, and conversely rainfall intensi-ties in adjacent regions tend to increase. The overall effect is a reduction of rainfall gradients. Dimensionless rainfall sam-pling number quantifies this effect.
3.2.2 Catchment sampling number (LR/LC)
The second dimensionless parameter, “catchment sampling number” (LR/LC), also referred to as “watershed smearing” by Ogden and Julien (1994), was defined as the ratio between rainfall length (LR)and catchment length (LC). It accounts for rainfall transfer across catchment boundaries, as the rain-fall spatial resolution approaches the size of the catchment. When the parameter exceeds 1, location of rainfall cells with respect to the catchment becomes uncertain and rainfall vari-ability is not properly captured by the catchment. In other words, when dealing with small size storms, the position of the storm with respect to the catchment is no longer properly represented for rainfall resolutions approaching or exceeding catchment length. This affects the hydrological response: a storm moving near the boundaries of the catchment is aver-aged across the catchment boundary, so rainfall is artificially transferred outside the catchment. This effect is quantified by the catchment sampling number, relating the size of the catchment to the size of the radar pixel.
3.2.3 Runoff sampling number (LR/LRA)
3.2.4 Sewer sampling number (LR/LS)
The fourth dimensionless parameter is the “sewer sam-pling number” (LR/LS), defined as the ratio between rainfall length (LR), and intra-sewer length (LS), which is computed as the average length of conduits in the system. The lower the sewer sampling number, the less sensitive is the drainage net-work to rainfall variability: a low “sewer sampling number” means that the inter-pipe distance is larger than the rainfall pixel size, so the sewer system cannot catch rainfall variabil-ity. Conversely, for higher sewer sampling numbers rainfall input is too coarse compared to the sewer network density and this may result in lack of accuracy of modelled water levels and sewer overflows. The “smearing effect” for sewer flows is related to the runoff smearing effect, quantified by the runoff sampling number, but they differ in this respect: the latter focuses on runoff model output, namely discharge towards the sewer network, while the sewer index represents the routing within the piped system and so it quantifies the smearing effect for in-sewer water levels. Water levels in pipes are affected by runoff discharge but also by upstream sewer inflows. As it is not possible to isolate the effect at the level of individual pipes, it is analysed at the outlet of each independent subcatchment.
3.2.5 Normalisation of model output results
To compare results between rainfall resolutions and between storms, model results were normalised with respect to results related to the highest rainfall spatial resolution: total rainfall volumes, runoff peaks and maximum in-sewer water depths were normalised according Eqs. (2), (3) and (4) respectively:
Vnorm LRi
= V (LRi) V (LR100)
(2)
Qnorm LRi
= Q(LRi) Q(LR100)
(3) WDnorm LRi
= WD(LRi)
WD(LR100)
, (4)
whereLRi represents parameter values at the rainfall
reso-lution under consideration (100, 500, 1000 or 2000 m) and
LR100represents values at 100 m rainfall resolution, used as a reference for normalisation.
3.3 Temporal resolution analysis
While the focus of this paper is on spatial scales, a prelim-inary investigation of the effect of temporal resolution on model outcomes was conducted to see how temporal resolu-tion interrelates with spatial resoluresolu-tion. To this end, rainfall data were aggregated to 5 and 10 min temporal resolutions.
The temporal aggregation was performed by averaging out 5 (10) consecutive 1 min rainfall values at a time, ob-taining temporal resolution of 5 (10) min. Semi-variograms were computed for these resolutions to study the relation
[image:8.612.332.526.66.207.2]be-Range Distance( )
Figure 5. Sketch of semi-variogram: the range is the distance (x) from the origin beyond which the semi-variogramγ (x)tends to infinity.
tween temporal resolution and the spatial structure of rain-fall. The effect of the variation in rainfall temporal resolu-tion on model outputs was quantified through the compari-son of time to maximum water depths. Combined time–space resolutions were studied for Events 3 and 4: both events were simulated at two spatial and two temporal resolutions, namely 100 m, 1000 m, 5 min and 10 min, composing four different spatio-temporal rainfall scenarios.
4 Results and discussion
Results of length scale calculations are presented in Table 3, dimensionless parameter values are shown in Table 4. Storm de-correlation lengths vary between 950 and 1600 m for the four storm events. Subcatchment lengths vary from 429 to 2024 m, while runoff and sewer lengths in the hydrody-namic model vary between about 20 and 80 m, representing the model’s high spatial resolution. Dimensionless parameter values show that rainfall sampling numbers vary from 0.06 for Event 4 to 0.11 for Event 1 at 100 m rainfall resolution and increase to 1.25 and 2.11 respectively at 2000 m rainfall resolution. Catchment sampling number increases from 0.05 to 0.99 for 100 and 2000 m, while runoff and sewer sampling numbers vary from 1.9 to 4.7 at 100 m resolution to 25.5 to 93.3 at 2000 m resolution, runoff sampling numbers being slightly higher than sewer sampling numbers.
Table 4. Dimensionless parameters values derived from scale length values, for the four different rainfall resolutions used in the study. Values
presented for runoff sampling and sewer sampling numbers, represent value ranges for the 10 subcatchments (outlined in Fig. 4).
Catchment Runoff Sewer density
Rainfall sampling sampling sampling
resolution Rainfall sampling numberLR/LD number number number
(m) Event 1 Event 2 Event 3 Event 4 LR/LC LR/LRA LR/LS
100 0.11 0.10 0.07 0.06 0.05 2.6–4.7 1.9–3.8
500 0.53 0.50 0.34 0.31 0.25 13.1–23.3 6.4–19.1
1000 1.05 1.00 0.68 0.63 0.49 26.1–46.7 12.8–38.3
[image:9.612.64.272.136.421.2]2000 2.11 2.00 1.35 1.25 0.99 52.3–93.3 25.5–76.5
Figure 6. Normalised rainfall volumes versus catchment sampling
number (LR/LC): mean and standard deviation of normalised rain-fall volumes computed over the catchment, for the four events.
4.1 Effect of spatial resolution
4.1.1 Total rainfall volumes versus catchment sampling number
Figure 6 shows mean and standard deviation of normalised rainfall volumes (according to Eq. 2) computed over the catchment, versus catchment sampling number. This result was obtained only analysing various rainfall resolutions and no hydrological modelling was used.
The results show that mean normalised rainfall volumes decrease by 5, 20 and 30 % with respect to the 100 m res-olution reference, for LR/LC 0.2, 0.5 and 1 respectively. Standard deviations decrease by 2, 30 and 100 % respec-tively. Mean and standard deviation decrease progressively for catchment sampling number values above 0.2. This means that rainfall gradients decrease as rainfall values are smoothed at coarser resolution and that rainfall volumes decrease as smoothing of rainfall values at the catchment boundaries artificially transfers rainfall across the
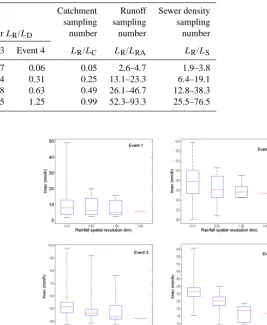
bound-Figure 7. Boxplots of maximum rainfall intensity (mm h−1) among all pixels covering the catchment area, for the four spatial resolu-tions (the 2000 m shows a unique value corresponding to rainfall uniformly distributed over the catchment), for the four events anal-ysed.
ary. According to the findings of Ogden and Julien (1994), this effect, called by them “catchment smearing”, occurs for catchment sampling numbers greater than 0.4. In contrast, results of the present study show that this effect already oc-curs at smaller sampling numbers, namely 0.2, and becomes stronger for values greater than 0.2. Figure 7 presents box-plots for maximum rainfall intensity values per pixel, over the studied catchment as a function of rainfall spatial resolu-tion. The median of maximum intensity values shows a mild decrease for coarser rainfall resolutions. The smoothing ef-fect is more pronounced for Event 3 and Event 4, where con-vective cells move closer to catchment boundaries. This re-sults in storm cells being smoothed across catchment bound-aries.
in-put resolution is reduced. When resolution is reduced from 100 to 500 m, spatial structure of the storm line is decom-posed, leading to a reduction in maximum rainfall intensities (Fig. 7) in the area affected by the storm. As resolution is reduced from 1000 to 2000 m resolution, storm structure is lost and rainfall becomes uniform over the catchment. Storm cells in Event 2 are characterised by steeper spatial gradi-ents in rainfall intensities compared to Event 1 and as a result maximum rainfall intensity values are more strongly affected by changes in rainfall resolution: the upper 25 % values de-crease as a result of rainfall gradient smoothing, especially as resolution is reduced from 100 to 500 m. The lowest 25 % values increase as a result of gradient smoothing and storm structure decomposition, especially as resolution is reduced from 500 to 1000 m, where the variation between first and third quartile values is reduced from about 10 to 5 mm h−1. Events 3 and 4 present a clear reduction of the median as a result of rainfall aggregation across the catchment bound-ary. The variation between first and third quartile values is larger at 1000 m resolution than at 100 and 500 m resolu-tion. For Event 3, this is due to the non-organised structure of rainfall cells: local rainfall cells found at 100 m resolu-tion are smoothed out at 500 m resoluresolu-tion, while at 1000 m resolution the most active convective area affects two out of nine pixels covering the catchment, i.e. the lowest 25 % val-ues are relatively high. Event 4 is characterised by stratiform precipitation showing uniform rainfall rates. Upper quartile values decrease from 34 to 22 mm h−1; lower quartile values reduce from 28 mm h−1to about 10 mm h−1at 1000 m res-olution. This is a result of rainfall gradient smoothing and storm cells spreading southward due to spatial aggregation, while the core of the storm remains within the catchment boundaries. The strongest effect of rainfall coarsening in this case is found in a strong reduction of rainfall gradients. As a general conclusion, spatial aggregation leads to smoothing of rainfall gradients, while the effect on rainfall intensities’ distribution strongly depends on spatial dimensions of storm cells and the movement of storm cells relative to the catch-ment boundaries.
4.1.2 Normalised maximum in-sewer water depths and runoff peaks versus rainfall resolution
Figure 8 summarises the effect of rainfall spatial resolution coarsening on semi-distributed hydrodynamic model outputs in terms of maximum computed water depths and maximum runoff flows in all nodes, per storm event. The in-sewer max-imum water depths and runoff peaks at every node of the model are normalised using Eqs. (3) and (4). Results pre-sented in the boxplots show that normalised runoff peaks are more strongly affected by changing spatial resolution of rainfall inputs compared to normalised maximum water depths. The largest effect of spatial aggregation is found for Event 4 (Fig. 8 last column), where upper and lower quar-tile values of runoff peaks are reduced by 40 to 60 % at
2000 m resolution with respect to the reference at 100 m res-olution. Normalised maximum water depths are less strongly affected; upper quartile values remain almost unchanged, while lower quartile values decrease by up to 30 %. Event 4 has a pronounced spatial structure that is strongly affected by rainfall resolution coarsening and this directly translates into stronger changes in runoff volumes compared to the other events. Largest changes in normalised maximum water depths are found for Event 1, where upper and lower quar-tile values change by up to 40 % as a result of spatial redis-tribution of rainfall due to resolution coarsening. This event is characterised by small total rainfall volumes, resulting in small flows and water depth variations, which in turn trans-late into large relative differences.
Smaller changes in water depths compared to runoff flows are explained by the fact that water depths are influenced by rainfall–runoff inputs as well as by sewer routing and by stor-age being dominant over flow in drainstor-age systems charac-terised by small gradients.
For Events 1, 2 and 3, changes in normalised water depths and runoff flows are of the same order of magnitude at 500 and 1000 m resolutions, which indicates that the effect of rainfall resolution coarsening from 100 to 500 m is not fur-ther amplified as resolution is reduced to 1000 m. When reso-lution is further reduced to 2000 m, corresponding to uniform rainfall over the catchment, values above 3rd quartile tend to increase as areas previously affected by low rainfall receive higher rainfall as a result of gradient smoothing.
4.1.3 Spatial structure of rainfall: anisotropic semi-variogram
al-Figure 8. Boxplots of the normalised maximum water depths (top panel) and runoff peaks (bottom panel) computed for all nodes in the
model, for Events 1 (left) to 4 (right).
Ev. 1 Ev. 2
[image:11.612.63.540.67.272.2]Ev. 3 Ev. 4
Figure 9. Instantaneous experimental multi-directional spatial
semi-variogram of non-zero rainfall for each of the four storms.
though the shape of the one at 90◦diverts considerably from the rest.
[image:11.612.52.286.326.537.2]The same results are found for Event 2: the directional semi-variogram at 90◦ shows a faster rise compared to the other directions, thus the storm structure is clearly oriented. The de-correlation distance is 1000 m. No explanation was found to interpret the pronounced decrease in the semi-variograms of Events 1 and 2. We can only report that the same behaviour was found in storms belonging to the same rainfall group defined by Emmanuel et al. (2012).
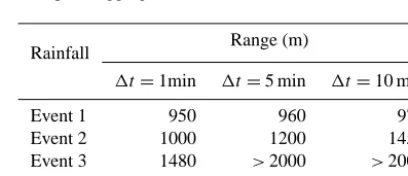
Table 5. Range derived from experimental semi-variograms for
dif-ferent temporal aggregations, for all four events.
Rainfall Range (m)
1t=1min 1t=5 min 1t=10 min
Event 1 950 960 970
Event 2 1000 1200 1450
Event 3 1480 >2000 >2000
Event 4 1600 1500 1500
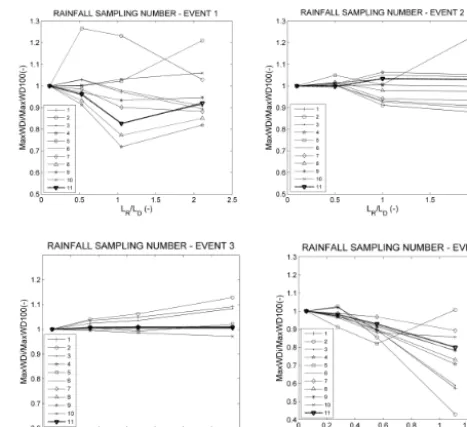
[image:11.612.326.530.357.445.2]4.1.4 Normalised in-sewer maximum water depths versus rainfall sampling number
[image:12.612.310.544.65.279.2]The rainfall sampling number is a measure for what Ogden and Julien (1994) referred to as “storm smearing”: rainfall rates in convective regions tend to decrease while rain rates in low-intensity regions tend to increase as a result of spatial aggregation. The overall effect is thus a flattening of rain-fall gradients. This happens when the resolution of the vol-ume unit measured by the weather radar approaches or ex-ceeds the rainfall de-correlation length, thus the rainfall sam-pling number exceeds 1. This effect is also due to “catch-ment smearing” addressed in Sect. 4.1.1. The effect of rain-fall sampling number on in-sewer water depths was analysed for all four rainfall events. In-sewer depths were analysed at the outlets of the 10 subcatchments (Fig. 4) to study the effect of storm smearing in relation to catchment character-istics and in-sewer flow routing. Maximum water depth val-ues were normalised with respect to valval-ues at 100 m reso-lution. Figure 10 shows normalised maximum water depths against rainfall sampling number, at the outlet nodes of the 10 subcatchments and the outlet node of the whole catch-ment (catchcatch-ment number 11 in Fig. 10). For all events, de-viations in normalised water depth increase for LR/LD in-creasing to 0.5 and 1. For Event 1, whenLR/LDexceeds 1, deviations slightly reduce in 5 of out 11 catchments while slightly increasing for 6 subcatchments, depending on local re-distribution of rainfall. Subcatchment 2 shows highest de-viation at LR/LD=0.5, followed by a decrease for coarser resolutions. This is because the subcatchment is located at the boundary of the storm, where at 500 m spatial resolution rainfall gradients increase, while at 1000 m resolution gradi-ents are reduced due to averaging over a larger region not af-fected by the storm. This directly affects the maximum water depth in underlying subcatchments. The opposite situation occurs in subcatchment 5, which is located in the southern part of the catchment with the closest node at 1.2 km from the convective region, beyond the de-correlation length. The storm only affects this southern region when rainfall data are aggregated to the 2000 m resolution, so the storm “virtually” extends from the northern part of the catchment to the whole catchment. A similar effect is noticed at the same ment for Event 2. Results suggest that for most subcatch-ments, storm smearing occurs for LR/LD ratio above 0.5. Figure 9 shows that while storm smearing already affects wa-ter depths at values ofLR/LDbelow 0.5, the effect becomes a lot stronger for values between 0.5 and 2. Results are in agreement with the findings of Ogden and Julien (1994), who found for their catchments that “storm smearing” occurred forLR/LD>0.8. This implies that for the storm events used in this study, with de-correlation lengths of 0.95 to 1.6 km, the current resolution of operational weather radars (1000 m) is insufficient to have a proper estimation of intra-urban hy-drodynamics.
Figure 10. Normalised maximum in-sewer water depths versus
rainfall sampling number (LR/LD): results at the outlet of the 10 subcatchments (numbered 1 to 10) and of the whole catchment (no. 11).
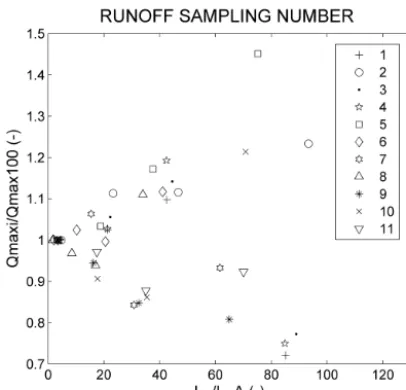
4.1.5 Normalised runoff peaks versus runoff sampling number
Normalised maximum runoff flows of all runoff areas were averaged within each of the 11 (sub)catchments for all four events and plotted versus corresponding runoff sampling numbers (Fig. 11) to study effects of rainfall smoothing on runoff inputs at (sub)catchment level. Deviations from 100 m simulation results remain between 0.9 and 1.1 forLR/ LRA<20, while higher deviations up to almost 50 % occur forLR/LRA>20. At the original rainfall input resolution of 100 m, LR/LRA is below 10, so rainfall pixel size used to feed the urban hydrological model is up to 10 times larger than runoff model resolution. AsLR/LRAgrows larger, com-puted maximum runoff flows increasingly deviate as a result of rainfall smoothing and of catchment smearing, discussed in Sect. 4.1.1.
4.1.6 Normalised maximum water depths versus sewer sampling number
aver-Figure 11. Normalised runoff peaks versus runoff sampling
num-ber (RR/LRA): results averaged over each of the 10 subcatchments (numbered 1 to 10) and over the whole catchment (no. 11).
Figure 12. Normalised maximum water depths versus sewer
sam-pling number (LR/LS): results at the outlet of the 10 catchments and of the whole catchment (no. 11).
aged per subcatchment, for all four events. Results show that maximum water depths tend to decrease for increasing sewer sampling numbers. In general, deviations from the reference case are smaller for in-sewer water depths, ranging from 0.87 to 1.13, than for runoff peaks, which are in the range 0.7–1.5. This is due to the smoothing effect of flow routing through the pipe system on in-sewer water depths.
4.2 Effects of temporal resolution
4.2.1 Changes in spatial structure of rainfall due to time aggregation
X-band radar images are obtained at 1 min temporal scale: the radar completes radar scans in 1 min. In order to anal-yse the effect of temporal resolution on rainfall spatial anisotropic semi-variograms, raw rainfall data were aggre-gated by averaging the original radar images to 5 and 10 min resolutions. The anisotropic experimental semi-variogram was then computed based on the aggregated values (Fig. 13). Anisotropic semi-variograms for these time resolutions were used to examine the interrelationship between temporal res-olution and spatial structure of rainfall. Results show that the semi-variograms change in shape more strongly when aggre-gating from 1 min to 5 min compared to aggreaggre-gating from 5 to 10 min resolutions. The range derived from the semi-variograms increases for lower temporal resolutions. This is especially clear for Event 3, where at 5 and 10 min the storm structure within the catchment boundaries is lost as the semi-variograms become monotonic in any of the four directions considered. In Event 4, the range expands until the catch-ment limits for three out of four directions, while in the 90◦ direction the semi-variogram range decreases. Events 1 and 2 seem less affected by changes in temporal resolution; the shape of the curves changes but the range expands only few tens of metres. Table 5 summarises ranges for all rainfall events as a function of time resolution.
4.2.2 Effect of temporal resolution on timing of maximum water depths
[image:13.612.67.270.65.260.2]The effect of changes in rainfall temporal resolution on model outputs was quantified in terms of the time shift of maximum water depths with respect to the reference case. Figure 14 shows time shifts of maximum water depths be-tween the reference simulation (100 m, 1 min) and 5 and 10 min simulations (both at 100 m spatial resolution) at the outlets of the 11 (sub)catchments, for Event 1. Results show that the timing of maximum water depths shifts by up to 4 min for aggregation to 5 min resolution and by up to 10 min for 10 min resolution. Time shifts were also calculated for all 3000 nodes of the catchment model (results not shown here). At 5 min resolution, the time shift of maximum water depths with respect to the reference case is less than 5 min for 99.4 % of all nodes. At 10 min resolution, time shifts of more than 5 min occur in 0.86 % of the nodes; time shifts in all other nodes are less than 5 min.
[image:13.612.67.267.316.507.2]Figure 13. Anisotropic experimental semi-variograms for the four rainfall events (in rows) and different temporal resolutions: 1, 5 and 10 min
(left, central and right column respectively).
the 1000 m resolution, the effect of temporal aggregation on timing of maximum water depths is comparatively smaller. The relatively high impact of 100 m and 10 min resolution simulation is explained by the change in rainfall structure in-duced by temporal aggregation. As shown in Fig. 13, third row, de-correlation length becomes larger than the catch-ment size. This effect already occurs at 5 min aggregation, but is more pronounced at 10 min aggregation. In both cases time aggregation results in enlargement of the area affected by convective storm cells, in a smoothing of rainfall peaks, and in a change in timing of rainfall peaks. This results in
Figure 14. Time shift between maximum water depths of reference
case (100 m spatial resolution, 1 min temporal resolution), and 5 and 10 min simulation, at the outlets of the 10 subcatchments and of the whole catchment (no. 11).
Figure 15. Differences in time to maximum water depth at the
out-lets of the 10 subcatchments and of the whole catchment (no. 11) for Events 3 and 4. Simulations at the highest spatial and temporal res-olutions (100 m/1000 m 1 min respectively) are taken as reference.
of the 11 nodes is lower than 10 min. In order to notice an impact on model output, the time step of rainfall input must be smaller than the concentration time of the catchment at the outlet (Vaes et al., 2001) (being the concentration time the time rainfall needs to travel from the furthest place in the catchment to the chosen outlet of the sewer system). For Event 4, temporal aggregation results in anticipation of max-imum water by 1 to 7 min at most of the catchment outlets.
Moreover, the effects of time aggregation on model perfor-mance have been analysed through the comparison in maxi-mum water depths between simulations. Deviations in max-imum water depths with respect to the reference case were below 0.05 m. This shows that the effect of rainfall spatial aggregation is much more important than that of temporal aggregation, in this specific case study and under these rain-fall scenarios. Due to the low deviations found, results have not been reported here.
5 Conclusions
The sensitivity of an urban hydrodynamic model to spa-tial and temporal resolutions of weather radar data was in-vestigated in this paper. Analyses are based on a densely populated urban catchment in Rotterdam, the Netherlands and four rainfall events that were derived from polarimet-ric X-band radar data. Rainfall and catchment properties were characterised using various length scales: catchment size and storm de-correlation length, which depend on the specific site and storm; rainfall data resolution, which de-pends on rainfall measurement resolution; and runoff resolu-tion and sewer density, which are modeller’s choices. Sensi-tivity of model outputs to rainfall spatial resolution was anal-ysed in relation to: catchment size, through catchment sam-pling number (LR/LC); storm length, by means of rainfall sampling number (LR/LD); runoff resolution of the model, through runoff sampling number (LR/LRA); and sewer den-sity, with the sewer sampling number (LR/LS). The first pa-rameter is responsible for the uncertainty of rainfall loca-tion with respect to watershed boundaries; the second pa-rameter describes smoothing of rain rate gradients; the third and fourth parameters describe the ability of the model (the runoff model and the sewer model respectively) to capture the rainfall structure. Storm length was been computed as the range of anisotropic experimental semi-variograms. Four rainfall spatial resolutions (100, 500, 1000 and 2000 m) and three temporal resolutions (1, 5 and 10 min) were analysed. Results obtained in this study show:
– As the ratioLR/LCincreases (in this particular case for LR/LC>0.2), there is a progressive decrease of both rainfall volume mean and standard deviation. Rainfall gradients decrease due to smoothing induced by rainfall resolution coarsening; mean rainfall over the catchment decreases as smoothed storm core cells extend beyond the catchment boundaries. The effect of spatial resolu-tion coarsening on rainfall values strongly depends on the movement of storm cells relative to the catchment. – As the ratioLR/LDincreases (in this particular case for
LR/LD>0.9), “rainfall smearing” occurs, inducing de-viations in maximum modelled in-sewer water depths. The magnitude of deviations depends on the spatial structure of the storm and variability in rainfall gradi-ents which determines how much the rainfall field is de-structured by resolution coarsening. Results are in line with what was found by Ogden and Julien (1994). – As the ratio LR/LRA increases, deviations in runoff
[image:15.612.50.287.301.406.2]runoff model outputs are not correctly represented by the model at runoff area resolutions lower than 50 m. – As the ratioLR/LSincreases, deviations from the
refer-ence case (100 m resolution) occur: these are smaller for in-sewer water depths, ranging from 0.87 to 1.13, than for runoff peaks, which are in the range 0.7–1.5. This is due to the smoothing effect of flow routing through the pipe system on in-sewer water depths.
Additionally, an analysis of the change in spatial structure of rainfall due to time aggregation was conducted. To this end, the impact on model results was quantified in terms of time shift of maximum water depths with respect to the reference case at 1 min temporal resolution. Experimental anisotropic semi-variograms temporal aggregations at 5 and 10 min show that rainfall field structure changes due to temporal resolution coarsening. Rainfall correlation length increases by several 100 m due to time aggregation (up to 45 % of original de-correlation length). For all rainfall events, smoothing of rain-fall fields induced by temporal aggregation results in peak time shifts up to 6 min. Model outputs are most strongly af-fected when rainfall temporal aggregation leads to complete distortion of the rain field, which happened for one of the four events in this study.
This study was a first attempt to characterise how the ef-fect of space and time aggregation on rainfall structure af-fects hydrodynamic modelling of urban catchments, for res-olutions ranging from 100 to 2000 m and from 1 to 10 min. It was investigated how rainfall change in resolution is ab-sorbed by the model, giving an indication of scale relation-ships between: storm structure, its representation, catchment size and model structure. In this study four storm events were used that could be derived from an experimental polarimetric X-band radar.
The findings of this study helped to provide initial in-sights into how small-scale precipitation variability affects hydrological response and to what extent an urban drainage model can properly describe such a response. The outcomes showed that critical thresholds are to be expected in terms of the relationship between rainfall resolution and model scales. This study points out that scale relationships are relevant in determining model output sensitivities. To give a more ro-bust meaning to these sampling numbers, more storm events should be analysed and more catchments should be tested to confirm the findings of this study. Additionally, model sen-sitivity to rainfall input resolution should be analysed in re-lation to other sources of uncertainty, such as those related to model structure and model parameter estimation. This re-quires installation of a polarimetric radar in the city, which is planned for the near future. This will enable model validation according to locally observed rainfall and sewer observations and analysis of different aspects of model uncertainty under different rainfall resolution scenarios.
Appendix A: SOBEK software description
Sobek 212 is a semi-distributed hydrodynamic model from Deltares. It accounts for two modules: the rainfall–runoff module and the routing module. In the rainfall–runoff mod-ule four different types of surfaces are used depending on the runoff factor and slope: closed paved, open paved, flat roof and sloped roofs (with a slope greater than 4 %). These four categories show different runoff factor and storage coef-ficient. The resulting runoff is calculated based on the “ratio-nal method”, where the runoffQis given by
Qmmh−1=ch−1∗p(mm), (A1)
wherepis the net rainfall andcis a runoff factor which ac-counts for the delay of the rainfall as overland flow to the entry point of the sewer system. The runoff factor is a func-tion of the length, roughness and slope of the surface (Sobek, 2012). The runoff coefficient is defined as a number between 0 and 1. A coefficient of 0.5 will mean that 50 % of the runoff volume will reach the sewer entry point in 1 min. The runoff factor moves the centre of mass of the resulting hydrograph, thereby increasing the lag time. The runoff formula is ap-plied to each one of the runoff areas connected to the node of the sewer. In semi-distributed models, the whole catch-ment is split into a number of subcatchcatch-ments (runoff areas), each of which is treated as a lumped model (i.e. within each subcatchment rainfall input and hydrologic responses are as-sumed to be uniform; their spatial variability is not accounted for). Rainfall is input uniformly within each subcatchment and based on the subcatchment’s characteristics; the total runoff is estimated and routed to the outlet point, which is a node of the sewer system.
Acknowledgements. This work has been funded by the EU
INTER-REG IVB RainGain Project. The authors would like to thank the RainGain Project for supporting this research (www.raingain.eu). We also thank the reviewers and editor for their valuable comments and suggestions which greatly helped to improve the quality of the paper.
Edited by: P. Molnar
References
Balmforth, D. J. and Dibben, P.: A modelling tool for as-sessing flood risk, Water Practice & Technology, 1, 1, doi:10.2166/WPT.2006008, 2006.
Bell, V. A. and Moore, R. J.: The sensitivity of catchment runoff models to rainfall data at different spatial scales, Hydrol. Earth Syst. Sci., 4, 653–667, doi:10.5194/hess-4-653-2000, 2000. Berne, A., Delrieu, G., Creutin, J.-D., and Obled, C.:
Tem-poral and spatial resolution of rainfall measurements re-quired for urban hydrology, J. Hydrol., 299, 166-179, doi:10.1016/j.jhydrol.2004.08.002, 2004.
Blanchet, F., Brunelle, D., and Guillon, A.: “Influence of the spatial heterogeneity of precipitation upon the hydrologic response of an urban catchment”, 2nd Int. Symp. Hydrological Applications of Weather Radar, Hannover, p. 8, Preprint, 1992.
Dawdy, D. R. and Bergmann, J. M.: Effect of rainfall variability on streamflow simulation, Water Resour. Res., 5, 958–966, 1969. Deltares: Sobek, Hydrodynamics, Rainfall Runoff and Real Time
Control, User Manual. Version: 1.00.34157, 3 June 2014. Copyright©2014 Deltares, Delft, NL, 2014.
Einfalt, T., Arnbjerg-Nielsen, K., Golz, C., Jensen, N.-E., Quirm-bach, M., Vaes, G., and Vieux, B.: Towards a roadmap for use of radar rainfall data in urban drainage, J. Hydrol., 299, 186–202, doi:10.1016/j.jhydrol.2004.08.004, 2004.
Emmanuel, I., Andrieu, H., Leblois, E., and Flahaut, B.: Temporal and spatial variability of rainfall at the ur-ban hydrological scale, J. Hydrol., 430–431, 162–172, doi:10.1016/j.jhydrol.2012.02.013, 2012.
Gires, A., Onof, C., Maksimovic, C., Schertzer, D., Tchiguirinskaia, I., and Simoes, N.: Quantifying the impact of small scale un-measured rainfall variability on urban runoff through multifrac-tal downscaling: A case study, J. Hydrol., 442–443, 117–128, doi:10.1016/j.jhydrol.2012.04.005, 2012.
Gires, A., Tchiguirinskaia, I., Schertzer, D., and Love-joy, S.: Multifractal analysis of a semi-distributed ur-ban hydrological model, Urur-ban Water J., 10, 195–208, doi:10.1080/1573062X.2012.716447, 2013.
Goovaerts, P.: Geostatistical approaches for incorporating elevation into the spatial interpolation of rainfall, J. Hydrol., 228, 113–129, doi:10.1016/S0022-1694(00)00144-X, 2000.
Haberlandt, U.: Geostatistical interpolation of hourly precipitation from rain gauges and radar for a large-scale extreme rainfall event, J. Hydrol., 332, 144–157, 2007.
Jensen, N. E. and Pedersen, L.: Spatial variability of rainfall: Vari-ations within a single radar pixel, Atmos. Res., 77, 269–277, doi:10.1016/j.atmosres.2004.10.029, 2005.
Johnson, J. T., MacKeen, P. L., Witt, A., Mitchell, E. D. W., Stumpf, G. J., Eilts, M. D., and Thomas, K. W.: The storm cell
identifica-tion and tracking algorithm: An enhanced WSR-88D algorithm, Weather Forecast., 13, 263–276, 1998.
Koren, V., Finnerty, B., Schaake, J., Smith, M., Seo, D.-J., and Duan, Q.-Y.: Scale dependencies of hydrologic models to spatial variability of precipitation, J. Hydrol., 217, 285–302, doi:10.1016/S0022-1694(98)00231-5, 1999.
Krajewski, W. F., Lakshmi, V., Georgakakos, K. P., and Jain, S. C.: A Monte Carlo study of rainfall sampling effect on a distributed catchment model, Water Resour. Res., 27, 119–128, 1991. Leijnse, H., Uijlenhoet, R., van de Beek, C. Z., Overeem, A., Otto,
T., Unal, C. M. H., Dufournet, Y., Russchenberg, H. W. J., Figueras i Ventura, J., Klein Baltink, H., and Holleman, I.: Pre-cipitation Measurement at CESAR, the Netherlands, J. Hydrom-eteorol., 11, 1322–1329, doi:10.1175/2010JHM1245.1, 2010. Liguori, S., Rico-Ramirez, M. A., Schellart, A. N. A., and Saul, A.
J.: Using probabilistic radar rainfall nowcasts and NWP forecasts for flow prediction in urban catchments, Atmos. Res., 103, 80– 95, doi:10.1016/j.atmosres.2011.05.004, 2012.
Matheron, G.: Principles of geostatistics, Econom. Geol., 58, 1246– 1266, 1963.
Neal, J., Villanueva, I., Wright, N., Willis, T., Fewtrell, T., and Bates, P.: How much physical complexity is needed to model flood inundation?, Hydrol. Process., 26, 2264–2282, doi:10.1002/hyp.8339, 2012.
Obled, C., Wendling, J., and Beven, K.: The sensitivity of hydro-logical models to spatial rainfall patterns: an evaluation using observed data, J. Hydrol., 159, 305–333, 1994.
Ogden, F. L. and Julien, P. Y.: Runoff model sensitivity to radar rainfall resolution, J. Hydrol., 158, 1–18, 1994.
Otto, T. and Russchenberg, H. W. J.: Estimation of Specific Dif-ferential Phase and DifDif-ferential Backscatter Phase From Polari-metric Weather Radar Measurements of Rain, IEEE Geosci. Re-mote Sens. Lett., 8, 988–992, doi:10.1109/LGRS.2011.2145354, 2011.
Ozdemir, H., Sampson, C. C., de Almeida, G. A. M., and Bates, P. D.: Evaluating scale and roughness effects in urban flood mod-elling using terrestrial LIDAR data, Hydrol. Earth Syst. Sci., 17, 4015–4030, doi:10.5194/hess-17-4015-2013, 2013.
Parker, D. J., Priest, S. J., and McCarthy, S. S.: Surface water flood warnings requirements and potential in England and Wales, Appl. Geogr., 31, 891–900, doi:10.1016/j.apgeog.2011.01.002, 2011.
Pathirana, A., Tsegaye, S., Gersonius, B., and Vairavamoorthy, K.: A simple 2-D inundation model for incorporating flood damage in urban drainage planning, Hydrol. Earth Syst. Sci., 15, 2747– 2761, doi:10.5194/hess-15-2747-2011, 2011.
Priest, S. J., Parker, D. J., Hurford, A. P., Walker, J., and Evans, K.: Assessing options for the development of surface water flood warning in England and Wales, J. Environ. Manage., 92, 3038– 3048, doi:10.1016/j.jenvman.2011.06.041, 2011.
Schellart, A. N. A., Shepherd, W. J., and Saul, A. J.: Influence of rainfall estimation error and spatial variability on sewer flow pre-diction at a small urban scale, Adv. Water Resour., 45, 65–75, doi:10.1016/j.advwatres.2011.10.012, 2012.
Schmitt, T. G., Thomas, M., and Ettrich, N.: Analysis and modeling of flooding in urban drainage systems, J. Hydrol., 299, 300–311, doi:10.1016/j.jhydrol.2004.08.012, 2004.
nu-merical evaluation based on the Lee catchment, UK, J. Hydrol., 347, 116–131, doi:10.1016/j.jhydrol.2007.09.040, 2007. Seliga, T. A., Aron, G., Aydin, K., and White, E.: Storm runoff
simulation using radar-estimated rainfall rates and a Unit Hydro-graph model (SYN-HYD) applied to the GREVE watershed, in: Am. Meteorol. Soc., 25th Int. Conf. on Radar Hydrology, 587– 590, preprint, 1992.
Stichting RIONED: Rioleringsberekeningen, hydraulisch func-tioneren, Leidraad Riolering (Dutch Guidelines for sewer sys-tems computations and hydraulic functioning), Stichting RI-ONED – National centre of expertise in sewer management and urban drainage in the Netherlands, The Netherlands, doi:10.1016/j.advwatres.2011.10.012, 2004 (in Dutch). Storm, B. A., Parker, M. D., and Jorgensen, D. P.: A convective
line with leading stratiform precipitation from BAMEX, Mon. Weather Rev., 135, 1769–1785, 2007.
Vaes, G., Willems, P., and Berlamont, J.: Rainfall input require-ments for hydrological calculations, Urban Water, 3, 107–112, doi:10.1016/S1462-0758(01)00020-6, 2001.
Veldhuis ten, J. A. E. and Skovgård Olsen, A. Hydrological re-sponse times in lowland urban catchments characteristed by looped drainage systems, Urban Rain 14, 9th International Work-shop on Precipitation in Urban Areas, 6–9 December, St. Moritz, Switzerland, 2012.
Vieux, B. E. and Imgarten, J. M.: On the scale-dependent propagation of hydrologic uncertainty using high-resolution X-band radar rainfall estimates, Atmos. Res., 103, 96–105, doi:10.1016/j.atmosres.2011.06.009, 2012.
Weisman, M. L. and Rotunno, R.: “A theory for strong long-lived squall lines” revisited, J. Atmos. Sci., 61, 361–382, 2004. Winchell, M., Gupta, H. V., and Sorooshian, S.: On the simulation
of infiltration and saturation excess runoff using radar based rain-fall estimates: Effects of algorithm uncertainty and pixel aggre-gation, Water Resour. Res., 34, 2655–2670, 1998.