Lung Cancer Detection Using SVM Classifier and MFPCM Segmentation
Keziah T A
1, Haseena P
21MTech Scholar, Department of ECE, Jawaharlal College of Engineering& Technology, Palakkad, Kerala, India 2Assistant Professor, Department of ECE, Jawaharlal College of Engineering& Technology, Palakkad, Kerala, India
---***---Abstract -
Lung cancer is most dangerous disease in theworld, nowadays. So the early detection of lung cancer is necessary. In this paper, the gray scale converted CT scan image of lung is enhanced since the contrast in all regions are significantly lighter or darker using CLAHE. Then, retrieve the similar and dissimilar regions by Modified Fuzzy Possibilisitic C-Means clustering technique. Extract up to 18 features from Gray Level Co-occurrence matrix and best valued features are selected using sequential forward selection algorithm. According to the selected features, the lung image is classified as normal or abnormal using SVM. If the lung image is abnormal, extract the affected region. The entire processing is done in MATLAB.
Key Words: CLAHE, MFPCM, Lung cancer, Texture features,SVM Classifier,GLCM,CT images.
1. INTRODUCTION
Accurate diagnosis for different types of cancer plays an
important role in determining and choosing the proper treatment to the doctors to assist them. By using classification techniques, possible errors that might occur due to unskilled doctors can be minimized. Challenge facing medical practitioners makes this study of a much greater significance. Since symptoms appear only in the advanced stages thereby causing the mortality rate of lung cancer to be the highest among all other types of cancer, challenging the detection of cancer in its early stages [16]. The objective of undertaking this project is to facilitate doctors to provide the best possible treatment by providing useful insights with the help of predictive models through analysis and diagnosis of lung cancer treatments. This technique can also examine medical data in a shorter time and more precisely. The critical task is to define and specify a good feature space that means the type of features which will discriminate between malignant and benign.
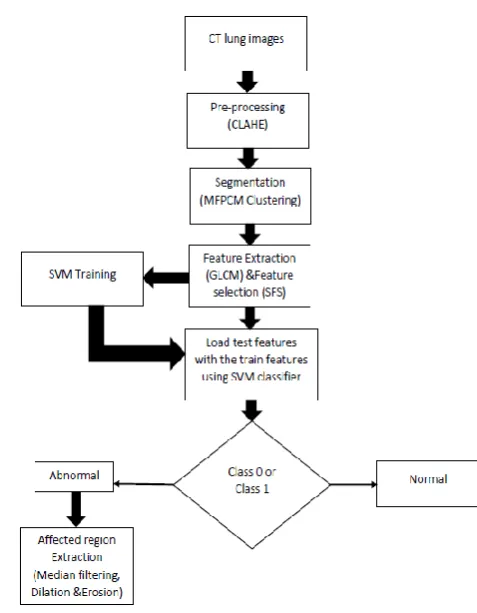
Pre-processing the given test image for reducing noise and for enhancing the contrast by Contrast Limited Adaptive Histogram Equalization (CLAHE).To project the affected portion MFPCM technique segmentation is applied. Extract second order textural features from the GLCM matrix and select best valued features for classification. Finally, according to the selected features the image is classified as normal or abnormal using SVM classifier. MATLAB software is used for all these processes.
2. PROPOSED SYSTEM
The proposed system of detection of lung cancer starts with the collection of CT images followed by proposed
Fig-1: Flowchart of proposed System
2.1 Pre-processing (CLAHE)
[image:1.595.321.560.165.472.2]therefore to the value of the histogram at that pixel value [7]. CLAHE limits the amplification by clipping the histogram at a predefined value before computing the CDF. This limits the slope of the CDF and therefore of the transformation function. The value at which the histogram is clipped, the so-called clip limit, depends on the normalization of the histogram and thereby on the size of the neighborhood region.
2.2 Segmentation (MFPCM)
Segmentation is a technique of unsupervised classification that arranges pattern in the clusters or regions. The first method is to partition the image based on abrupt changes in intensity, such as edges in an image. The second method is based on partitioning the image into regions that are similar according to a predefined criterion.
The MFPCM algorithm attempts to partition a finite collection of elements X={x1, x2, x3………xn} into a collection of c fuzzy clusters with respect to some given criterion. Given a finite set of data, the algorithm returns a list of c fuzzy clusters with respect to some given criterion. Given a finite set of data, the algorithm returns a list of c cluster centers V, such that V=vi, i=1, 2, 3………, c. And a partition matrix U such that U=uij,i=1,2,3,………c, j=1,2,………n Where uij is a numerical value in [0, 1] that tells the degree to which the elements xj belongs to the i-th cluster. Defines a family of fuzzy sets {Ai, i=1, 2, 3……..c} as a fuzzy c partition on a universe of data points X, [17].
The steps of MFPCM algorithm given below [14]:
1. The objective function of the MFPCM can be
formulated as follows:
2. Fix the number of clusters(c).The value of m should be
always greater than one.
3. Calculate U = {μij} represents a fuzzy partition matrix,
is defined as:
4. Calculate T = {tij} represents a typical partition matrix,
is defined as :
5. Calculate V = {vij} represents c centers of the clusters
[4], is defined as:
2.3 Feature extraction and selection
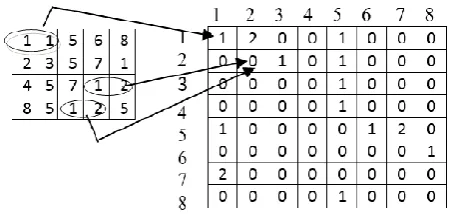
Feature extraction is a crucial step for the CAD system. It uses different methods and algorithms for feature extraction from the segmented image. The extracted ROI can be distinguished as either cancerous or not using their texture properties. Use GLCM (Gray level co-occurrence matrix) for the texture feature extraction form CT scan image. Feature extraction is a dimensionality reduction. Transforming input data into set of features. A statistical method that considers the spatial relationship of pixels is the gray-level co-occurrence matrix (GLCM), also known as the gray-level spatial dependence matrix [7]. The toolbox provides functions to create a GLCM and derive statistical measurements from it. The graycomatrix function creates a gray-level co-occurrence matrix (GLCM) by calculating how
often a pixel with the intensity (gray-level) value i occurs in a
specific spatial relationship to a pixel with the value j. Each
element (i, j) in the resultant glcm is simply the sum of the
number of times that the pixel with value i occurred in the
specified spatial relationship to a pixel with value j in the
input image. Because the processing required to calculate a GLCM for the full dynamic range of an image is prohibitive, graycomatrix scales the input image. The gray-level co-occurrence matrix can reveal certain properties about the
spatial distribution of the gray levels in the texture image
,
[14][15]. In this process, total 18 textural features of all
images in the database are extracted using GLCM (Gray level co-occurrence matrix). Then these features are used for tumor classification, example of four state space is shown in fig 2.
Fig-2: Gray level co-occurrence matrix
[image:2.595.326.552.509.616.2]Feature selection algorithms helps in recognising and classifying systems. If a feature space with large dimension is used, there are chances of decrease in classifier performance in connection to execution time and recognition rate. For determining the best feature subset in same case, automatic feature selection technique can be used for completion of feature space, by varying the number of selected features from 1 to m. By using sequential forward selection algorithm, best features can be easily extracted. After selecting the final feature subset will be sent to classifier for the classification. It is an empty matrix for storing features from SFS [6].
2.4Classification
Next phase in the proposed system is the classification of occurrence and non-occurrence of cancer nodule for the supplied lung image. The classifier used is Support Vector Machine. The aim of classification is to group items that have similar feature values into groups. Classifier achieves this by making a classification decision based on the value of the linear combination of the features. SVM is a binary classification method that takes as input labelled data from two classes and outputs a model file for classifying new unlabelled/labelled data into one of two classes.
Fig 3: SVM Classifier
Training an SVM involves feeding known data to the SVM along with previously known decision values, thus forming a finite training set. It is from the training set that an SVM gets its intelligence to classify unknown data. In SVM, for two class classification problem, input data is mapped into higher dimensional space using RBF kernel. Then a hyper plane linear classifier is applied in this transformed space utilizing those patterns vectors that are closest to the decision boundary, [16], shown in fig-3.
Consider the pattern classifier, which uses a hyper plane to separate two classes of patterns based on given examples {x (i), y (i)}, i=….n .Where (i) is a vector in the input space I=Rk and y (i) denotes the class index taking value 1 or 0. A support vector machine is a machine learning method that classifies binary classes by finding and using a class boundary the hyper plane maximizing the margin in the given training data. The training data samples along the
vectors, and the margin is the distance between the support vectors and the class boundary hyper planes. The SVM are based on the concept of decision planes that define decision boundaries.
1. Training the classifier
In the training phase, known data is given and the classifier is trained. Given training data (xi, yi) for i = 1 ...N, with xi Rd and yi {−1, 1} .The training points satisfy the following conditions.
F(x) = xi + b ≥ +1 for yi = +1
F(x) = xi + b ≤ -1 for yi = -1
2. Testing of data
In testing phase, unknown data are given and the classification is performed using trained classifier. Classification is done by using following decision function.
F (x, {w, b}) = sign (w.x+b)
Every input x is initially mapped into a higher dimension feature space F, by z=φ(x) through a nonlinear mapping φ: Rn→F. W is the normal to the line, x is the feature vector and b the bias. W is known as the weight vector and b is bias.
Fig-4: Input Lung CT image
[image:3.595.38.286.362.532.2] [image:3.595.341.539.390.545.2] [image:3.595.346.536.571.754.2]2.5ROI Extraction
The final phase in the proposed system is the extracting the affected region using median filtering, dilation and erosion.
To remove noise from images median filtering is a nonlinear method used. It is widely used as it is very effective at removing noise while preserving edges. It is particularly effective for removing ‘salt and pepper’ noise. Working of median filter is by moving through the image pixel by pixel, replacing each value with the median value of neighboring pixels [2].
Dilation and erosion are two basic operators in the area of mathematical morphology. The dilation operator need two pieces of data as inputs. First is an image which is to be dilated and second is a small set of coordinate points known as a structuring element [6].
Fig-6: Segmented image using MFPCM
Area opening removes small objects from binary image. That
is, it removes from a binary image all connectedcomponents
(objects) that have fewer than P pixels, producing another binary image. This operation is known as an area opening.
Fig-7:SVM classifier outputs supplied input CT Lung image as ‘Abnormal’.
Consider each of the foreground pixels in the input image in turn to compute the erosion of a binary input image by structuring element. The origin of the structuring element coincides with the input pixel coordinates by each foreground pixel (which we will call the input pixel) superimpose with the structuring element on top of the input image [6].
3. EXPERIMENTAL RESULTS
Here, the input images are chest CT scan images that contain tumors. First image selected from the file specified by the string filename, shown in fig-4. Then each image is resized to 250*250.
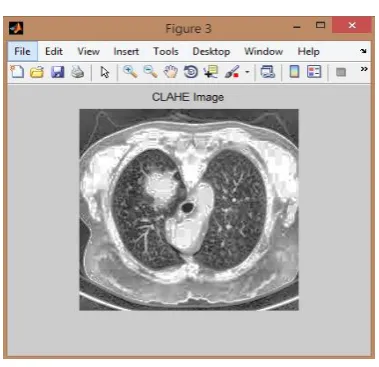
The contrast limited adaptive histogram equalization algorithm separates the images into contextual regions and applies the histogram equalization to all, shown in fig 5. This evens out the allocation of applied gray values and thus makes hidden features of the image more visible by reducing noise and by enhancing the contrast.
[image:4.595.333.533.286.455.2]The MFPCM segmentation is performed for determining the cancer nodules in the lung. This phase will help identify the Regions of Interest (ROI) in the lung nodule that can help identify the cancerous region in fig 6.
Fig -8: Extracted cancer region
Then create a GLCM matrix from the images and calculates the statistics specified in properties from the gray-level co-occurrence matrix. After extracting GLCM features of images, features selected are correlation, energy, cluster prominence and Dissimilarity using sequential Forward Selection algorithm [9] and tumor classification is done.
For this, we have used SVM (Support vector machine) classifier. This classifier is trained first. Here, two class (class1 as abnormal in fig 7 and class 2 as normal) SVM classifier is used. An SVM classifies data to separate all data points of one class from those of the other class, by finding the best hyperplane.
To extract the cancerous part from the lung if it is abnormal, applied median filtering, dilation, erosion and area opening shown in fig 8.
[image:4.595.68.269.288.451.2] [image:4.595.93.232.545.630.2]Fig-9: Analysis of performance
4. CONCLUSION
The proposed system is able to detect both benign and malignant tumors more correctly. Thus, it can be concluded that the SVM used for tumor classification have accuracy of 100% and handle better complex classifications. SVM uses more parameters and have very large feature spaces. MFPCM is faster and noise pixels can be easily predicted with better accuracy and less error rate for MFPCM.
REFERENCES
[1] Mahale, Apoorva, Et Al. "Svm Classifier Based Cad
System For Lung Cancer Detection." Ijecs 6.5 (2017): 2319-724.
[2] Apoorva Mahale1, Chetan Rawool, Dinesh Tolani1,
Deepesh Bathija, Prof. Kajal Jewani, “A Survey On Lung Cancer Detection Using Image Data Analysis And Machine Learning”, International Journal Of Innovative Research In Computer And Communication Engineering Vol. 5, Issue 1, January 2017.
[3] Krishnan, P. Hari, And P. Ramamoorthy. "An Efficient
Modified Fuzzy Possibilistic Cmeans Algorithm For Mri Brain Image Segmentation." Image 2.2 (2012).
[4] Mohanaiah, P., P. Sathyanarayana, And L. Gurukumar.
"Image Texture Feature Extraction Using Glcm Approach." International Journal Of Scientific And Research Publications3.5 (2013): 1.
[5] Gomathi, M., And P. Thangaraj. "A New Approach To
Lung Image Segmentation Using Fuzzy Possibilistic C-Means Algorithm." Arxiv Preprint Arxiv:1004.1768 (2010).
[6] Dwivedi, Sandeep A., R. P. Borse, And Anil M. Yametkar.
"Lung Cancer Detection And Classification By Using Machine Learning & Multinomial Bayesian." Iosr Journal Of Electronics And Communication Engineering (Iosr-Jece) 9.1 (2014): 69-75.
[7] Tidke, Swati P., And Vrishali A. Chakkarwar.
"Classification Of Lung Tumour Using Svm." International Journal Of Computational Engineering Research (Ijceronline. Com) 2.5 (2012): 1254-1257.
[8] Sopharak, A., B. Uyyanonvara, And S. Barman.
"Comparing Svm And Naïve Bayes Classifier For Automatic Microaneurysm Detections." World Academy Of Science, Engineering And Technology, International Journal Of Computer, Electrical, Automation, Control And Information Engineering 8.5 (2014): 797-800.
[9] Tun, Khin Mya, And Khaing Aung Soe, “Feature
Extraction And Classification Of Lung Cancer Nodule Using Image Processing Techniques”, International Journal Of Engineering Research & Technology (Ijert), (2014).
[10] Arvind Kumar Tiwari,“Prediction Of Lung Cancer Using
Image Processing Techniques”, Advanced Computational Intelligence: An International Journal (Acii), Vol.3, No.1, January 2016.
[11] Saad, Mohamed Fadhel, And Adel M. Alimi. "Modified Fuzzy Possibilistic C-Means." Proceedings Of The International Multiconference Of Engineers And Computer Scientists. Vol. 1. 2009.
[12] Fenwa, Olusayo D., Funmilola A. Ajala, And Adebisi A.
Adigun. "Classification Of Cancer Of The Lungs Using Svm And Ann."
[13] Sreenivasarao, Vuda, And Dr S. Vidyavathi. "Comparative Analysis Of Fuzzy C-Mean And Modified Fuzzy
Possibilistic C-Mean Algorithms In Data
Mining." Ijcst 1.1 (2010): 104-106.
[14] Jarrar, Ibrahim, Khaled Assaleh, And A. El-Hag. "Using The Gray Level Co-Occurrence Matrix To Improve The Swedish Hydrophobicity Class System." International Conference On Condition Monitoring And Diagnosis 2014 (Cmd 2014). 2014.
[15] Pathak, Biswajit, And Debajyoti Barooah. "Texture Analysis Based On The Gray-Level Co-Occurrence Matrix
Considering Possible Orientations." International
Journal Of Advanced Research In Electrical, Electronics And Instrumentation Engineering 2.9 (2013): 4206-4212.
[16] Pathak, Akhanda Nand, And Ramesh Kumar Sunkaria.
"Multiclass Brain Tumor Classification Using
Svm." International Journal Of Computer
[image:5.595.38.289.57.195.2]