© 2017, IRJET | Impact Factor value: 5.181 | ISO 9001:2008 Certified Journal | Page 1914
Modeling and Simulation of Solar Photovoltaic dc water pumping
system Using MPPT
Mahesh Kumar
Assistant Professor, Dept. of Electrical Engineering, Rajkiya Engineering college,Bijnor(up), Indian
---***---Abstract -
Solar Photovoltaic (PV) systems are having growing importance in present time of our power system due to its non-polluting, minimum maintenance, and free fuel characteristics.Photovoltaic systems are comprised of photovoltaic cells, devices that convert light energy directly into electricity. Since the source of light is usually the sun, they are often called solar cells. Photovoltaic modules are widely used in DC applications. One of these applications may be in water pumping system. The boost converter has been used boosting the weak output voltage generated by the cells. Boosting of voltage is being done in reality by the maximum power point technique (MPPT). In this technique the automated tracking to give the highest output power is done by an algorithm. This generated power is fed to a boosting load across which the boosted output voltage is being received. This output voltage is then fed to operate a PMDC motor, driving a pumping system.Key Words: Solar PV module, Boost converter, Maximum power point tracking (MPPT), MATLAB (Simulink).
1. INTRODUCTION
Energy is the basic requirement for human lives. So that its supply should be secure and sustainable and at the same time it should be eco-friendly, economic and socially acceptable. The regular hike of fuel prices together with increasing carbon footprints threatens our energy supply. Among all the renewable energy resources such as solar, wind, ocean, geothermal etc. solar is abundant. In recent years, various research work have been done on the application of PV as a alternate energy source. PV energy is one of the promising energy resources as a clean, inexhaustible and can be easily harvested. Several applications employing Solar PV technology
[image:1.595.42.223.666.735.2]Iph + V I Rs Id Rp Ip
Fig no.1. Practical single diode model with and
have been developed for satellite power systems, solar power generation, solar battery charging station and solar vehicles.
At higher solar irradiance it gives greater value of current. Solar cells are connected in combination of series and parallel according to the voltage, current and power rating is required. The model of solar module is configured by using SIMULINK blocks. Boost converter is used for regulating the voltage of the solar PV system. The gate signal of dc-dc converter is given from the MPPT algorithm. Perturbation and observation technique is used for tracking the maximum power point of the PV module. The algorithm takes voltage and current signal from the solar PV module and after optimizing voltage value a referenced duty cycle is generated which is given to dc-dc boost converter.
1.1
Block Diagram of Model
© 2017, IRJET | Impact Factor value: 5.181 | ISO 9001:2008 Certified Journal | Page 1915 the PV pumping systems is one of two main types, either
induction motor or DC motor. In this system, a permanent magnet DC motor is considered.
Fig.2. Block diagram of proposed PMDC Pumping system
2. PHOTOVOLTAIC ARRAY MODELING
2.1: model of the photovoltaic cellPV cell is a semiconductor p-n intersection that transforms sunlight to electrical power.A PV cell is usually embodied by an electrical equivalent of one-diode, resistance series Rs and resistance parallel Rp as shown in Figure 3
Fig3.Equivalent circuit of solar cell with one diode From the figure 3 the different parameters characteristics of the PV cells are: Iph: currents generated by the solar cells (A),Rs: resistance series (Ω),Rp: resistance parallel (Ω),Ga: irradiance from the sunlight (W/m2), T: cell temperature (K) Id: diode current (A),I: output current of the PV (A) ,V: output voltage of the PV (V).
Manufacturer of the solar module gives the parameters needed to model the solar cells. The datasheet which gives the electrical characteristics is calculated under standard test condition STC when the temperature T is 25°C and the irradiance G is 1000 W/m2.
The solar cell is model first, then extends the model to a PV module, and finally models the PV array. From figure 3 the output current of the PV cell is
I = - (1) Where Iph: photon produced by the cell, Id: diode current By Shockley equation, the diode current Id is given
by = -1] (2)
Where I0: reverse saturation current of diode, q: elementary electron charge (1.602x10⁻¹⁹ C), Vd: diode voltage,k: Boltzmann constant 1.381x10⁻²³ (J/K)
T: temperature in kelvin (K)
The relation between voltage and current result by replacing the diode current
I = - -1] (3) The reverse saturation I0 is found by using the above equation. By setting the current I equal to zero and calculating at temperature T1
I( = (4)
The current generated by the solar cells Iph can be approximated with the short circuit current Isc . The current generated can be calculated for other irradiance. The standard current, temperature and irradiance from the datasheet are used to determine the current at different condition.
=
( =( ) ( (5)
Where Isc(T1): current at temperature T1 ,T1 nom the temperature of cell from datasheet at STCG nom: irradiance from datasheet at STC After calculation,gives the equation of the PV
I= - -1 ] – (6)
For a PV module, the cell voltage is multiplied by the total amount of the cells found within the series. The reverse saturation current I0 depends on the temperature T. It is calculated by the following equation.
= )( exp[ ( - )] (7)
2.2: Model of the photovoltaic module The equation used to calculate the I-V curve is
I= - -1 ] – (8)
Where Ns: number of cells in series
The current produced Iph is linearly dependent of the solar radiation and the temperature
= + Ki ∆T ) (9) Where Ki: temperature coefficient current
ΔT: variation temperature
© 2017, IRJET | Impact Factor value: 5.181 | ISO 9001:2008 Certified Journal | Page 1916
= )( exp[ ( - )] (10)
= (11)
The circuit model of the PV module is shown in figure 4. It is a controlled current source with the equivalent resistors and the equation of the model above. The variation of the power being taken by the load varies the PV voltage.
Fig 4: Circuit model of the photovoltaic module 2.3: photovoltaic array
The PV array is composed of several interconnected photovoltaic modules. The modeling process is the same as the PV module from the PV cells. The number of modules connected in series and connected in parallel must be calculated. Photovoltaic array, which consists of multiple modules, linked in parallel and series. Nser is the total quantity of modules within the series and Npar is amount of modules in parallel. The number of modules modifies the value of resistance in parallel and resistance in series. The value of equivalent resistance series and resistance parallel of the PV array are:
=
=
Fig 5 PV Array composed of Nserx Npar modules After extending the relation current voltage of the PV modules to a PV array, the new relation of current voltage of the PV array
I= - }-1]–[
] (12)
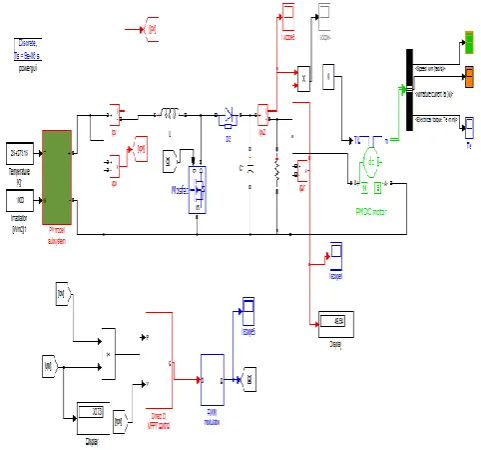
3. Photovoltaic PMDC pumping system with
MPPT boost converter
[image:3.595.306.547.143.368.2][image:3.595.48.238.233.324.2]
Fig 6 -Photovoltaic PMDC pumping system with MPPT boost converter
Figure 6 shows the implementation of solar PV module with DC-DC boost converter. Voltage and current is sensed from the PV module and boost converter and analyzed in the scope. The output voltage is controlled by using PWM technique by changing the duty cycle.
In this model the duty cycle is constant hence MPP is not achieved all the instant of time. For varying irradiance and temperature signal builder block is used. Various signal of output of PV module and DC-DC converter is analyzed in scope.
4. RESULT ANALYSIS
4.1. Photovoltaic Array Simulation
The simulation of a photovoltaic Array was done using MATLAB / SIMULINK.
The Power (W), Voltage (V), Current (A) vs. Time (s) and I-V, P-V curves from the simulation are as shown fig
[image:3.595.43.229.509.652.2]© 2017, IRJET | Impact Factor value: 5.181 | ISO 9001:2008 Certified Journal | Page 1917
Fig.4.1 (b):
Current (A) vs. time (s) of PV array
Fig.4.1(c):
I-V output characteristics of PV array
Fig.4.1 (d):
P-V output characteristics of PV array
4.2: Effect of variation of solar irradiation
The MATLAB code for PV array P-V, P-I and I-V curves of a solar cell are highly dependent on the solar irradiation values. The solar irradiation as a result of the environmental changes keeps on fluctuating, but control mechanisms are available that can track this change and can alter the working of the solar cell to meet the required load demands. Higher is the solar irradiation, higher would be the solar input to the solar cell and hence power magnitude would increase for the same voltage value. With increase in the solar irradiation the open circuit voltage increases. This is due to the fact that, when more sunlight incidents on to the solar cell, the electrons are supplied with higher excitation energy, thereby increasing the electron mobilityand thus more power is generated.
Fig.4.2(a):P-V characteristic for Fixed temperatures and various irradiance at 1000 (W/m2).
Fig.4.2(b) : I-V characteristic for fixed temperatures at
various irradiance at 1000 (W/m2)
Fig.4.2.(c):P-I characteristic for fixed temperatures at various irradiance at 1000 (W/m2).
4.3: Simulation results of the boost converter
model
The simulations were carried out in Matlab/Simulink and the various Voltages (V), Currents (A) and Power (watt) vs. time (s) plots in MPPT and without MPPT were obtained shown in fig
Fig.4.3. (a): Voltage (v) vs. time (s) of boost convertor with MPPT
© 2017, IRJET | Impact Factor value: 5.181 | ISO 9001:2008 Certified Journal | Page 1918 Fig.6.3(c): Current (A) vs. time (s) of boost convertor with
MPPT
Fig.6.3 (d): Current (A) vs. time (s) of boost convertor without MPPT
Fig.4.3 (e): Power (w) vs. time(s) of boost convertor with MPPT
Fig.4.3 (f): Power (w) vs. time (ms) of boost convertor without MPPT
4.4: simulation results of the permanent magnet dc
motor at no load
The simulations were carried out in Matlab/Simulink and the various Torque (N-m) ,Armature Currents(A) and Speed(red/sec) vs. time(s)plots in MPPT and without MPPT were obtained shown in fig
Fig.4.4 (a): Torque (N-m) vs. time (s) of PMDC motor with MPPT
Fig4.4(b): Torque (N-m) vs. time (s) of PMDC motor without MPPT
Fig.4.4(c): Armature Current (A) vs. time (s) of PMDC motor with MPPT
© 2017, IRJET | Impact Factor value: 5.181 | ISO 9001:2008 Certified Journal | Page 1919 Fig.4.4 (e): Speed (red/sec) vs. time (s) of PMDC motor
with MPPT
Fig.4.4 (f): Speed (red/sec) vs. time (s) of PMDC motor with MPPT
5. CONCLUSIONSS
First, the simulations of the PVA showed that the simulated models were accurate to determine the characteristics voltage current because the current voltage characteristics are the same as the characteristics given from the data sheet. In addition, when the irradiance or temperature varies, the PVA models output voltage current change. Then, the simulation showed that Perturb and observe algorithm can track the maximum power point of the PVA, it always runs at maximum power no matter what the operation condition is. The results showed that the Perturb and observe (hill climbing method)algorithm delivered an efficiency close to 100% in steady state. Finally the overall cascaded system consisting of PV array, DC – DC boost converter insisting MPPT and PMDC motor without any load is simulated to show the related results such as torque, speed armature current of PMDC motor at no load and current as well as voltage curves of boost converter . After that the results are compared for the system consisting MPPT and without the same. The result shows that PV water pumping system with MPPT is better than without MPPT system.
6: FUTURE WORK
Extensive simulation of the PV system should be done. A voltage control can be implemented to keep the boost converter output voltage constant .
Finally, a laboratory setup should be made to verify the simulation results with the experimental tests.
REFERENCES
[1] Mummadi Veerachary, "Control of TI-SEPIC Converter for Optimal Utilizatio of PV Power", IICPE, 2010 New Delhi.
[2] N .Chandrasekaran, “Mat labBased Comparative Study of Photovoltaic Fed Dc Motor and PMDC Motor Pumping system” Vol .7, no.5, May 2012.
[3] N. Chandrasekaran, “Modeling and MATLAB Simulation of Pumping System using PMDC Motor Powered by Solar System” ISSN 1450-216X Vol.59 No.1 pp.6-13.(2011)
[4] Taufik, Akihiro Oi, “Modeling and Simulation of Photovoltaic Water Pumping System” 2009 Third Asia International Conference on Modelling & Simulation, 978-0-7695-3648-4/09 $25.00 © 2009 IEEE.
[5] Mohanlal Kolhe, J. C. Joshi, “Performance Analysis of a Directly Coupled Photovoltaic Water-Pumping System” IEEE transactions on energy conversion, vol. 19, no. 3, september 2004.
[6] Hairul Nissah Zainudin, Saad Mekhilef, “Comparison Study of Maximum Power Point Tracker Techniques for PV Systems”, Cairo University, Egypt, Paper ID 278, December 19-21, 2010,
[7] Taufik, Akihiro Oi. “ A Master Thesis on Design and Simulation Of PV Water Pumping System” Presented on 2005. California Polytechnic State University ,San Luis Obispo.
[8] B.Naresh. “ Analysis Of Dc Solar Water Pump and Generalized Photovoltaic Model Using Matlab/Simulink” UACEE International Journal of Advancements in Electronics and Electrical Engineering Volume 1: Issue 1.(2011)
[9] P Siva Deepti has presented “A Novel matlab/simelectronics Modal of PV Array with MPPT Controllar” International Journal of Electrical and Electronics Engineering (IJEEE) ISSN (PRINT): 2231 – 5284, Vol-2, Iss-1, 2012.