© 2018, IRJET | Impact Factor value: 6.171 | ISO 9001:2008 Certified Journal | Page 46
Performance Improvement of Wireless Network Using Modern
Simulation Tools
Ms. Nimisha Dinesh Deval
1, Prof. Mrs. S. P. Pawar
21
ME student CSE Dept, SVERIs college of Engineering, Pandharpur, Maharashtra, India
2Assistant Professor CSE Dept, SVERIs college of Engineering, Pandharpur Maharashtra, India
---***---Abstract –
In this paper, we deal with congestion controland avoidance in wireless ad-hoc network. For simulation, we used ns-3, a discrete event and open source simulator considering Optimized Link State Routing (OLSR), Adhoc On-demand Distance Vector (AODV). We present the network performance by using different number of packet size and hello interval of routing algorithm.
Key Words: OLSR, AODV, congestion and contention
window, ns3, TCP NewReno, hello interval.
1. INTRODUCTION
Ad hoc network has been popular research topic with the growth of Laptop and Wi-Fi wireless networking since mid-1990s. An ad hoc network is a network with completely self organizing and self-configuring capabilities, requiring no existing network infrastructure or administration. The Transmission Control Protocol (TCP) is a transport-layer protocol, designed to provide a reliable end-to-end delivery of data over unreliable networks, and it performs well over conventional wired networks. However, TCP encounters some challenges in multihop ad hoc networks. Due to the instability and shared wireless channels, ad hoc networks may suffer from impairments, e.g., route failures, drops due to Medium Access Control (MAC) contentions and interference, and random channel bit errors. In theory, TCP should work without considering the implementation at lower layers, but the performance of TCP significantly degrades in such unreliable networks.
Most of the work for ad hoc network has been done in simulation, as in general, a simulator can give a quick and inexpensive understanding of protocols and algorithms. So far, there are many simulation results on the performance of ad hoc network, e.g. in terms of throughput, mean delay, mean jitter, etc.
2. TCP NewReno: Variant of TCP
There are different variants of TCP are available. But we have used TCP NewReno in our study for congestion control and avoidance mechanism.
Before NewReno we will take review of Reno. TCP Reno adds some intelligence over Tahoe so that lost packets are detected earlier and the pipeline is not emptied every time a packet is lost. The Reno provides an algorithm called
‘Fast Re-Transmit’. When 3 duplicate ACK’s are received in TCP Reno, it gives that the segment was lost; hence retransmission of the segment without waiting for timeout is done. Reno performs very well over TCP when the packet losses are in small amount. Reno doesn’t perform too well and its performance is almost the same as Tahoe under conditions of high packet loss, if there are multiple packet losses in one window then.
TCP NewReno is efficient than Reno because it is able to find out multiple packet losses than the Reno.
Like TCP-Reno, NewReno also enters into fast retransmit when it receives multiple duplicate packets. NewReno is different from TCP-Reno. In NewReno it doesn’t exit fast recovery until all the data which was out standing at the time it entered fast-recovery is acknowledged.
3. OVERVIEW OF ROUTING PROTOCOL
In ad hoc network there are different routing protocols are available. But from these protocols we have used OLSR and AODV in our research work.
3.1 OLSR
The link state routing protocol means most popular today in the open source world is OLSR. One of the proactive routing protocols, OLSR protocol, which builds up a route for data transmission by maintaining a routing table inside every node of the network. To calculate routing table, knowledge of topology information is used. This knowledge is exchanged by means of Topology Control (TC) packets. The TC packets in turn are built after every node has filled its neighbors list. This list contains the identity of neighbor nodes. A node is considered a neighbor if and only if it can be reached via a bi-directional link.
OLSR makes use of HELLO messages to find its one hop neighbors and its two hop neighbors through their responses. The sender can then select its Multi Point Relays (MPRs) based on the one hop node which offers the best routes to the two hop nodes. By this way, the amount of control traffic can be reduced. Each node has also an MPR selector set. MPR selector set calculate nodes that have selected it as an MPR node.
© 2018, IRJET | Impact Factor value: 6.171 | ISO 9001:2008 Certified Journal | Page 47 with hop-count as target metric. In this way, a shortest path
can result to be also not good, from the point of view of the packet error rate.
3.2 AODV
AODV is a reactive routing protocol, so a route is created when a node wants to send a packet. Every node sends periodically hello messages to find its neighbours.
When a node has to send a packet to destination which is not neighbour send a Route Request (RREQ) to neighbours to find a path, AODV makes sure these routes do not contain loops and tries to find the shortest route possible. AODV is also able to handle changes in routes and can create new routes if there is an error.
Ad hoc On-Demand Distance Vector (AODV) routing is a routing protocol for ad hoc networks. It is an on-demand and distance-vector routing protocol, meaning that a route is established by AODV from a destination only on demand. AODV is capable of unicast as well as multicast routing. It keeps these routes as long as they are desirable by the sources. Additionally, AODV creates trees which connect multicast group members. The trees are composed of the group members and the nodes needed to connect the members. The sequence numbers are used by AODV.
4. SIMULATION DESCRIPTION AND DESIGN
For simulation there are different simulator are available such as NS-2, NS-3, Qualnet, MATLAB, etc. Among the all we have used NS-3 to perform a simulation of ad hoc network.
4.1 NS-3
The ns-3 simulator is developed and distributed completely in the C++ programming language, because it better facilitated the inclusion of C-based implementation code.
The goals of ns-3 are set very high: to create a new network simulator aligned with modern research needs and develop it in an open source community. Users of ns-3 are free to write their simulation scripts as either C++ main()
programs or Python programs. The ns-3’s low-level API is oriented towards the power-user but more accessible “helper” APIs are overlaid on top of the low-level API.
In order to achieve scalability of a very large number of simulated network elements, the ns-3 simulation tools also support distributed simulation. The ns-3 support standardized output formats for trace data, such as the pcap format used by network packet analyzing tools such as tcpdump, wireshark and a standardized input format such as importing mobility trace files from ns-2.
[image:2.595.303.565.210.526.2]The ns-3 simulator is equipped with Pyviz visualizer, NetAnim-3.017 which has been integrated into mainline ns-3, starting with version 3.25. It can be most useful for debugging purposes, i.e. to figure out if mobility models are what you expect, where packets are being dropped. It is mostly written in Python, it works both with Python and pure C++ simulations. The function of ns-3 visualizer is more powerful than network animator (nam) of ns-2 simulator.
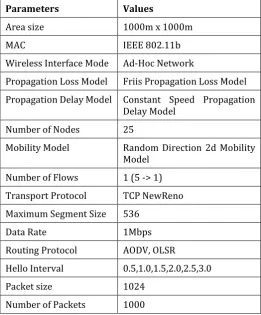
Table-1 briefs the simulation parameters of our research.
Parameters Values
Area size 1000m x 1000m
MAC IEEE 802.11b
Wireless Interface Mode Ad-Hoc Network
Propagation Loss Model Friis Propagation Loss Model Propagation Delay Model Constant Speed Propagation
Delay Model Number of Nodes 25
Mobility Model Random Direction 2d Mobility Model
Number of Flows 1 (5 -> 1) Transport Protocol TCP NewReno Maximum Segment Size 536
Data Rate 1Mbps
Routing Protocol AODV, OLSR
Hello Interval 0.5,1.0,1.5,2.0,2.5,3.0
Packet size 1024
Number of Packets 1000
Table-1: Simulation parameters
5. RESULTS
As per table 1 we have calculated the following results of following parameters: Throughput (Mbps), mean delay. Mean jitter.
5.1Throughput
© 2018, IRJET | Impact Factor value: 6.171 | ISO 9001:2008 Certified Journal | Page 48 Fig-1: Throughput
5.2 Delay
This criterion shows the duration of time required to deliver a packet from the sender to the receiver. Fig 2 shows mean delay in the simulation of decided ad hoc network.
Fig-2: delay 5.3 Jitter
This criterion shows the duration of time between two packets.Fig 3 shows the jitter graph at different packets.
Fig-3: jitter
5.4 PDR
[image:3.595.36.279.71.245.2]PDR is the ratio of total received packets to the total packets sent. Fig 4 shows the packet delivery ratio (PDR).
Fig-4: PDR
5.5 Packet Lost Ratio
[image:3.595.310.547.137.312.2]It is the difference of total sent packets and the total received packets. Fig 5 shows packet lost ratio.
Fig-5: Packet Lost Ration
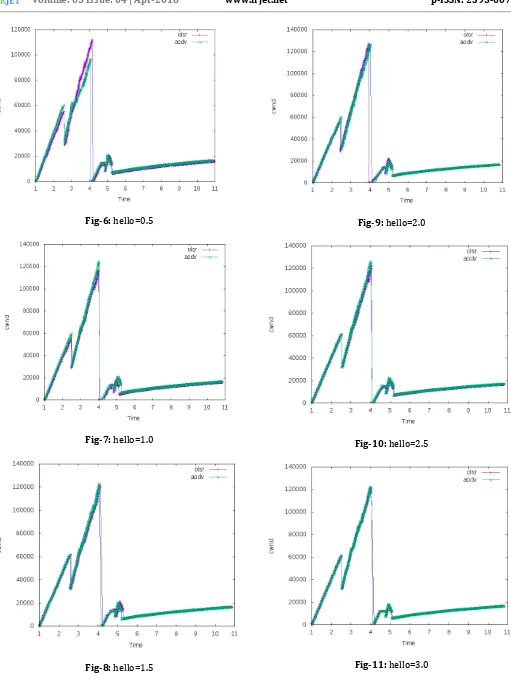
5.6 Congestion window
[image:3.595.44.275.335.510.2] [image:3.595.311.551.399.580.2]© 2018, IRJET | Impact Factor value: 6.171 | ISO 9001:2008 Certified Journal | Page 49 Fig-6: hello=0.5
Fig-7: hello=1.0
Fig-8: hello=1.5
Fig-9: hello=2.0
[image:4.595.42.553.57.747.2]Fig-10: hello=2.5
© 2018, IRJET | Impact Factor value: 6.171 | ISO 9001:2008 Certified Journal | Page 50 5.7 Screenshots of animation
[image:5.595.34.288.142.503.2]Fig 12, 13 shows the working of NetAnim i.e., animator used to show the simulation. By using this animator we can see the mobility of nodes in a given area.
Fig-12: NetAnim animation
Fig-13: NetAnim trajectory
6. CONCLUSION
In this paper, we evaluated by simulation, throughput, mean delay, mean jitter, PDR, packet lost ration and congestion window of an ad hoc network. We used OLSR and AODV protocol and sent packets using TCP. We made simulation for different number of packets in the network. So, according to that we found the result as hello interval increases congestion in network decreases. Due to that the throughput of the network also increases.
REFERENCES
[1] Makoto Iked, et al., “Congestion Control for Mul i-flow
Traffic in Wireless Mobile Ad-hoc Networks”, 2012 Sixth International Conference on Complex, Intelligent, and Software Intensive Systems.
[2] Lakshman Naik.L, et al., “Analysis of Transmit Power
Effects in Ad-hoc Network Protocols using Network
Simulator-3”, International Research Journal of Engineering and Technology (IRJET), volume :03, issue:07, July-2016.
[3] Xin Ming Zhang, et al., “TCP Congestion Window
Adaptaion Through Contention Detection in Ad Hoc Networks”, IEEE TRANSACTIONS ON VEHICULAR TECHNOLOGY, VOL. 59, NO. 9, NOVEMBER 2010.
[4] Jamal Toutouh, et al., “Intelligent OLSR Routing Protocol
Optimization for VANETs”, IEEE TRANSACTIONS ON VEHICULAR TECHNOLOGY, VOL. 61, NO. 4, MAY 2012.
[5] Pratima Bhujbal, et al., “Study of Various
Congestion-control Protocols in Network”, (IJCSIT) International Journal of Computer Science and Information Technologies, Vol. 5 (3) , 2014, 3890-3894.
[6] Supriya Singla, et al., “Comparison of Routing Protocol of