Personalized Web Recommendation Combining
User-centered Collaborative Technique with URL Weighting
Delwar H Arif
Department of CSE Islamic University of
Technology Gazipur, Bangladesh
AHM Sofi Ullah
Department of CSE Islamic University of
Technology Gazipur, Bangladesh
K M Habibullah
Department of CSE Islamic University of
Technology Gazipur, Bangladesh
Md Ali Al Mamun
Department of CSE Islamic University of
Technology Gazipur, Bangladesh
ABSTRACT
Web usage mining has become very popular in various business areas for learning more about the users’ browsing behavior and recommending the perfect product in which the user is interested in. At present there are many systems that recommend for the users on web usage mining, but most of the systems suffer from inappropriate scalability, which would lead to very weak recommendations. In this paper we proposed a new technique that gives emphasis on page view weighting based on transaction timing and building a session pattern graph for each session. This technique provides the scope for better scalability and also provides effective number of recommendations with remarkable accuracy.
Keywords
Web usage mining, URL Weighting, Weighted pattern graph, Recommendation score, Page weight.
1.
INTRODUCTION
E-commerce is growing rapidly keeping pace with the web. Its rapid growth has made both companies and customers face a new dimension. Whereas companies are facing hard time to survive due to more and more competitions, the opportunity for the customers to choose among more and more products have increased the burden of information processing before they select which meet their needs [1, 2]. This phenomenon of e-commerce on the internet gives scope to the companies to provide more and more choices for the customers [3]. Customers have to filter all the information to find the perfect match as their desire. “Information filtering” is a rapidly evolving method being used to manage large information flows. The fundamental objective of this “information filtering” is to only expose users to information that would be relevant to them [4]. Many approaches have been made to ease the customers’ selection process. Usage information can be used to re-structure a website in order to better serve the needs of the users of the site [5]. One of the approaches is recommender system. However it’s very hard to recommend to the users as their tastes and desires are transient and fractal. Many approaches have been suggested for recommender system as it assumes research interests [6].
Recommendations are generally content-based or usage based. The collaborative filtering (CF) approach is usage based [7]. Several recent proposals have attempted web usage mining as an effective technique to overcome some of the problems associated with traditional techniques [8, 9, 10] or it can be used as a technique of improving the flexibility or scalability of the site. There are other approaches that are useful in recommendation, like pattern discovery. The discovery of patterns from the usage data, such as sequential patterns, cluster of user sessions or pages is not sufficient for
performing the tasks. Creating a good and useful aggregate profile is the critical step. The discoveries of aggregate usage profile through clustering, as well as other web mining techniques were discovered by several research groups [10, 11].
In this paper, we describe the design and its implementation of a usage based system that uses data mining technique to represent the recommendation system in a dynamic way. We also discuss the necessary system architecture and all the steps of data preparation, result presentation and making the session graph for determining usage patterns according to the timing threshold, finding out the similarity between profiles and URL weighting technique. At last we provide the experimental result that surely represents the accuracy and flexibility of the system.
2.
RELATED WORK
Since recent years recommender system applications have found various uses [Shardanand an Maes 1995; Hill et al. 1995; Konstan et al. 1997; Terveen et al. 1997; Schafer et al. 1997; Kitts et al. 1997; Mobasher et al. 2000; Beeferman and Berger 2000] such as recommending products, movies, TV programs that customers would most likely buy. Researchers have proposed recommender systems for online personalization through web usage mining. To predict the future navigational links a model has been developed with the help of K-means clustering [12]. Using the previous model a group of researchers made improvement on predicting the accuracy. A novel approach [13] was proposed using longest common subsequence. Using various data mining techniques usage based personalization was proposed in [14]. Researchers have experimentally evaluated two different techniques based on clustering techniques [15]. Zaiane et al. [16] and similarly Hugan et al. [17] propose the use of cube models to extract knowledge about the user behavior. In [18] Lee et al. propose an adaptive web system that analyzes user browsing patterns from their access records. Many advanced features, such as Probabilistic Latent Semantic Analysis (PLSA) [19, 20, 21, 22], association rule mining [23], Robust Collaborative Filtering [21, 24, 25], K-Nearest Neighbor Algorithms [22, 25]. As of today, CF system has been widely adopted in web recommendation applications [26, 27, 28] and the researches show that they are user-based CF.
3.
SYSTEM ARCHITECTURE
active session, the system matches URL request with the clusters for recommendation.
[image:2.595.59.222.110.302.2]3.1 Usage Mining Steps and
Recommendation
Fig. 1: Architecture of the recommendation System.
This process leads to a set of hypertext links which is being presented to the users. In this paper we tried to build up a session graph for pattern analysis and it will help us to know the access pattern and matching with the previous profiles. This will lead to a set of recommendations for the users as they desire.
3.2 Data Processing
Data processing for the usage mining is being done in different steps. In this paper we tried to describe every necessary step briefly. At first we need to find the inputs for the system server logs, site files etc. This will generate output of session files, transaction files with every detail on the users’ access behavior. Before we can use the data from the server logs we have to clean the data. The HTTP protocol requires a separate connection for every file that is requested from the server. Therefore, if a user requests to view a page, the server log entries a single HTML page request but if the page contains scripts and images or style sheets then many requests are entered in the log for one page request. For producing session and transaction file we need to consider only the log entries of HTM, HTML, PHP, ASP, ASPX files. This is just because user doesn’t explicitly request for any style sheet file, scripts or images. This type of usage mining gives us a picture of the users’ behavior. To clean up data, as an example we can first reduce log entries which having file name suffixes such as GIF, gif, jpeg, JPEG, jpg, JPG etc. We can have a default list of suffixes to remove from the log. In case of graphical website which has images, we can modify the default list of suffixes not to avoid image files. Thus a default list of suffixes can help us to clean the log very efficiently.
After cleaning the data and getting the URLs we need to identify unique users. This is a pretty tough task because of business firewalls, proxy servers and local caches. In web usage mining we use server logs to determine whether the user is unique or not. To find out unique users we first look for distinct IP addresses. If the IP addresses are distinct then we can say that the individual user is unique. Sometimes one IP address is shared by many users and that can be a problem to find unique user. It will also be very confusing if the user
uses a proxy server for requesting through HTTP protocol. But whatever the problem is, it seems to have a solution. Even if the IP address is same, if the agent log shows a change in browser software or Operating system then a reasonable assumption is to make that each different agent represents a unique user. Real confusion comes into the field when multiple users using same IP address and same browsers on same type of machines can be easily mistaken as a single user if they are looking at the same set of pages. Inversely a single user having two different browsers can be mistaken as multiple users. In this paper we have checked all the necessary steps to find out unique users with utmost accuracy.
It is very common that user will visit the file more than once. The actual for identifying session is to divide the page view accesses of each user in individual session so that the system can match with the previous session and current session to find out most accurate recommendation. The most popular way of determining the session is through timeout. A timeout procedure is that the time between two page requests exceeds a certain limit. Many commercial sides use a 30 minute for their default time out.
4.
RECOMMENDATION SYSTEM
From the previous chapter we have got individual sessions. A session file contains a sequence of page view requests, if valid URLs of n page views, we can write it as
(1)
And a set of session of m sessions, we can write it as
(2)
Where, is a subset of
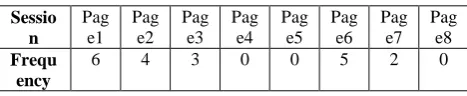
From the session file we get the matrix of page views. Each row represents a session and each column represents a frequency of that particular page in the session. An example is given in the next table below,
Table 1: Page view Matrix
Sessio n
Pag e1
Pag e2
Pag e3
Pag e4
Pag e5
Pag e6
Pag e7
Pag e8 Frequ
ency
6 4 3 0 0 5 2 0
Now comes the turn for weighting the URLs, The weights can be determined in a number of ways, for example binary weights can be used to represent existence or non-existence in the transactions. In another case weight can be a function of the duration of the associated page view in order to capture the user’s interest in a page. The weights may also, in part, be based on domain-specific significance weights assigned by the analyst. In this approach, we have used a numerical weight to each page view. If the page is not visited yet, then it has a frequency of 0 or null. Here we have represented each session
as vector using vector space model. So we can write, (3)
[image:2.595.312.546.502.550.2]Table 2: Transaction Normalization Matrix
Now that we have got the weights based on users interests on the page, we have come to think about the duration of each page (total visit time on that page in seconds) and added it to the table for consideration, thus the Table 2 looks like the table below,
TABLE 3: Normalized Transactions with Duration
Now that we have weighted the page and tagged each of them with the duration and we can find the access pattern and modify it according to the timing threshold. Here is the algorithm we have used to build access pattern graph.
ACCESS-PATTERN-GRAPH (Node n)
if SEARCH-FOR-EXISTENCE (Node n) == TRUE set Weight w of Node n = Weight w++
else INSERT-NODE (Node n)
INSERT-NODE (Node n)
if tree_length == NULL
set Node n as Root Node and set Weight w = 1
elseif tree_length >= 1
ifWeight w of Parent Node <=1
set Node n as Left Child to Parent Node and set Weight w =1
else
set Node n as Right Child to Parent Node and set Weight w
=1
So, let put the session file in the graph to analyze the pattern. Before we can come up with the pattern analysis we have to determine an aggregate user profile by session clustering. Each cluster presents session with similar patterns. For clustering we have used multivariative clustering method which leads us to a set of clusters which can be represented like below
(4)
Here is a subset of the set of page views .
For determining the aggregate profile of the user we have used the following equation:
(5)
Here is the number of the clusters in . is the weight of
the page view represented by the page view URL in the Cluster. Each of the URL clusters we got from the usage mining can be presented as a vector
(6)
Where,
On the other hand the active session can be represented as a vector
(7)
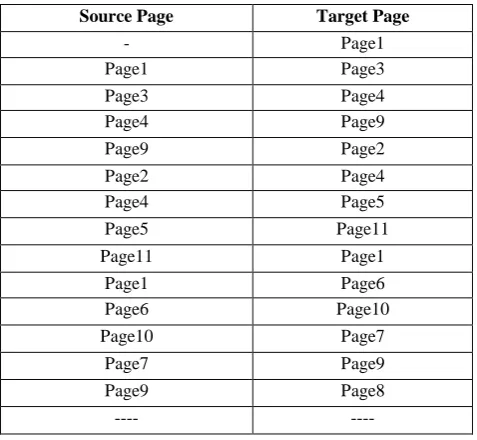
[image:3.595.310.549.250.470.2]Where, is a significant weight of the corresponding page, view in the session. Now we have everything in place for generating recommendations so now we will analyze the graph pattern. Lets have an example of the graph to determine the access pattern tree. In the below table we will see an example of a partial sessions access pattern.
TABLE 4: Sample Session Access Pattern
Source Page Target Page
- Page1
Page1 Page3
Page3 Page4
Page4 Page9
Page9 Page2
Page2 Page4
Page4 Page5
Page5 Page11
Page11 Page1
Page1 Page6
Page6 Page10
Page10 Page7
Page7 Page9
Page9 Page8
---- ----
If we look at the table that the access pattern is simple and the user browsed different pages and in different frequency. So, why do we need to determine the graph? It can save our time and cost by producing generous and accurate recommendations. We build up the graph so that the graph represent only those pages which are valid and having a time tag that is greater than the timing threshold. So if we represent the tree graph with the help of matrix then we surely can find the most weighted page and the children pages of that page. To find out the exact page views for recommendations we need to do another task that is training or testing task. It helps us to find the most weighted pages and the significance of the page from the aggregate profiles. If the aggregate profiles contain number of clusters and number of pages, then the significance can be determined by the following equation:
(8)
This equation represents the maximum value of each page in the profile. So now it will be easier to find out the similarities and recommend form the maximum valued pages which also have coordination with the weighted graph.
4.1
Recommendation Generation
Recommendation generation is an online process. In this step system monitors the current profile and matches with the previous profiles and clusters to find out the similarity between two profiles for generating the recommendations. We Sess
ion Pag
e1 Pag
e2 Pag
e3 Pag
e4 Pag
e5 Pag
e6 Pag
e7 Page
8 Wei
ght
0.30 0.20 0.15 0 0 0.25 0.10 0
Sessio n
Pa ge 1
Pa ge 2
Pa ge 3
Pa ge 4
Pa ge 5
Pa ge 6
Pa ge 7
Pa ge 8 Weigh
t 0.3
0 0.2
0 0.1
5
0 0 0.2 5
0.1 0
0
Durati on(sec ond)
48 7
52 0
35 4
0 0 34
3 17
compute the profile matching score with the help of normalized cosine similarity measures for vectors:
(9)
Here represents the weight of the page in cluster. The profiles having a match greater than a threshold value is selected for the recommendation procedure. The pages having the maximum values in the matched cluster having a matching value greater than threshold value are considered for recommendation.
Hence, we get the maximum weighted pages having a time stamp from the graph representation matrix and can easily determine the children pages for recommendation if they are not already in the active session.
5.
EXPERIMENTAL RESULTS
We used the access logs from the website of our university. Our university was the host of an inter university program that needed registration and page frequent visits. So we collected that user logs for our research. After processing and removing unnecessary data from the web log we have found more than 15000 valid transactions. The total number of page views was more than 15 in different categories excluding the common landing page and the common logoff or sign out page. With this huge amount of data we tried to calculate the recommendation set for a user while the user is browsing the pages of the site. So we have divided the dataset in two parts, first one the training samples and the other one is testing samples. With the training samples we have trained the system to act on the recommendations and then we have tested the training samples. We have used 55% of our data for training purpose and 45% of the data for testing purpose.
[image:4.595.327.533.226.306.2]From the profile derivation method discussed in this paper earlier resulted in a total 13 URL clusters. Page views having a weight of 0.5 have been selected for the profile. Each cluster represents several sessions of navigational patterns, which has been useful to determine the session access pattern graphs.
TABLE 5: Example of URL clusters representing aggregate profile
Page Weight
Page view 0.50 page x11
0.52 page x12
0.55 page x13
0.67 page x14
Page Weight
Page view 0.66 page x21
0.73 page x22
0.54 page x23
0.81 page x24
0.55 page x25
0.50 page x26
Page Weight
Page view 0.59 page x31
0.52 page x32
0.83 page x33
Page Weight
Page view 0.62 page x41
0.50 page x42
0.64 page x43
0.50 page x44
Now we have the clusters to evaluate the recommendation scores for recommendation. For each active session we have calculated a set of recommendation. To determine recommendation set based on active session there we used a
flexible amount of threshold level. We have used threshold from 0.2 to 0.9.
[image:4.595.351.508.440.521.2]Each element on the recommendation set was chosen if they had a higher value then the threshold value. It’s mentionable that we have excluded pages like common landing and logout. We have tried to produce fewer recommendations with high efficiency but when the threshold is low the number of average recommendations is high and when the threshold is high then the number of average recommendation is low. Let’s have an overview of average number of recommendations in respect of threshold.
TABLE 6: Average number of recommendations
Threshold Average number of recommendations
0.2 26.8
0.3 22.5
0.4 18.2
0.5 16.7
0.6 12.1
0.7 9.8
0.8 6.7
0.9 3.9
[image:4.595.71.263.533.702.2]The average number of recommendations is calculated to measure the accuracy of the recommendation system. To determine the accuracy of the system we have used different window size and compared one to another. The overall accuracy of the system will be higher if the system produces small set of recommendation with high recommendation score. This recommendation score of a particular URL is the mean of all URLs of the active sessions. Mean of all URLs is computed as the recommendation score.
TABLE 7: Recommendation scores according to threshold
Threshold Recommendation Score
0.2 0.97
0.3 0.96
0.4 0.93
0.5 0.92
0.6 0.84
0.7 0.76
0.8 0.65
0.9 0.53
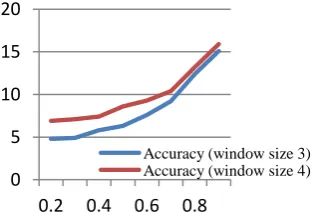
To compare the accuracy of the system, we had to compare the accuracy of different window size. We have taken 2 different window sizes to compare the results.
Fig. 2: Accuracy for window size 3 & 4 0
5 10 15 20
0.2 0.4 0.6 0.8
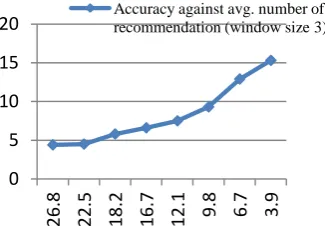
[image:4.595.335.495.568.676.2]Fig. 3: Accuracy of the recommendation system against avg. number of recommendation (window size 3)
Now we can see the effect of window size on the accuracy of the system. Here comes the turn of the access pattern graph to show its effectiveness on the system. We have considered the number of valid child of a root in the graph. The access pattern graph is used to get the access pattern of a user and then the invalid transactions were discarded from the graph and only the valid transactions remained on the graph as child. In this case the validness of a transaction were measured in two ways; first, page view weight should be greater than the weight threshold and second, the average timing on the page should be equal or greater than the timing threshold. So for this two kinds of verification the number of transactions get really low and the session graph gets actual values of the page views. It helps to build an effective session graph. So the session graphs for a particular user are being stored for future reference. In our case we have used PHP and mySQL database to save the graph data or the access pattern. Then again we have matched the current session data of a particular user (identification process is discussed earlier) with previous sets of data. If the current user is in a root position of a graph then our recommendation system gave a set of recommendation with the child nodes as it’s element excluding already visited pages. We have calculated the accuracy of this system taking a measurement with session window size 3 against the number of recommendation and against the recommendation threshold. If the threshold increases the number of child under every root node increases and that increases the number of recommendations. When the number of recommendation increases then the accuracy decreases here.
[image:5.595.330.525.80.199.2]Fig. 4: Accuracy of the graph recommendation system against avg. number of recommendation (window size 3)
Fig. 5: Accuracy of the graph recommendation system against threshold
Now if we compare our two recommendation system then we can find out that, from the access pattern graph we can easily and flexibly get excellent recommendation depending on users previous choices.
Fig. 6: Comparison between access pattern graph accuracy and collaborative method accuracy (window
size 3).
So from the above figure we can see that when the number of average recommendation is high then access pattern graph method gives less accurate result then collaborative method but when the number of average recommendation is less the access pattern graph method gives good result in comparison to collaborative method.
6.
CONCLUSION AND FUTURE WORK
Day by day the web is getting crowded and pulling out the correct information is getting very difficult. On the other hand the web is rapidly changing and the users’ desire is not the same all the time. In this paper we have tried to make an effective recommendation system based on usage mining and access pattern analysis. In future more works can be done on the active session user mining of the specific user and recommend them with most interested pages from other concurrent users. This will help us to find up to date and fresh recommendation while browsing the website. There will be no need to store all preferred choices of users because the system will search for concurrent users’ choices and it will recommend that for the time being. This policy of recommendation can help in rapidly changing sites or e-commerce site.
Though the users’ desire is changing and we need to provide recommendations it won’t be possible to recommend hundred percent correctly for any users because the user might not be interested on a product or page he or she once visited or bought (e.g. car, freezer) etc. so we have tried make a flexible recommendation system that can give the vendor a range of 0
5 10 15 20
26.8 18.2 12.1 6.7
Accuracy against avg. number of recommendation(window size 3)
0 5 10 15 20
26.8 22.5 18.2 16.7 12.1 9.8 6.7 3.9
Accuracy against avg. number of recommendation (window size 3)
0 5 10 15 20
0.2 0.3 0.4 0.5 0.6 0.7 0.8 0.9
Accuracy (aginst threshold)
0 5 10 15 20
26
.8
22.5 18.2 16.7 12.1 9.8 6.7 3.9
[image:5.595.326.532.292.405.2] [image:5.595.72.235.565.678.2]opportunities for representing the recommendation using timing or weighting threshold.
7.
REFERENCES
[1] Kim E., Kim W., Lee Y. (2000) “Purchase Propensity Prediction of EC customer by combining multiple classifiers based on GA”. International conference on electronic Commerce (2000) (P.P 274-280)
[2] Kim J., Lee B., Shaw M., Ehag H., Nelson M. (2001) “Application of decision tree induction techniques to personalized advertisements on internet storefronts”. International journal of Electronic commerce, 5(3), 45-62
[3] Schafer J., Konstan J.A., Reidl J. (1999) “Recommendation systems in e-commerce”. ACM conference on Electronic commerce. EC -99
[4] Sneha, Y.S., G. Mahadevan, M. Prakash (2011) “Recommendation systembased on web usage mining a ssemantic web, A survey”. International journal on recent trends in engineering and technology, vol.05, No.01, march-2011
[5] R.Cooley., B. Mobasher, J.Srivastava “Data preparation for mining world wide web browsing pattern”.
[6] G. shani., A. Gunavardana. (2009) “Evaluating Recommender System”. Microsoft Research, MSR-TR-2009-159 NOV-2009
[7] G. Ganapathy., K. Arunesh. (2011) “Models for recommender systems in web usage mining based on user ratings”. Proceedings of the world congress on engineering 2011, Vol-1 WCE 2011, July 6-8, 2011, U.K
[8] B. Mobasher, R. Cooley, J. Srivastava (1999) “Creating adaptive websites through usage based clustering of URLs”. IEEE knowledge and data engineering workshop (KDEX’99), 1999
[9] O. Nasaoui, H. Frigui, A. Joshi, R. Krishna puram (1999) “Mining web access logs using relational compatitive fuzzy clustering”. Proceedings of the eight international fuzzy systems association world congress, August-1999
[10] P.S. Yu. (1999) “Dataminig and personalization techniques”. International conference on database systems for advanced applications. (DASFAA99), April-1999, Taiwan.
[11] T. Yan., M. Jcobsen, H. Garcia-molina, U. dayal. (1996) “From user access patterns to dymanic hypertest linking”. 5th
World Wide Web conference, Paris, France – 1996
[12] AlMurtadha, Y.M., M.N.B. Sulaiman, N.Mustapha and N.I. Udzir (2010). “Mining web navigation profiles for recommendation system”. Information Technology Journal, 9:790-796. DOI: 10.3923/itj.2010.790.796
[13] Mehrdad Jalai, Norwati Mustapha, Ali Mamat, Md. Nasir B Sulaiman. (2009) “A Recommender System for Online Personalization in WUM Applications”. Proceedings of the world congress on engineering and computer science 2009 Vol-II, San fransisco, USA.
[14] B.Mobasher, R.Cooley, J. Srivastava (2000) “Automatic Personalization based on web usage mining”. Commun. ACM, 43:142-151. DOI:10.1145/345124.345169
[15] B.Mobasher, H. Dai, T. Luo, M. Nakagawa (2002) “Discovery and Evaluation of aggregate usage profiles for web personalization”. Commun. ACM, 6:61-82. DOI: 10.1023/A:1013232803866
[16] O.R. Zaiane, M.Xin, J.Han (1998) “Discovering web access patterns and trends by applying overlapping and data mining technology on web logs”. Proceedings of advances in Digital Libraries conference (ADL98), Santa Barbara, CA, April – 1998
[17] Z.Huang (2001) “A cube model for web access sessions and cluster analysis”. Proceedings of the 7th ACM SIGKDD International Conference on Knowledge discovery and Data Mining, 2001
[18] J.H. Lee, W. K. Shiu (2004) “An adaptive website system to improve efficiency with web mining techniques”. Advanced Engineering Informatics 18(3) (July 2004), 129-142
[19] X.Jin, Y.Zhou, B. Mobasher (2004) “Web Usage Mining Based on Probabilistic Latent Semantic Analysis”. KDD’04, ACM 1-58113, 2004
[20] G.Xu, Y.Zang, X.Zhou (2005) “A Web Recommendation technique Based on Probabilistic Latent Semantic Analysis”. WISE2005, LNCS3806, pp 15-28, Springer 2005
[21] B. Mehta, T.Hofmann, W.Nejdl (2007) “Robust collaborative Filtering” RecSys’07, ACM 978-1-59593-730-8/07/0010, pp 49-56, 2007
[22] JJ.Sandiv, B.Mobasher, R.Burke (2008) “A survey of collaborative Recommendation and the Robustness of Model-Based Algorithms”. IEEE CCTC on DE – 2008.
[23] JJ.Sandiv, B.Mobasher, R.Burke (2007) “Robustness of Collaborative recommendation Based on Association rule Mining”. ResSys’07, pp 105-112, ACM – 2007.
[24] B.Mehta, T.Hofmann, P. Fankhauser (2007) “Lies and Propaganda: Detecting Spam Users in Collaborative Filtering”. IUI’07, pp 14-21, ACM – 2007
[25] B.Van Roy and X.Yan (2010) “manipulation Robustness of Collaborative Filtering”. April – 2010
[26] John O’Donovan, Barry Symth (2005) “Trust in recommendation systems”. IUI’05, ACM 2005 1-58113-894, 2005
[27] Paolo Buono, Maria Francesca Costabile, Stefano Guida, Antonio Piccinno, Giuseppe Tesoro. (2002) “Integrating User Data and Collaborative Filtering in a web Recommendation System”. Proceedings of 18th
International conference on user modeling, vol.2266, pp: 315-321, 2002