Impact of Denoising using Various Filters on QR Code
Deepika Kumawat
M. Tech. (CS)Govt. Engineering College, Ajmer
Ranjeet Kumar Singh
M. Tech. (IT)Govt. Engineering College, Ajmer
Deepak Gupta
Asst. Professor, CS Dept. Govt. Engineering College, AjmerShikha Gupta
Asst. Professor (IT) Govt. Engineering College, AjmerABSTRACT
This paper aims to showcase one of the latest automatic identification technology concepts. In the recent past the concept of Quick Response Code (QR Code) has attained a significant recognition and is being used as data representation mean. 2D Barcode are widely used due to high capacity storage and fast processing step, QR Code is one of such types of 2D barcode. Advertising and education are the top most span where the utility of this application continues to grow. This paper aims on providing detailed information on all the concepts of Quick Response Code. It expresses significance, structure and entire procedure used to represent data in the form of barcode. First experiment is to apply noise in QR Code (encoding) and second is De-noising (decoding) using Median and Wiener filters. This document also provides a glimpse of the impact of Noise on the QR code and Histogram of the PSNR values that shows the comparison of the images.
Keywords
Quick Response Code, Denoising, Filters, PSNR, Histogram, Comparison.
1.
INTRODUCTION
Barcode is a representation for a data related to an object being attached to. It is an optical machine-readable representation o data. Barcode systematically represents data by varying the widths and spacing’s of parallel lines, and they are known as linear or one-dimensional (1D). Apart from linear representation 2D system uses various numbers of symbols; they too are referred as barcodes [2]. Below is the figure that shows a 2D barcode:
Figure 1: A barcode symbol
A barcode is generally formed of black bars and white bars placed in alternative sequence. The widths of these black and white bars usually a fixed width for all characters.
2.
ABOUT QUICK RESPONSE CODE
All material on each page should fit Two-dimensional bar code is called in Japan, QR Code (Quick Response Code, quick response codes.)
2.1 2-D Barcode
Two-dimensional bar code (2D barcode) is the gathered thickness of lines and point of black and white square bar for
the 90’s invention, than black and white one-dimension bar code (barcode) can store more data. Two-dimensional bar code can store more than 1,000 characters, including English, numbers, pictures and other multimedia information. Below is the figure:
Figure 2: 2D bar code
2.2 Quick Response Code
In recent years, with the development of the Internet technology and LSI technology, various bar code symbols have been developed rapidly according to the specific needs. QR Code was provided a standard as the JIS standard (X0510) in 2000 and revised in 2004. Then this code was also standardized internationally as an international standard ISO/IEC 18004 in 2001.
2.2.1 QR Code Configuration
Figure 2.2 is a case that show the QR Code version 1 modules that are arranged in a grid pattern of black and white squares. In this QR code symbol, there are three position detection patterns (finder patterns) in the upper left corner, bottom left and top right corner. Then the timing pattern is placed between every one of these position detecting patterns.
2.3 QR Code Design
[image:1.595.356.499.669.750.2]2.3.1
Storage
The amount of data that is to be stored in QR Code symbol depends on the data type (mode, or input character set), version (1, …, 40, indicating the overall dimensions of the symbol), and error correction level. The maximum storage capacities occur for 40-L symbols (version 40, error correction level).
2.3.2
Encryption
Encryption QR Codes, which are not very common, contains few various implementations. An Android app, for example, manages encryption and decryption of QR codes using the DES algorithm (56 bits). Japanese immigration use encrypted QR Codes when placing visas in passports.
2.3.3
Error correction
Codeword’s are 8 bits long and for error correction use the reed-Solomon error correction algorithm with four error correction levels. The higher error correction level, the lesser storage capacity. The following table shows the approximate error correction capability at each of the four various levels of error detection:
Level L (Low) -7% of code words can be stored.
Level M (Medium) -15% of code words can be stored.
Level Q (Quartile) -25% of code words can be stored.
Level H (High) -30% of code words can be stored [7].
2.3.4
Encoding
The format information of QR code records two things: first the error correction level and second the mask pattern used for the symbol.
3.
NOISE IN QR CODE
When the original form of an image is changed due to unwanted information, the term is called Noise in Image Processing. It generally carries corruptive effects by deteriorating the image quality [1]. There are four types of noise (Gaussian noise, salt & Pepper noise, Speckle noise and Poisson noise).
3.1
Amplifier (Gaussian noise)
Gaussian noise is caused by the discrete nature of radiation and the conversion of the optical signal into an electrical signal. Amplifier noise's standard model is additive, Gaussian as well as independent at each pixel and signal intensity [5].
3.2 Salt Pepper Noise
Salt and pepper noise is caused due to dead pixels that are developed at the time of analog-to-digital signal conversion, bit error in transmission etc. An image containing salt and pepper noise has some dark pixels in the bright regions whereas bright pixels can be found in darker regions[5].
3.3
Speckle Noise
Speckle noise is essentially granular noise. Speckle noise generate due to random fluctuations in the signal that is returns from an object. Coherent processing of a back scattered signals from multiple and distributed targets results in speckle noise.
4.
IMAGE DE-NOISING
Image de-noising is an essential image processing task. It is a process itself as well as a component in other processes. There are many ways to noise an image. A good image de-noising model is that which is capable of completely removing noise as far as possible as well as preserve edges [1].
Types of filter
Mean Filter
Median Filter
Wiener Filter
4.1
Mean Filter
Linear model and each type of filter have specific application. If we consider removing grain noise from a photograph, most appropriate filter is an averaging filter because each pixel needs to be set to the average of the pixels in its neighborhood and reduce local variations caused by grain. This filter is also called as average filter.
4.2
Median Filter
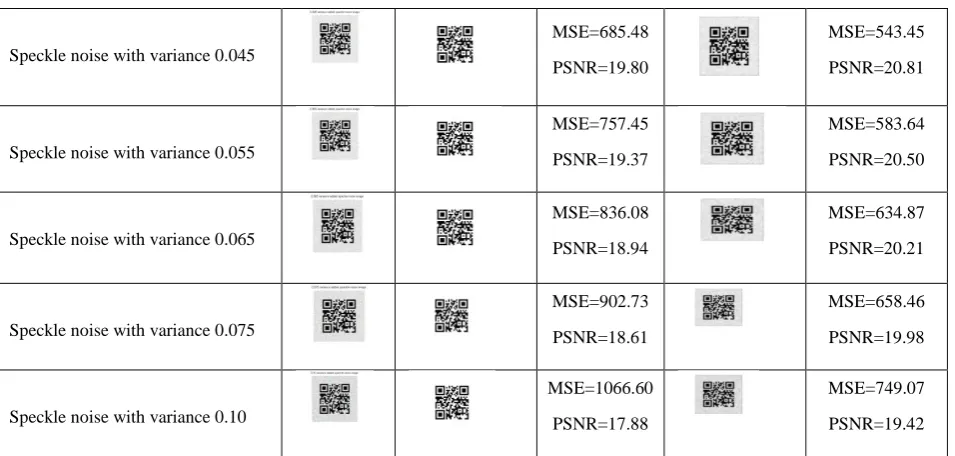
Median filter is known as a nonlinear digital filtering technique for removing noise. Such noise makes correction in pre processing steps so that results of later part of processing can be improvised (for example, edge detection on an image) [1]. A major advantage of the median filter over linear filters is that the median filter is capable of eliminate the effect of input noise values whose magnitude is extremely large. Table 1 shows de-noising using mean filter and median filter at level-L with different variance.
Table 1: De-Noising using mean filter and median filter at Level-L with different variance and MSE and PSNER comparison
L level of QR code with different- different variance of
speckle noise Images
Denoising using median filter MSE and PSNR comparison Denoising using wiener filter MSE and PSNR comparison
Speckle noise with variance 0.015
MSE=447.02
PSNR=21.66
MSE=409.47
PSNR=22.04
Speckle noise with variance 0.035
MSE=608.42
PSNR=20.32
MSE=500.88
Speckle noise with variance 0.045
MSE=685.48
PSNR=19.80
MSE=543.45
PSNR=20.81
Speckle noise with variance 0.055
MSE=757.45
PSNR=19.37
MSE=583.64
PSNR=20.50
Speckle noise with variance 0.065
MSE=836.08
PSNR=18.94
MSE=634.87
PSNR=20.21
Speckle noise with variance 0.075
MSE=902.73
PSNR=18.61
MSE=658.46
PSNR=19.98
Speckle noise with variance 0.10
MSE=1066.60
PSNR=17.88
MSE=749.07
PSNR=19.42
4.3
Wiener Filter
This filter has been developed with a goal to identify and filter out the noise that has corrupted the signal. The Wiener filter approach towards the filtering is from a different angle. The knowledge of the spectral properties of noise and the original
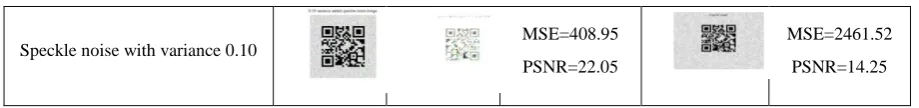
[image:3.595.61.539.68.296.2]signal are provided by the wiener filter. LTI filter can be seeked whose output would come as close to the original single as possible [1]. Table 2 shows de-noising using mean filter and median filter at level-Q with different variance.
Table 2: De-Noising using mean filter and median filter at Level-Q with different variance and MSE and PSNER comparison
Q level of QR code with different-different variance of
speckle noise
Images
Denoising using Median
Filter
MSE and PSNR Comparison
Denoising using Wiener
Filter
MSE and PSNR Comparison
Speckle noise with variance 0.015 MSE=286.51
PSNR=23.59
MSE=1938.00
PSNR=15.29
Speckle noise with variance 0.035 MSE=0.00
PSNR=lnf
MSE=206.71
PSNR=15.02
Speckle noise with variance 0.045
MSE=376.63
PSNR=22.41 MSE=2125.25
PSNR=14.89
Speckle noise with variance 0.055
MSE=385.37
PSNR=22.31
MSE=2187.26
PSNR=14.77
Speckle noise with variance 0.065
MSE=375.62
PSNR=22.42
MSE=2246.78
PSNR=14.65
Speckle noise with variance 0.075 MSE=362.94
PSNR=22.57
MSE=2307.28
Speckle noise with variance 0.10 MSE=408.95 PSNR=22.05
MSE=2461.52
PSNR=14.25
5.
IMAGE HISTOGRAM
Representation of data in the form of bar graph is known as Histogram. In a diagram each bar represents the frequency of individual occurrences of data. A histogram shows basic
[image:4.595.52.512.69.123.2]information about the data set such as central location (mean, median, and mode), width of spread range or standard deviation, and the shape. Table 3 shows histogram image at different level.
Table 3: Histogram image at different levels
Speckle Noise Variance
QR Code with correction level L
QR Code with correction level M
QR Code with correction level Q
QR Code with correction level H
Without Noise
Gaussian Blurred Image
0.015
0.035
0.045
0.055
0.065
0.075
0.10
6.
PSNR Calculation
The PSNR is used to measure the quality of reconstruction of an image codec at the time of image compression. Given a noise-free m×n monochrome image I and its noisy approximation K, MSE is defined as:
MSE=1 , − , −1=0 −1=02
The PSNR is defined as:
PSNR= 10.log10 2
= 20.log10( 2 )
= 20.log10(MAXI)-10.log(MSE) [8].
7.
Conclusions and Result
In this paper we introduce the QR code with its characteristics and structure. The concept of various noises like Gaussian
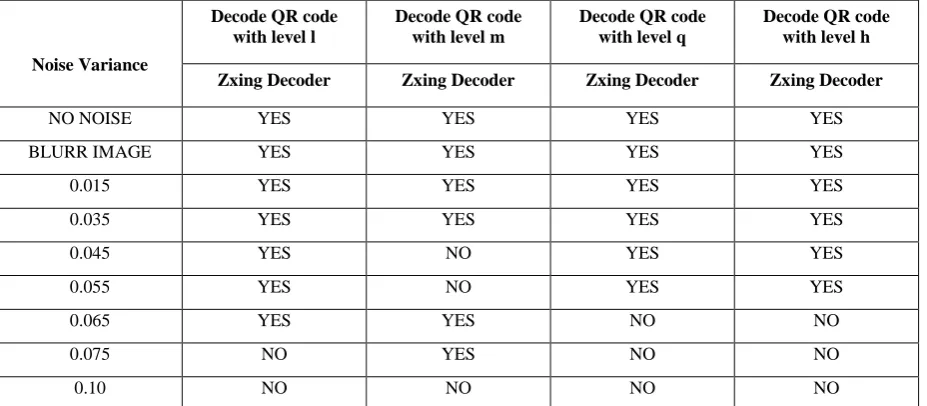
noise, Salt and pepper noises and Speckle noises has been theoretically explained in detail. There is also a demonstration of an experiment of applying Speckle noise on image using mat lab and checking the readability of these noisy images. The experiment is performed for different variance of speckle noise at level L, level M, level Q and level H in mat lab. The table 4 shows the changes on each level when speckle noise variance has different values.
Table 4: Calculate MSE and PSNR values of QR codes with different variance at different levels
Table 5: Decode QR code with zxing decoder
Noise Variance
Decode QR code with level l
Decode QR code with level m
Decode QR code with level q
Decode QR code with level h
Zxing Decoder Zxing Decoder Zxing Decoder Zxing Decoder
NO NOISE YES YES YES YES
BLURR IMAGE YES YES YES YES
0.015 YES YES YES YES
0.035 YES YES YES YES
0.045 YES NO YES YES
0.055 YES NO YES YES
0.065 YES YES NO NO
0.075 NO YES NO NO
0.10 NO NO NO NO
8.
ACKNOWLEDGEMENT
Through this page, I express my heartfelt thanks, to Mr. Deepak Gupta (Asst. Professor), Computer Science Department at Govt. Engineering College, Ajmer, who gave me the opportunity to work on this topic and inspired me to carry forward this work as a challenge.
I also thank to Mrs. Shikha Gupta (Asst. Professor), IT Department at Govt. Engineering College, Ajmer for his support.
I especially thank Mr. Ranjeet Kumar singh.
I am deeply grateful to the faculty members and other staff of CS and IT Department of The Government Engineering College, Ajmer.
I thank all my classmates for their support throughout this work.
9.
REFERENCES
[1] Pawan Patidar, Manoj Gupta, Sumit Srivastava, Ashok Kumar Nagawat ”Image De-noising by Various Filters
for Different Noise” International Journal of Computer Applications (0975 – 8887) Volume 9– No.4, November 2010.
[2] Peter Kieseberg, Manuel Leithner, Martin Mulazzani, Lindsay Munroe, Sebastian Schrittwieser, Mayank Sinha, Edgar Weippl, “QR Code Security”, MoMM Proceedings, 2010.
[3] Toshihiko Wakahara, Noriyasu Yamamoto ’’Image Processing of 2-Dimensional Barcode”, International Conference on Network-Based Information Systems, 2011.
[4] Jiejing Zhou, Yunfei Liu, and Peng Li, “Research on Binarization of QR Code Image”, IEEE 978-1-4244-7874-3/10 , 2010.
QR code with different-different variance of speckle noise
QR Code with correction level L
QR Code with correction level M
QR Code with correction level Q
QR Code with correction level H
MSE PSNR MSE PSNR MSE PSNR MSE PSNR
Speckle noise with variance 0.015 469.29 21.21 494.42 21.22 499.12 21.18 501.68 21.16
Speckle noise with variance 0.035 657.68 19.98 658.61 19.98 661.64 19.96 647.72 20.05
Speckle noise with variance 0.045 734.75 19.50 734.81 19.50 739.63 19.47 714.24 19.63
Speckle noise with variance 0.055 806.67 19.10 813.78 19.06 810.31 19.08 785.41 19.03
Speckle noise with variance 0.065 885.29 18.69 886.94 18.69 889.39 18.67 855.96 18.84
Speckle noise with variance 0.075 957.97 18.38 960.81 18.34 964.44 18.32 913.92 18.56
[image:5.595.55.519.341.544.2][5] Charles Boncelet (2005). “Image Noise Models”, in Alan C. Bovik Handbook of Image and Video Processing.
[6] Toshihiko Wakahara, Noriyasu Yamamoto and Hiroki Ochi ’’Image Processing of Dotted Picture in the QR Code of Cellular Phone”, International Conference on P2P, Parallel, Grid, Cloud and Internet Computing, 978-0-7695-4237-9/10, 2010.
[7] Phaisarn Sutheebanjard and Wichian Premchaiswadi, “QR-Code Generator”, Eighth International Conference on ICT and Knowledge Engineering, 978-1-4244-9875-8/10, 2010.
[8] C.Sasi varnan, A.Jagan, Jaspreet Kaur, Divya Jyoti, Dr.D.S.Rao, “Image Quality Assessment Techniques pn
Spatial Domain”, I S S N : 2 2 2 9 - 4 3 3 3 ( P r i n t ) | I S S N : 0 9 7 6 - 8 4 9 1 (On l i n e ), IJCST Vol. 2, Issue 3, September 2011.
[9] Juan R. Hernández, Martín Amado, and Fernando Pérez-González, “DCT-Domain Watermarking Techniques for Still Images: Detector Performance Analysis and a New Structure”, IEEE TRANSACTIONS ON IMAGE PROCESSING, VOL. 9, NO. 1, JANUARY 2000.