Performance Evaluation of
National Knowledge Network Connectivity
Vipin Saxena, PhD.
Department of Computer Science
B.B. Ambedkar University (A Central University)
Rae Barely Road, Lucknow-25, U.P. (India)
Nimesh Mishra
Department of Computer Science
B.B. Ambedkar University (A Central University)
Rae Barely Road, Lucknow-25, U.P. (India)
ABSTRACT
Due to rapid growth of information sharing on the network, there is a need to setup high speed bandwidth network connectivity and in India it has been setup by Government of India called as a National Knowledge Network (NKN). In this network, higher specifications of devices like routers, bridges, switches, cables, etc are used for setting the network infrastructure. In the current work, a case-study of a Babasaheb Bhimrao Ambedkar University, India is considered to evaluate the performance of National Knowledge Network link which was provided by the Government of India.
General Terms
Performance Evaluation, NKN, et. al.
Keywords
Router, Switch, Bridge, Network Architecture, Performance Evaluation.
1.
INTRODUCTION
Nowadays, people are sharing the long files on the network whether the type of network is Local Area Network (LAN), Metropolitan Area Network (MAN) or Wide Area Network (WAN). If the speed of network is slow, then there is a problem to share very long files available in the forms of audio and video. To share the audio and video files on the network, Government of India has launched a Nationwide Project called as National Knowledge Network which has been setup by National Informatics Centre (NIC), New Delhi in the year 2009[1]. This network is considered to be a very high speed knowledge network supporting multigiga bit data accessing speed. The motive of the Government for setting this type of network infrastructure is mainly to support the quality of research work by knowledge sharing among the people Universities/ Institutions/Research labs, etc and thus it is used to provide different quality oriented services like digital libraries, virtual classrooms, data centers, etc. The core of this network is based upon the distributed approach [2] in which more than one computer are interconnected with each other using different kinds of network. These interconnected computer systems are based on different kinds of topologies which are capable of collaborating on a task in order to perform the execution of the tasks. In the distributed computing system, the systems are capable of sharing the memory and program execution space. The computing performed in the distributed computer system architecture is known as distributed computing system. A lot of work has already been done on distributed computing concept. A Grapevine project [3] has been created by using the distributed computing approach and the multicomputer systems have been setup to establish real applications under the distributed computing system environment. An overview
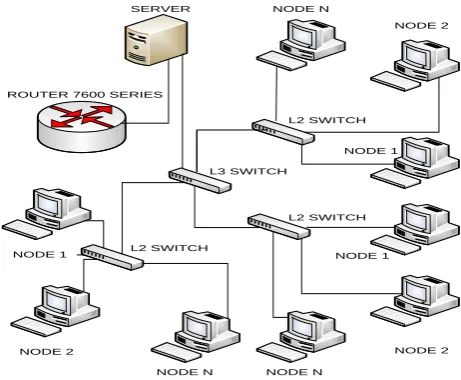
on distributed computing approach is well explained by Tanenbaum & Forouzon [4], [5]. The complete infrastructure details for setting the computer networks are given by these authors. By these networks, each and every organization can share data from one location to another location in a very fast and an authenticated manner. By the use of LAN, MAN or WAN, every organization implements data sharing among them. Computer network connection is formed by using different network creating devices like routers, switches and bridges, etc. When these networking devices [6] are interconnected with each other they form well designed computer network architecture, as shown in figure 1.
SERVER
ROUTER 7600 SERIES
L3 SWITCH
L2 SWITCH
L2 SWITCH L2 SWITCH
NODE 1
NODE 2
NODE N
NODE N
NODE 1 NODE 1
NODE 2
NODE 2 NODE N
[image:1.595.316.547.343.533.2]
Fig 1: Distributed computing networks
2.
NETWORK DEVICES
Different types of networking devices are used to establish the said connectivity which is interconnected in the form of LAN, MAN or WAN network systems. The brief descriptions of the devices used for this purpose are explained below:
2.1
Router
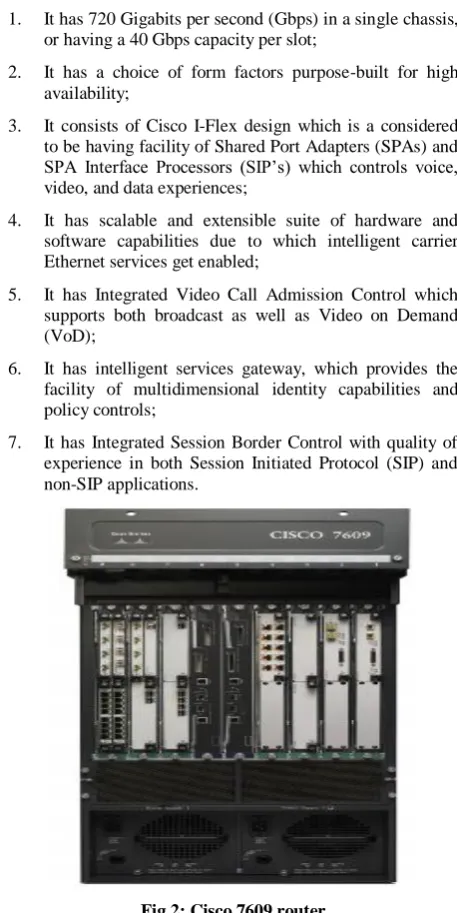
The router used in the recent case study is a CISCO router [11] of series 7600 and model no. is 7609. The CISCO routers are used generally at places where there is need of high performance network traffic. This router consists of Nine-slot chassis as represented in the figure 2. Some of the important features of 7600 series routers are given below:
1. It has 720 Gigabits per second (Gbps) in a single chassis, or having a 40 Gbps capacity per slot;
2. It has a choice of form factors purpose-built for high availability;
3. It consists of Cisco I-Flex design which is a considered to be having facility of Shared Port Adapters (SPAs) and SPA Interface Processors (SIP’s) which controls voice, video, and data experiences;
4. It has scalable and extensible suite of hardware and software capabilities due to which intelligent carrier Ethernet services get enabled;
5. It has Integrated Video Call Admission Control which supports both broadcast as well as Video on Demand (VoD);
6. It has intelligent services gateway, which provides the facility of multidimensional identity capabilities and policy controls;
[image:2.595.319.533.85.146.2]7. It has Integrated Session Border Control with quality of experience in both Session Initiated Protocol (SIP) and non-SIP applications.
Fig 2: Cisco 7609 router
2.2
Switch
Switches are the smart devices used to form a network. Switches [12] used in the current network are based on the layer three architecture and that’s why called as layer 3 switches as represented in figure 3.
Fig 3: A layer 3 (L3) switch
With the help of above switch, the entire campus of Babasaheb Bhimrao Ambedkar University has been divided into about 8 VLAN’s as categorised below with unique Internet Protocol (IP) address:
I. Administrative Block (192.168.1.0/24) II. School for Ambedkar Studies (192.168.50.0/24) III. School for Environmental Studies (192.168.10.0/24) IV. Boys Hostel (192.168.70.0/24)
V. Vice Chancellor Residence (192.168.20.0/24) VI. Teachers Residence (192.168.60.0/24) VII. Rearing House (192.168.40.0/24) VIII. Guest House (192.168.30.0/24)
[image:2.595.50.279.211.668.2]Along with the layer 3 switch implementation, the layer 2 switches are also used in the entire campus of Babasaheb Bhimrao Ambedkar University.
Fig 4: A layer 2 (L2) switch
Figure 4 shows the Layer 2 switch which forwards the traffic based on MAC layer addresses. This layer 2 switch is also considered to be as a multiport transparent bridge.
2.3
Performance Issue
Since the network system is very complex, as it consists of LAN, MAN & WAN, therefore, one of the main issues regarding an interconnected computers network system is its performance. The performance issue simply states about the network traffic handling mechanism so that congestion and contention could be managed. The network traffic performance is related with the time taken by the data packets to travel from source to destination. In the present work authors have studied the interconnected computers network architecture of Babasaheb Bhimrao Ambedkar University according to different aspects and obtained some of the important results of the network traffic performance in terms of corresponding load. The performance and occurrence of load have been studied and described in the next section.
3.
EXPERIMENTAL RESULTS
[image:2.595.319.524.355.435.2]a) ISA server is working at the edge of the network; b) At situations where trihmoed ISA server is been
configured;
c) At situations when the services and applications are going to be run on the ISA server.
Some of the important cases are studied by the authors in order to get the result of network traffic which is described below in brief:
[image:3.595.123.479.195.636.2]3.1
Network Traffic Generated by Users
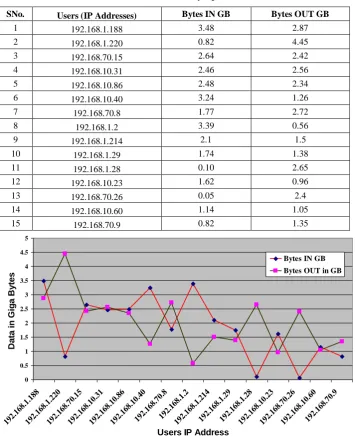
In the said University, users are working from 6 A.M. to 11 P.M. & on the basis of this, Table 1 presents the data related to the network traffic occurred due to uploading and downloading of data in GB by the top fifteen users.Table 1. Data send and received by top 15 users (in GB)
SNo. Users (IP Addresses) Bytes IN GB Bytes OUT GB
1 192.168.1.188 3.48 2.87
2 192.168.1.220 0.82 4.45
3 192.168.70.15 2.64 2.42
4 192.168.10.31 2.46 2.56
5 192.168.10.86 2.48 2.34
6 192.168.10.40 3.24 1.26
7 192.168.70.8 1.77 2.72
8 192.168.1.2 3.39 0.56
9 192.168.1.214 2.1 1.5
10 192.168.1.29 1.74 1.38
11 192.168.1.28 0.10 2.65
12 192.168.10.23 1.62 0.96
13 192.168.70.26 0.05 2.4
14 192.168.10.60 1.14 1.05
15 192.168.70.9 0.82 1.35
0 0.5 1 1.5 2 2.5 3 3.5 4 4.5 5
192.168.1.188192.168.1.220192.168.70.15192.168.10.31192.168.10.86192.168.10.40192.168.70.8192.168.1.2192.168.1.214192.168.1.29192.168.1.28192.168.10.23192.168.70.26192.168.10.60192.168.70.9
Users IP Address
D
a
ta
i
n
G
ig
a
B
y
te
s
Bytes IN GB
[image:3.595.121.477.199.617.2]Bytes OUT in GB
Fig 5: Network traffic generated by top 15 users (in GB)
Figure 5 shows the graphical view of the network traffic due to uploading and downloading of data by the top users. Top users are categorized by their IP addresses. The data recorded through ISA server which shows the uploaded as well as downloaded data in GB. The two lines show the data
3.2
Communication Protocols Used to
Carry Network Traffic
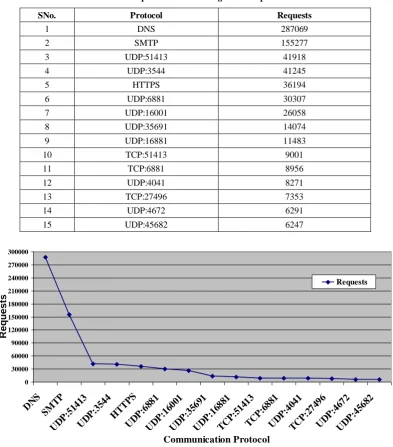
During the traffic flow in the said University, the requests that have been given by the users are carried out by the use of the
[image:4.595.102.496.150.598.2]different protocols. These protocols are as Domain Name System (DNS), Hyper Text Transfer Protocol (HTTP), User Datagram Protocol (UDP) and so on. Data has been recorded in tabular format for the requests with the different protocols in order to study the network traffic.
Table 2. Requests occurred using different protocols
SNo. Protocol Requests
1 DNS 287069
2 SMTP 155277
3 UDP:51413 41918
4 UDP:3544 41245
5 HTTPS 36194
6 UDP:6881 30307
7 UDP:16001 26058
8 UDP:35691 14074
9 UDP:16881 11483
10 TCP:51413 9001
11 TCP:6881 8956
12 UDP:4041 8271
13 TCP:27496 7353
14 UDP:4672 6291
15 UDP:45682 6247
0 30000 60000 90000 120000 150000 180000 210000 240000 270000 300000
DN S
SM TP
UD P:51
413
UD P:35
44 HT
TPS
UD P:68
81
UD P:16
001
UD P:35
691
UD P:16
881
TC P:51
413
TC P:68
81
UD P:40
41
TC P:27
496
UD P:46
72
UD P:45
682
Communication Protocol
R
e
q
u
e
s
ts
Requests
Fig 6: Request generated by different communication protocols
Graphical views of the different protocols used for the requests users sent and received through these different types of communication protocol are depicted in figure 6. It is
3.3
Traffic Generated due to Different
Destination Places
User’s of said Universities use to access different destination places in order to fulfill their requirements. The accessing of
[image:5.595.125.472.157.384.2]different destination places have been studied and data uploaded and downloaded from different destination places have been recorded to get the network traffic of data generated due to destination places for which requests are made.
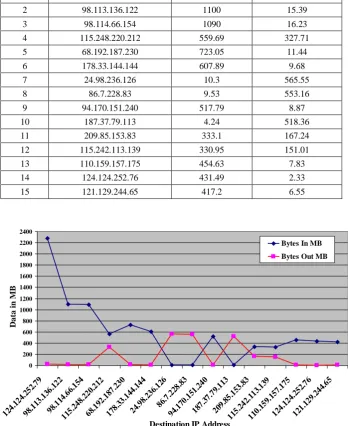
Table 3. Data send and received by accessing 15 destination places
SNo. Destination IP Bytes In MB Bytes Out MB
1 124.124.252.79 2280 23.25
2 98.113.136.122 1100 15.39
3 98.114.66.154 1090 16.23
4 115.248.220.212 559.69 327.71
5 68.192.187.230 723.05 11.44
6 178.33.144.144 607.89 9.68
7 24.98.236.126 10.3 565.55
8 86.7.228.83 9.53 553.16
9 94.170.151.240 517.79 8.87
10 187.37.79.113 4.24 518.36
11 209.85.153.83 333.1 167.24
12 115.242.113.139 330.95 151.01
13 110.159.157.175 454.63 7.83
14 124.124.252.76 431.49 2.33
15 121.129.244.65 417.2 6.55
0 200 400 600 800 1000 1200 1400 1600 1800 2000 2200 2400
124. 124.
252. 79
98.1 13.1
36.1 22
98.1 14.6
6.15 4
115. 248.
220. 212
68.1 92.1
87.2 30
178. 33.1
44.1 44
24.9 8.23
6.12 6
86.7 .228
.83
94.1 70.1
51.2 40
187. 37.7
9.11 3
209. 85.1
53.8 3
115. 242.
113. 139
110. 159.
157. 175
124. 124.
252. 76
121. 129.
244. 65
Destination IP Address
D
a
ta
i
n
M
B
Bytes In MB
[image:5.595.126.475.183.610.2]Bytes Out MB
Fig 7: Network traffic generated by 15 destinations IP (In MB)
Figure 7 shows the network traffic generated due to access of destination places requested by the users in Megabytes (MB). The line graph shows the data upload and download from the
[image:5.595.130.476.405.613.2]3.4
Network Traffic Measured based on
Time
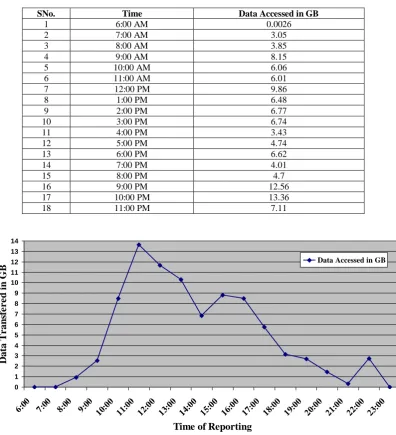
The network traffic generated by the users during the time period of 6 A.M. to 11 P.M. has been studied and the data
[image:6.595.104.501.151.587.2]accessed at different time stamps have been recorded in following table. The accessed data is recorded at different consecutive time periods to study the traffic of the network.
Table 4. Network traffic at different time stamps
SNo. Time Data Accessed in GB
1 6:00 AM 0.0026
2 7:00 AM 3.05
3 8:00 AM 3.85
4 9:00 AM 8.15
5 10:00 AM 6.06
6 11:00 AM 6.01
7 12:00 PM 9.86
8 1:00 PM 6.48
9 2:00 PM 6.77
10 3:00 PM 6.74
11 4:00 PM 3.43
12 5:00 PM 4.74
13 6:00 PM 6.62
14 7:00 PM 4.01
15 8:00 PM 4.7
16 9:00 PM 12.56
17 10:00 PM 13.36
18 11:00 PM 7.11
0 1 2 3 4 5 6 7 8 9 10 11 12 13 14
6:00 7:00 8:00 9:00 10:00 11:00 12:00 13:00 14:00 15:00 16:00 17:00 18:00 19:00 20:00 21:00 22:00 23:00
Time of Reporting
D
ata T
r
an
sfe
r
e
d
i
n
G
B
Data Accessed in GBFig 8: Network traffic generated at different time stamps
Figure 8 shows the network traffic recorded at different times by line graph which shows how much amount of the network traffic was been sent through ISA server throughout the working hours. It is observed that minimum amount of data i.e. 0.0026 GB is accessed at 6 A.M. while maximum amount of data about 13.36 GB is accessed at night i.e. 10 P.M.
4.
CONCLUSION
The present work is based upon the study of a network connectivity which has been established in Central University by Government of India under National Knowledge Network
5.
ACKNOWLEDGEMENTS
The authors are thankful to University Grant Commission for providing the financial assistance to carry out the above study. Thanks are also due to Prof. R. Chidambaram, Principal Scientific Advisor, Office of the Principal Scientific Adviser to the Government of India,318, Vigyan Bhavan Annexe Maulana Azad Road, New Delhi-110011 for selecting the said University for providing NKN connectivity.
6.
REFERENCES
[1] Study material for NKN project. www.nkn.in ( Accessed on 10th Feb 2012)
[2] Liu, M.L. 2009. Distributed Computing Principles and Applications, 4th ed., Pearson Education.
[3] Birrell, A.D., Levin, R., Needham, R.M. & Schroeder,M.D., 1982 Grapevine: Work done towards understanding the distributed computing mechanism, Communications of the ACM, 25(4): 260-274.
[4] Tanenbaum, A.S. 2002 Computer Networks, 4th ed., Prentice Hall Publications.
[5] Forouzon, B.A. 2007 Data Communications and Networking, 4th ed., Tata McGraw-Hill Publications. [6] Network devices and their properties
http://www.networktutorials.info/tutorials/logicaldesign. html (Accessed on 15th March 2012)
[7] Forouzan, B.A. 2004 TCP/IP Protocol Suite, 2nd ed, Tata McGraw-Hill Publication.
[8] ilberschatz, A. & Galvin, A. 2000 Textbook for Understanding the Operating System Concepts, 5th ed, John Wiley & Sons, Inc.
[9] Saxena, V. & Mishra, N., Distributed approach of a National Knowledge Network, In proceedings of conference held at Amity University Uttar Pradesh organized by Amity Institute of Information Technology and Computer Society of India Lucknow Chapter on 21st Oct 2010.
[10] Saxena, V. & Mishra, N. 2011 High speed National Knowledge Network for Higher Education, Research Analysis and Evaluation, Vol II, Issue-19, pp. 175-176. [11] Cisco contents for networking devices
http://www.cisco.com/en/US/products/hw/routers/ps368/ index.html (Accessed on 15th March 2011)
[12] Switches working at different layers http://www.dlink.co.in/products/category/?cid=15#sub_1 23 (Accessed on 20th April 2012)