Hybrid Correlation based Gene Selection for Accurate
Cancer Classification of Gene Expression Data
Vibhav Prakash Singh
Department of Information Technology
Anand Engineering College Agra, Uttar Pradesh, India
Singh Gaurav Arvind
Department of Computer Science
Anand Engineering College Agra, Uttar Pradesh, India
Arindam G Mahapatra
Department of Information Technology
Anand Engineering College Agra, Uttar Pradesh, India
ABSTRACT
Microarray data has been widely applied to cancer classification, where the purpose is to classify and predict the category of a sample by its gene expression profile. DNA microarray is a gene chip which consists of expression levels for a huge number of genes on a relatively small number of samples. However, only a small number of genes contribute in accurate classification of cancer. Therefore, the challenging task is to identify a small subset of informative genes which has maximum amount of information about the class. Moreover, it also minimizes the classification errors. In this paper, we propose a hybrid negative correlated method, which combines the features from various correlation based feature selection techniques, for the generation of mutually exclusive informative feature sets. We test the effectiveness of the proposed approach using a neural network based classifier on two benchmark gene expression data sets - colon dataset and leukemia dataset. The obtained results are encouraging as hybrid negative correlated method based features give better recognition accuracy than positive correlated and other negative correlated features.
Keywords
DNA Microarray, Classification, Correlation, Neural Network, Backpropagation Algorithm.
1.
INTRODUCTION
Presently, analysis of gene expression data is one of the major topics in health informatics for the diagnosis of cancer and other diseases, which are usually activated through changes in the expression values of certain genes. In the past, scientists were able to conduct these genetic analyses only on few genes at a time. But, now, with the development of DNA microarray technology, it has become possible to monitor, analyze and compare the expression profiles of thousands of genes simultaneously [1, 14, 20]. This Microarray data has been widely applied to cancer classification, where the purpose is to classify and predict the category of a sample by its gene expression profile. But due to a large number of genes (features) and a small sample size, gene expression microarray data faces a vital challenge for accurate classification of diseases [1, 2, 5, 6, 14]. So for the problem of cancer classification, it is required to identify the significant genes that are a good subset of original features, where a good subset is subset of features on which the accuracy of a given classifier is maximal. For evaluating the goodness of a subset of features, the feature selection methods fall into two broad categories: the filter approach and the wrapper approach [21]. In the filter approach, a good feature set is selected as a result of pre-processing based on properties of the data itself and independent of the classification algorithm. The wrapper approach requires one predetermined mining algorithm in
feature selection and uses its performance to evaluate and determine which features are selected. A specific classification model is used for the evaluation of subset of features. Wrapper methods are very computationally intensive and have higher risk of overfitting [21]. For this reason the filter model is widely used in gene selection for microarray data. However, due to the curse of dimensionality problem of microarray data, filter approaches also faces vital challenges, for selecting the most informative genes.
DNA microarrays are created by robotic machines that arrange thousands of gene sequences on a single microscope slide. Actually in our body the entire cell contains identical genetic material, but the same genes are not active in every cell [6, 20]. The active and inactive genes in different cells help scientists to understand normal and abnormal functioning of the genes. When a gene is activated, cellular machinery begins to copy certain segments of that gene [20]. The resulting product is known as messenger RNA (mRNA), which is used for creating proteins. The mRNA produced by the cell is complementary; therefore, it binds itself to the original portion of the DNA strand from where it was copied. To determine which genes are turned on and which are turned off in a given cell, it is required to collect the mRNA molecules present in that cell, then label each mRNA molecule by using a reverse transcriptase enzyme (RT) which generates a complementary cDNA to the mRNA [7, 20]. During that process fluorescent nucleotides are attached to the cDNA. The tumor and the normal samples are labeled with different fluorescent dyes. The two fluorescent dyes which are mixed are red-fluorescent dye Cy5 and green-fluorescent dye Cy3. After the hybridization of the sample an image scanner is used to measure fluorescence intensity of each dye [14, 16, 17, 20]. A red spot indicates that the specific gene is more expressed in tumor, a green spot indicates that the specific gene is more expressed in the normal tissue and a yellow spot means that the specific gene is equally expressed in normal and tumor [7]. The log ratio between the two intensities of each dye is used as the gene expression data [6, 7, 12, 16].
𝐺𝑒𝑛𝑒 𝐸𝑥𝑝𝑟𝑒𝑠𝑠𝑖𝑜𝑛 = 𝑙𝑜𝑔2𝐼𝑛𝑡 (𝑐𝑦 5)𝐼𝑛𝑡 (𝑐𝑦 3) (1)
RT Labeling
Red Florescent Green Florescent Dye Dye
Cy5
Cy3 Image Scanner
log2
𝐼𝑛𝑡 𝐶𝑦5 𝐼𝑛𝑡 𝐶𝑦3
Gene1 Gene2……. … GeneN
S1 S2 . . . . . Sm
Fig 1:
Process of forming DNA Microarray and acquiring gene expression data2.
RELATED WORK
Feature selection is an important pre-processing step in the data mining process; it reduces the dimensions (features) of the data set by selecting a subset of relevant features and ignoring the irrelevant, weakly relevant features. The classification of gene expression data requires two steps (i) feature selection and (ii) classification. Informative gene selection and accurate classification of cancer from gene expression data is an active research area. There are many different kinds of feature selection and classification methods are available, but the most important problem is their proper selection because the classification accuracy is highly sensitive to the choice [10].
Golub’s et al.[6] used neighbourhood cluster analysis and weighted voting to classify acute leukaemia sample .They used 50 genes, which are most closely correlated with the AML-ALL distinction in the known (training) samples to compute the prediction strength. The classifier made strong predictions for 29 of 34 test samples, but the classifier learnt from strongly positive correlated features so it gives limited performance.
Furey et al. [11] used support vector machine (SVM) to classify the tissue samples with signal-to-noise ratio (SNR) for the feature selection method, resulting in the correct classification of 75.6% (8.3 misclassifications over the test data of leukaemia).
A very widespread technique is Principal Component Analysis (PCA) Bicciato et al [18] which transforms data to reduce dimensions and, at the same time, attempts to preserve information on the data variability . In another technique
Nguyen et al. [12] use the Partial Least Squares (PLS) algorithm, that transforms initial variables by maximizing cross covariance with the target vector and was demonstrated to be superior to the PCA approach, in this approach they use principal component analysis and partial least square to extract features and linear discriminant and quadratic discriminant analysis to classify the leukaemia cancer samples, obtaining 82.4% to 97.1% of recognition accuracy. All these methods use a complex weighted average of all genes in the initial datasets.
Li et al. [13] used Genetic Algorithm and KNN for gene selection and cancer classification, Yeh et al. [2] uses t-GA for selecting a group of relevant genes and it give 89.24% accuracy for colon data set and 94.34 % accuracy for leukemia data set. But these approaches are computational intensive and classifier dependent and there are also risks of overfitting.
Patra et al. [1] have used Unsupervised learning based different map size SOM classifier and negative correlated based features between the all classes ideal feature vector of leukaemia and lymphoma gene expression data. They also use many statistical techniques for finding the features .But they use different features comes from different statistical techniques independently.
Fang et al. [5] presented an integrative feature selection method that is able to incorporate gene expression data with additional biological data for finding informative genes. The proposed approach is a two-stage method that combined the strength of both filter method and association analysis and little bit complex. This approach gives 93.5% recognition for colon data set.
Sung Bae Cho et al.[8,10] have published many papers by using different feature selection techniques for finding most informative genes, they generally use ensemble classifier for classification. They have also used the features from the combination of various feature selection techniques but only with a single ideal feature vector and insure that gene expression data set has relatively disjoint feature spaces. Y. Liu et al.[4], and Sung Bae Cho et al.[8,10,15] are also state that negative correlated feature sets are very informative because classifiers with these features are trained in less dependent feature spaces, and if classifiers are trained with high mutually dependent feature spaces (positive correlated), it is hard to expect the performance improvement.
3.
PROPOSED WORK
This paper work is based on filter method because filter approaches are easily scalable to very high-dimensional datasets and accurate, they are computationally simple, and classifier independent .The Proposed work is divided in 4 sections, start with pre-filtering, then define ideal feature vectors for selecting correlated features, then after we find the hybrid negative correlated features and lastly check the recognition accuracy of features on a classifier.
3.1
Normalization and Pre-filtering
First we extract gene expression data set and normalize it in the range of [0, 1] using min-max normalization.
ei=(ei-min(ei)) /Max(ei)-Min(ei) where i=1 to N.
Then apply variance based filter technique to filter out the features which have nearly same values for all samples. Cancer
Cell
Normal Cell
c
mRNA mRNAcDNA
cDNA
Hybridize (Microarray)
3.2
Ideal feature Vectors
In M x N training microarray dataset, where M is the number of samples and N is the number of genes, any geneth vector
can be expressed in column matrix as
gi=(e1,i e2,i e3,i . . . eJ ,i .. . . eM,i ) ,where i=1 to N
Ideal feature vector are depend upon the class of the sample. If in M samples J samples belongs to class “1” and others on class “o” then ideal feature vector can be defined as.
IFVc1 =1 1 1 1 1 1 1 1 1... 1jth 0 0 0 0 0 0 0...M
IFVc2=0 0 0 0 0 0 0 0 0.. 0jth 1 1 1 1 1 1 1...M
Where IFVc1 and IFVc2 are ideal feature vectors for class c1
and c2.
3.3
Hybrid Negative Correlated Feature
Selection
For finding hybrid negative correlated features, we choose all features (genes) which are high correlated with IFVc1 from three feature selection techniques then same process is repeated for IFVc2.After finding the correlation arrange all the informative features in decreasing order with respect to their correlated values. For PC and CC arrange all features from high values to low values and for ED low values to high values .If we combined all high ranked features from all independent feature selection techniques with respect to both ideal feature vectors then we get negative correlated informative feature (NC) sets, many work has already being done on this negative correlated features [1, 4, 15].
[image:3.595.312.569.78.555.2]Now we have picked 25 high ranked features for each set (IF1 to IF6) after arranging the features in decreasing order of their correlated values. For finding hybrid negative informative features set (HNIF1), we combined Pearson coefficient and Euclidean distance based features by uniting subsets IF1 and IF3 such that, first we take common features then equally remaining high ranked features from both, same process is repeated with IF2 and IF4 and combined with IF1 and IF3 outcome. We have considered maximum gap of 10 features for selecting common informative genes.
Table 1. Feature Selection Technique
ED gi, gideal = ( gi− gideal)2
PC gi, gideal = gi gideal −
gi gideal N (gi2−( gi)
𝑁 2
) ( (gideal2−( gideal) 𝑁
2 )
CC gi, gideal = gi gideal gi2 gideal2
[image:3.595.53.297.524.649.2]Same way for other hybrid negative informative features set (HNIF2) ,we combined Pearson coefficient and Cosine coefficient based features by uniting IF3 and IF5 subsets such that first we take common features then equally remaining high ranked features from both, same process is repeated with IF4 and IF6 and combined with IF3 and IF5 outcome.
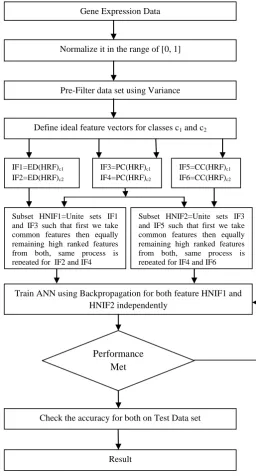
Fig 2: Hybrid negative informative feature selection and cancer classification
3.4
Classification
For classification a Feed-forward Neural Network based on Backpropagation algorithm is used. Backpropagation learns by iteratively processing a data set of most informative features, comparing the network’s prediction for each tuple with actual known target value. In training phase, the weights are modified so as to minimize the MSE between the network prediction and the actual target values, and the learning of NN stops when MSE became negligible or close to zero [3]. Sets HNIF1 and HNIF2 independently used for the training of neural network and the accuracy of corresponding test data set is tested. One of the problems that occur during neural network training is called overfitting, in which the error on the training set is driven to a very small value, but when new data is presented to the network the error becomes large. It means the network has memorized the training examples, but it has
Gene Expression Data
Normalize it in the range of [0, 1]
Pre-Filter data set using Variance
Define ideal feature vectors for classes c1 and c2
Train ANN using Backpropagation for both feature HNIF1 and HNIF2 independently
Performance Met
Check the accuracy for both on Test Data set
Result Subset HNIF1=Unite sets IF1 and IF3 such that first we take common features then equally remaining high ranked features from both, same process is repeated for IF2 and IF4
Subset HNIF2=Unite sets IF3 and IF5 such that first we take common features then equally remaining high ranked features from both, same process is repeated for IF4 and IF6 IF1=ED(HRF)c1
IF2=ED(HRF)c2
IF3=PC(HRF)c1 IF4=PC(HRF)c2
not learned to generalize to new situations. For solving the problem of ovefitting, 20% samples from all the samples, are used to validate how well the network generalized. Neural network learning on the training set continues as long the learning reduces the network's error on the validation vectors.
3.5
Experimental Data Set
Here we take Leukemia data set which is preprocessed by the min-max normalization then variance based pre-filter techniques are applied to reduce the dimensions of data set up to some level. The Leukemia dataset belongs to two types of Leukemia cancers first one is Acute Myeloid Leukemia (AML) and other one is Acute Lymphoblastic Leukemia (ALL). It consists of 72 samples of 7129 gene expressions each. The training data has 38 samples in which 27 samples belong to ALL cancer class and 11 samples belong to AML cancer class. The test data has 34 samples in which 20 samples of ALL class and 14 samples of AML class [6]. The Colon dataset consist of 62 samples of Colon epithelial cells taken from Colon cancer patients. Each sample was taken from tumors and normal healthy parts of the Colons and contained 2000 gene expression levels. A total of 40 of 62 samples were from Colon cancer samples and the 22 samples were from normal samples. A total of 31 out of 62 samples were used as training data and the remaining samples were used as test data set [19].
4.
RESULT ANALYSIS AND
DISCUSSIONS
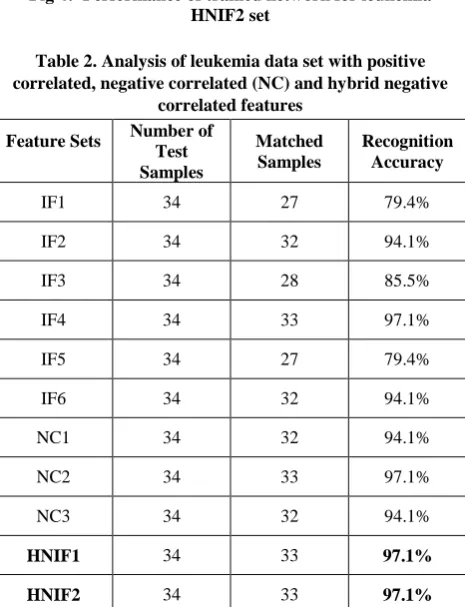
[image:4.595.326.534.73.256.2]For leukemia data set, we find set HNIF1with 26 features (IF1∩IF2=1, IF3∩IF4=1, and 6 remaining high rank features from each) and HNIF2 with 26 features (IF3∩IF5=5, IF4∩IF6=5 and 4 remaining high rank features from each). The numbers of genes selected can vary, there are no clear reports on the optimal number of gene selected, but usually 25 to30 features are appropriate [9]. When we trained the neural network with these feature sets, then we got overall training performance 98.8% and 99.3% respectively as shown in fig.3&4. After the learning of neural network with training data sets, we test the accuracy on corresponding test data sets. From table.2 it’s clear that hybrid negative correlated features have better accuracy then positive (IF1 to IF6) and other negative correlated feature sets (NC1 to NC3), it gives 97.1% accuracy for both combination.
Fig 3: Performance of trained network for leukemia
HNIF1 set
[image:4.595.313.546.248.552.2]Fig 4: Performance of trained network for leukemia HNIF2 set
Table 2. Analysis of leukemia data set with positive correlated, negative correlated (NC) and hybrid negative
correlated features Feature Sets Number of
Test Samples
Matched Samples
Recognition Accuracy
IF1 34 27 79.4%
IF2 34 32 94.1%
IF3 34 28 85.5%
IF4 34 33 97.1%
IF5 34 27 79.4%
IF6 34 32 94.1%
NC1 34 32 94.1%
NC2 34 33 97.1%
NC3 34 32 94.1%
HNIF1 34 33 97.1% HNIF2 34 33 97.1%
[image:4.595.59.277.559.732.2]Fig 5: Performance of trained network for colon HNIF1 set
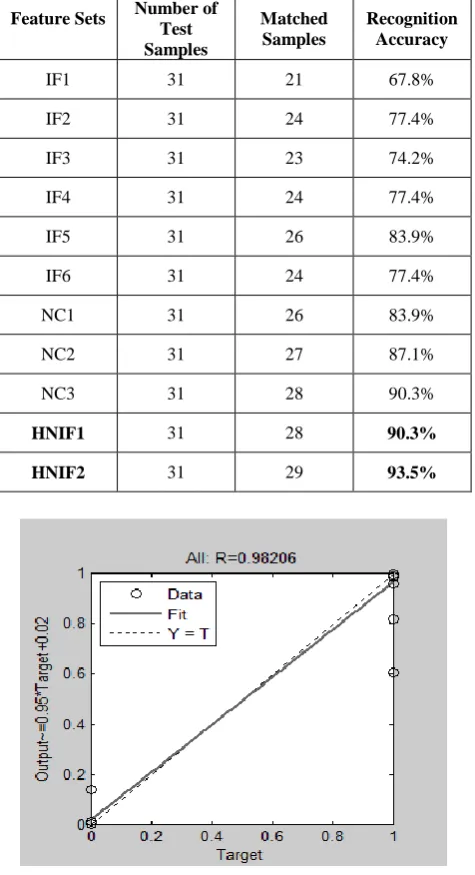
Table 3. Analysis with positive correlated, negative correlated (NC) and hybrid negative correlated features Feature Sets Number of
Test Samples
Matched Samples
Recognition Accuracy
IF1 31 21 67.8%
IF2 31 24 77.4%
IF3 31 23 74.2%
IF4 31 24 77.4%
IF5 31 26 83.9%
IF6 31 24 77.4%
NC1 31 26 83.9%
NC2 31 27 87.1%
NC3 31 28 90.3%
[image:5.595.49.287.309.747.2]HNIF1 31 28 90.3% HNIF2 31 29 93.5%
Fig 6: Performance of trained network for colon HNIF2 set
5.
CONCLUSION
In order to classify cancer class of patients by small subset of informative genes which kept the maximum amount of information about class and minimize the classification errors, we have illustrated a classification framework that combines a pair of hybrid negative correlated features from the combination of 3 feature selection methods. As a result, the obtained informative gene subsets have good classification accuracy and also take less computational time as concern of classifier. But one of the limitations of this approach is, it does not take into account the correlation between genes, which reduces the usefulness of the selected genes for cancer classification. Therefore if similar genes are grouped together as in different clusters, after that the Euclidean distance, Pearson Correlation Coefficient and Cosine Coefficient based feature selection techniques are applied to rank the genes in the clusters and the top ranked gene from each cluster are taken so that we can get relevant genes from the dataset to train the classifier.
6.
REFERENCES
[1] J. C. Patra, G.P. Lim, P.K. Meher and E.L. Ang. 2007 DNA Microarray Data Analysis: Effective Feature Selection for Accurate Cancer Classification. In Proceedings of International Joint Conference on Neural Networks, pp.260-265, August 12-17.
[2] J. Yeh, T. Wu, M. Wu, D. Chang. 2008. Applying Data Mining Techniques for Cancer Classification from Gene Expression Data. International Conference on Convergence Information Technology, 39, pp.583–602, August 6.
[3] J. Han and M. Kamber. 2001. Data Mining: Concepts and Techniques, Morgan Kaufmann Publishers.
[4] Y. Liu and X. Yao. 1999. Ensemble learning via negative correlation. Neural Networks, 2, pp. 1399–1404, Dec. [5] O.H. Fang, N. Mustapha, Sulaiman. 2010. Integrating
Biological Information for Feature Selection in Microarray Data Classification. International Conference on Computer Engineering & Application, pp.330-334, March 19-21.
[6] T.R. Golub et al. 1999. Molecular classification of cancer: class discovery and class prediction by gene expression monitoring. Science 286, pp. 531-537. [7] Bazma, A. and J. Vilo. 2000. Gene expression data
analysis. Federation of European Biochemical Societies (FEBS) Letters, 480, pp. 17-24.
[8] K.-J. Kim, S.-B. Cho. 2006. Ensemble classifiers based on correlation analysis for DNA microarray classification. Neurocomputing, 70, pp. 187-199, December.
[9] W. Li and Y. Yang. 2002. How many genes are needed for a discriminant microarray data analysis. In Methods of Microarray Data Analysis, Editors: S.M. Lin and K. F. Johnson, Kluwer Academic, pp.137-150.
[10]S.-B. Cho, J. Ryu. 2002. Classifying gene expression data of cancer using classifier ensemble with mutually exclusive features. Proceeding IEEE, 90 (11), 1744– 1753.
samples using microarray expression data. Bioinformatics, 16(10), pp. 906–914.
[12]D.V. Nguyen and D.M. Rocke. 2002. Tumor classification by partial least squares using microarray gene expression data. Bioinformatics.
[13]L. Li, C.R. Weinberg, T.A. Darden, L.G. Pedersen. 2001. Gene selection for sample classification based on gene expression data: study of sensitivity to choice of parameters of the GA/KNN method. Bioinformatics, 17 (12), 1131–1142.
[14]C.A. Harrington, C. Rosenow, J. Retief. 2000. Monitoring gene expression using DNA microarrays. Curr. Opin. Microbiology, 3(3), pp. 285-291.
[15]S.-B. Cho, H.-H. Won. 2007. Cancer classification using ensemble of neural networks with multiple significant gene subsets. Applied Intelligence 26 (2007), 243–250.
[16]J. Derisi, V. Iyer, P. Brosn. 1997. Exploring the metabolic and genetic control of gene expression on a genomic scale. Science 278 (1997), 680–686.
[17]M.B. Eisen, P.T. Spellman, P.O. Brown, D. Bostein. 1998. Cluster analysis and display of genome-wide expression patterns. Proc. Natl. Acad. Sci. USA, 14863– 14868.
[18]Bicciato, S., Luchini, A. and D. Bello, C. 2003. PCA disjoint models for multiclass cancer analysis using gene expression data. Bioinformatics, 19, 571–578.
[19]http://microarray.princeton.edu/oncology/affydata [20]http://www.genome.gov