Implementation of Job Scheduling Algorithms in a Cloud
Computing Environment for B2C Electronic Commerce
architecture using GI/G/1 queuing model
Riktesh Srivastava
Assistant Professor, Information SystemsSkyline University College
University City of Sharjah
SHARJAH-UAE
ABSTRACT
Traditional B2C Electronic Commerce architecture instigated using n-Tier Client/Server architecture has continually been sluggish, intricate, and costly. With the advent of Cloud computing environment, the amenities vital for the Electronic Commerce architecture are accomplished by proficient organization, which comprises servers, storage supervision, network skills, and virtualization technologies. The research recommends the Job Scheduling algorithm and its enactment on B2C Electronic Commerce architecture. The algorithm is implemented using GI/G/1 Queuing model, to assess the performance of the proposed algorithm using four queuing parameters, specifically, Average numbers of requests in an B2C E-Commerce architecture, Average numbers of requests in the queue, Average waiting time of requests in an B2C E-Commerce architecture, Average waiting time of requests in queue. Finally, the allied simulations and numeral results are provided, to relate the performance of the proposed algorithm.
General Terms
Electronic Commerce, Distributed Computing, Algorithms.
Keywords
Cloud computing, GI/G/1 Queuing theory, Job scheduling algorithm.
1.
INTRODUCTION
Advent of Internet has changed the mode conventional businesses were conducted. Nevertheless, with the augmentation of Internet, the magnitude of users has also amplified significantly. E-Marketer forecasts that B2C e-commerce sales in Asia pacific region has grown by 23.3% annually and reached $168.7 billion by 2011 [1]. According to [2], there is escalation of 444.8% usage of Internet users in 2010-2011 itself. An E-Business model, predominantly, B2C E-Commerce, lessens communication costs by escalating consumer admittance to information and permitting consumers to trace the most doable value for the product. B2C e-commerce also ease market entry barriers as the price of developing and maintaining a Web site is much cheaper than the traditional business structure. However, it augments the network traffic on e-Business model, ensuing in trouncing of requests send by the consumers and impasse of the queue at any stage of the complete architecture. Many organizations suffered losses due to slow performance of Internet servers and were looking for the solution to manage the increased traffic. The solutions to these problems were found in Cloud Computing. Cloud Computing is a computing paradigm, where large pools of systems are connected in private or public networks, to provide dynamically scalable infrastructure for application, data and file storage. With the introduction of this technology, the cost of computation,
application hosting, content storage and delivery is reduced significantly [3].
In this research, a job scheduling algorithm is proposed which aspires to significantly minimize the Service time of the user’s requests, thereby improving the overall efficiency of the e-Business architecture being implemented using Cloud computing environment. The algorithm is based on GI/G/1 queuing model, where GI symbolizes general independent arrivals and G represents general (any distribution) service. In the research, the software code is developed using Java 2.0 which primary tests the implementation of the projected architecture on the conventional Client Server environment. The same architecture is then experienced on Cloud Computing scenario and the comparative study depicts that the Service time of the requests in the later is much faster, effective and efficient.
The rest of the paper is divided as follows: Section 1 elaborates the traditional 3-tier architecture e-Business model and its implementation in Client Server environment along with the in the mathematical assumptions for the same. Section 2 elaborates diverse distribution techniques which are used in the projected Job scheduling algorithm. The section also mentions the algorithms of 5 different distributions that form General distribution. Section 3 depicts the step by step execution of the Job scheduling algorithm using flowcharts of formation of arrival instances, formation of departure instances and service time evaluation respectively. Section 4 reveals the results and analysis of the algorithm with the comparative study between M/M/1 and GI/G/1 queuing models. Section 5 proposes the B2C Electronic Commerce architecture in a Cloud Computing environment. The section also mentions the step by step procedure of the proposed architecture. Section 6 executes the Job Scheduling algorithm in the proposed architecture and evaluates the results using Regression technique, thereby, formulating the mathematical equation of the Service time. Section 7 does the performance analysis of the proposed algorithm in both the Electronic Commerce environment and mentions the findings. Section 8 concludes the paper.
2
B2C
ELECTRONIC
COMMERCE
The early e-Business architecture was based on 2-tier configuration, as specified in Figure 1.
Fig 1: 2-Tier e-Business architecture
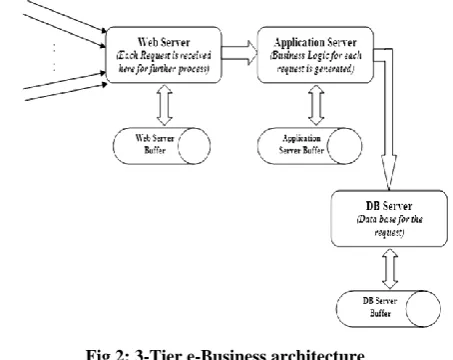
[image:2.595.54.281.343.523.2]The model mentioned in Figure 1, was well recognized and adopted in business, being more competent by distributing processing among client and server. In the said model, the Client sends request to the server, which gets processed and response is send back to the Client. The quandary arises, when the number of clients’ increases, the request has to indefinitely wait in the Server Buffer. To remove this problem, 3-Tier e-Business architecture was proposed as indicated in Figure 2. It must be noted that in 3-Tier EC architecture, the number of Application Server can be more than 2 (up to n, depends on the complexity of the system).
Fig 2: 3-Tier e-Business architecture
For simplicity, a hypothesis that entire development is abridged to a single arrival process and the response is engendered consequently at apiece tier of the e-Business architecture. In the study, all the request and response generated are random; the assessment of throughput is a foremost challenge as:
1. No data ought to be overflowed/freezed out. 2. The entire architecture must guarantee for its
unwavering function.
These two problems are of foremost substance of the planned study. If we scrutinize Figure 2, the e-Business architecture bear a resemblance to Queuing theory, it is therefore premeditated to lug out the study by employing Queuing Theory.
1.1 Mathematical Assumptions for 3-Tier
e-Business architecture
It is assumed that the number of requests that disembark at the web server are
R R
1,
2,...,
R
n
. These requests are random in nature and are being denoted by
. Based onthese assumptions, the total number of requests can be mathematically embodied as:
R
1R
2...
R
n
T
(1)These requests are processed at each of the mentioned servers (web server, application server and database server) and is being denoted by
.
Rp
1Rp
2...
Rp
n
T
(2)Based on equations (1) and (2), there are three possible conditions, on which the 3-Tier e-Business architecture can be based.
Condition 1: When
, this case is often referred as Transient State. If
, then, there will be overflow of data of each servers. This makes the system unstable. Hence, under no circumstances
should be greater than
. Condition 2: When
, this case is called as Null state. This is a very typical case and randomly occurs. This state is typical used for academic studies only, and, practically, this neither occurs nor is desirable.Condition 3: When
, this case is termed as Ergodic State. If this situation is maintained then there will be finite queue length of data, which will be needed to be stored at stated server.The anticipated Job Scheduling Algorithm is based on Condition 3 and uses the GI/G/1 queuing model stipulations, for investigation.
2.
MATHEMATICAL ANALYSIS FOR
THE PROPOSED JOB SCHEDULING
ALGORITHM-ALGORITHMS
OF
VARIOUS DISTRIBUTIONS
The biggest challenge in designing the job scheduling algorithm is that the requests at the system arrives and departs in a random manner. So, the prevalent confront in that under this status also, the system should toil in Ergodic comportment for constancy of the architecture. It must also be eminent that the requests which disembark at the web server and the responses which are generated either from the application server or database server through application server do not pursue any distribution. Thus, the name “General Distribution” is being specified to the arrival of requests and departure of responses from the system and is being denoted by “GI” and “G” correspondingly.
For simplicity, General distribution is amalgamation of five dissimilar types of distribution, specifically:
1. Equiprobable distribution 2. Gaussian distribution 3. Geometric distribution 4. Bernoulli distribution 5. Exponential distribution
The comprehensive experimentation is being conducted for 15000 requests at a given unit of time. It is also being considered that the 3000 requests are owed to each of the above-mentioned distribution concurrently and the responses are generated consequently.
2.1
Algorithm for Gaussian distribution
Algorithm for Gaussian distribution is given below: begin
read n
for i=1 to n in step of one do for j=1 to n in step of one do sum=0
P(j)=RAND U(j) sum=sum+P(j) y(i) = 1/12*sum Write(y(i)) end for end for
end
2.2
Algorithm
for
Equiprobable
distribution
The Algorithm to generate equiprobable distribution is given underneath:
begin
for i=1 to 3000 in step of one do RAND [Ui]
Write[Ui] end for end
The algorithm generates 3000 equiprobable numbers
and is stored in an array.
2.3
Algorithm for Negative-Exponential
distribution
The algorithm to generate 3000 negative exponential distributions using equiprobable distribution is given as under:
begin read b
for i=1 to 3000 in step of one do x(i) = RAND U(i)
y(i) = -1/b log(1-x(i)) Write(y(i))
end for
end
2.4
Algorithm for modified Geometric
distribution
The Algorithm of modified Geometric distribution is given as under:
begin read λ,n b=1/λ a=1-b delta=b/a
for i=1 to n in step of one do x(i)=RAND U[i]
y(i)=(1-exp(delta*x(i))/b Write(y(i))
end for end
2.5
Algorithm for Bernoulli distribution
The Algorithm of Bernoulli Distribution is as follows: begin
read λ,n b=1/ λ a=1-b
for i=1 to n in step of one do x(i)=RAND U(i)
y(i)=(-a+SQRT(a*a+2*b*x(i))/b Write(y(i))
end for end
3
FLOWCHARTS
FOR
GENERAL
DISTRIBUTIONS OF GI/G/1 QUEUING
MODEL
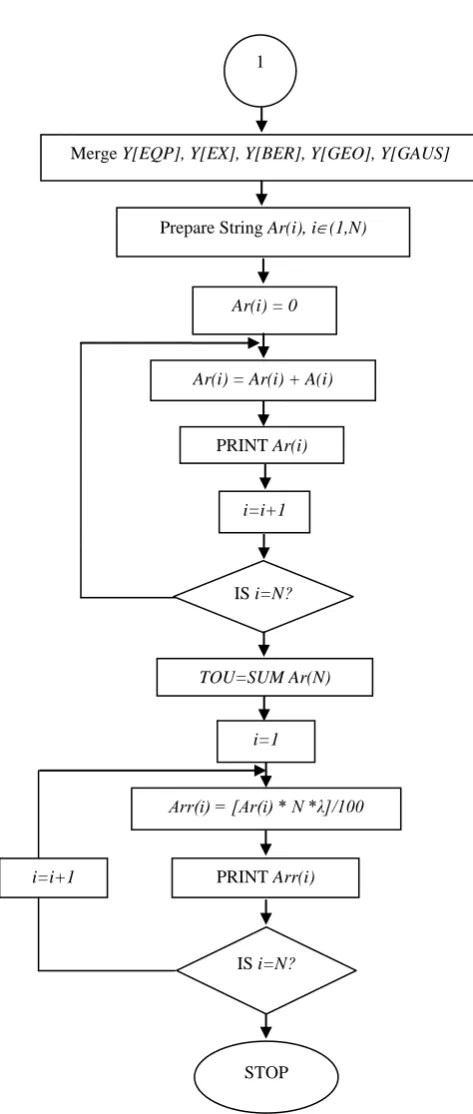
There are three flowcharts that are to be used for comprehensive investigative study of the e-Business architecture in a Cloud computing milieu. First algorithm portrays the arrival process in the scheme. Since, General distribution does not follow any distributions, permutation of five different types of distributions are to be used in the study. Each distribution is allocated 3000 requests depending upon the availability of the request channel. These requests are merged by Web Server through Job Pooling (Figure 8) to be processed by the Application Server and Database Server respectively. As the requests get processed by the system, the response generated forms another queue, which is also General distribution. Third flowchart depicts the service time evaluation methodology for the system.
3.1 Flowchart for generation of General
Distribution of Arrival of Request (
Ar(i)
)
NO
[image:4.595.302.539.92.650.2]
Figure 3: Flowchart for Generation of General Distribution of Arrival
START
Read n, ,, b,a
Generate N/5 Equiprobable
Y[EQP]
Generate N/5 Equiprobable (X)
Y[EX]
Generate N/5 Equiprobable (X)
Merge Y[EQP], Y[EX], Y[BER], Y[GEO], Y[GAUS]
Prepare String Ar(i), i(1,N)
Ar(i) = 0
Ar(i) = Ar(i) + A(i)
PRINT Ar(i)
i=i+1
IS i=N? Y[BER] = (-a+SQRT(a2+2bx))/b
Print Y[BER]
Y[GEO] = (1-exp(delta * x)/b Generate N/5 Equiprobable (X)
Print Y[GEO]
Generate 12 Equiprobable X(i)
Take MEAN(i) = Y[GAUS]
i=i+1
TOU=SUM Ar(N)
i=1
Arr(i) = [Ar(i) * N *λ]/100
PRINT Arr(i)
IS i=N? i=i+1
STOP
YES IS i=12?
1
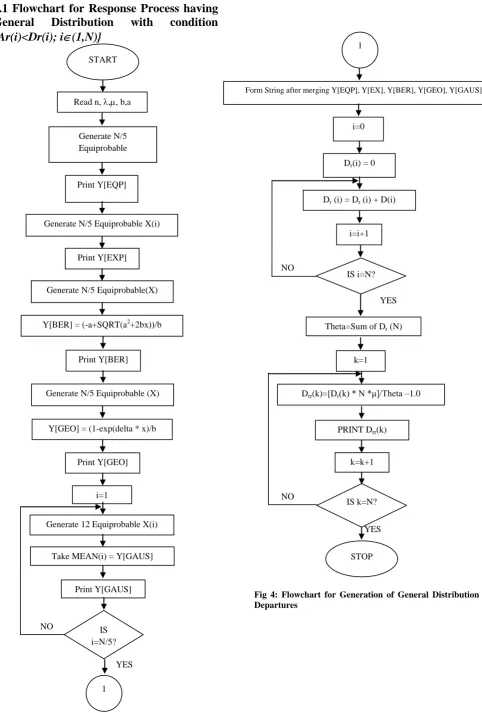
3.1 Flowchart for Response Process having
General
Distribution
with
condition
{
Ar(i)<Dr(i); i
(1,N)}
NO
NO
YES
NO
YES
Fig 4: Flowchart for Generation of General Distribution Departures
START
Read n, ,, b,a
Generate N/5 Equiprobable
Print Y[EQP]
Generate N/5 Equiprobable X(i)
Print Y[EXP]
Y[BER] = (-a+SQRT(a2+2bx))/b
Print Y[BER] Generate N/5 Equiprobable(X)
Y[GEO] = (1-exp(delta * x)/b Generate N/5 Equiprobable (X)
Print Y[GEO]
Generate 12 Equiprobable X(i)
Take MEAN(i) = Y[GAUS]
Print Y[GAUS] i=1
YES
1 IS i=N/5?
Form String after merging Y[EQP], Y[EX], Y[BER], Y[GEO], Y[GAUS]
i=0
Dr(i) = 0
Dr (i) = Dr (i) + D(i)
i=i+1
IS i=N?
Theta=Sum of Dr (N)
k=1
Drr(k)=[Dr(k) * N *μ]/Theta –1.0
PRINT Drr(k)
IS k=N? k=k+1
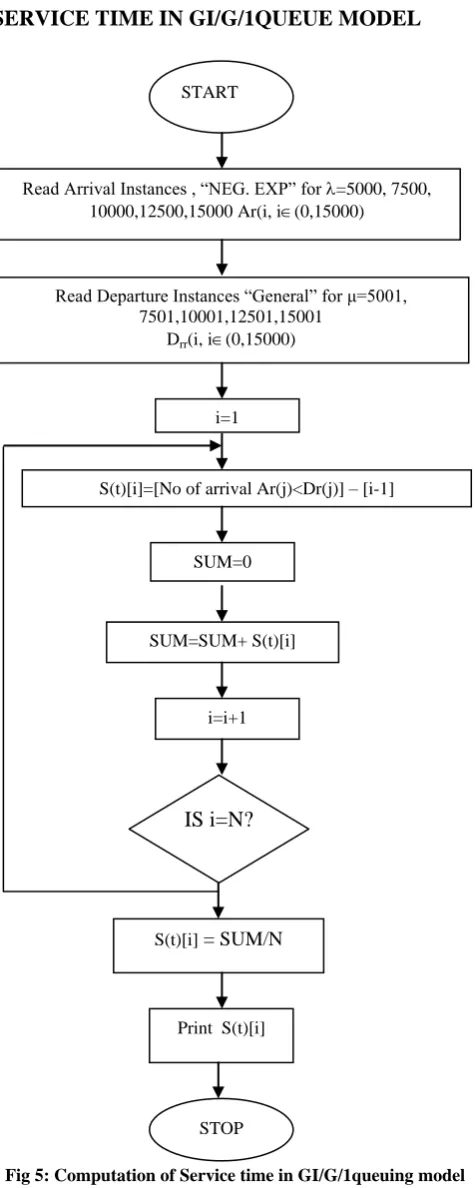
[image:5.595.61.544.71.784.2]3.3 FLOWCHART FOR COMPUTATION OF
SERVICE TIME IN GI/G/1QUEUE MODEL
Fig 5: Computation of Service time in GI/G/1queuing model
5 EVALUATION OF JOB SCHEDULING
ALGORITHM VIA GI/G/1 ALGORITHM
IN A CLIENT SERVER ENVIRONMENT
In cases of simulation study, best results are obtained when entire program are seen at one stretch of time. As random generation is used to be pseudo, hence, manipulation should
be carried out for the generation of random number. The results obtained after running the programs are consolidated in the Figure 6.
Fig 6: Service Time Computations
[image:6.595.315.539.113.238.2]Based on the results obtained by executing the Job Scheduling algorithm in a Client Server environment, we obtain that service time S(t) for M/M/1 queuing model, which is a linear equation with a slope of unity. For GI/G/1, if we observe the plot, based on Figure 6, we obtain curves. The curve obtained is smooth and can be assumed to be a second order polynomial, which is close to first order polynomial of M/M/1 Queuing model. The graphs between M/M/1 and GI/G/1queuing models are given in the Figure 7.
Fig 7: Graph between M/M/1 and GI/G/1queuing models
6
ELECTRONIC
COMMERCE
ARCHITECTURE IMPLEMENTATION
IN
A
CLOUD
COMPUTING
ENVIRONMENT
The proposed Electronic Commerce architecture is an extension to the system of Client Server Computing. In the architecture, the Application Server and the Database Server are implemented in the public cloud. So the customer using the application is not fretful with the complexities of the Business logic and is offered the complete web application with added service. Thus, the architecture offers a significant workload shift.
In the proposed architecture, the Web server has to no longer do the entire profound lifting when it comes to running applications. The network of clouds, which includes Application Server and Database Server(s), hold the impediments of the architecture. Also, the hardware and software demands on the user’s side dwindle and the web server only executes the architectures interface software, START
Read Arrival Instances , “NEG. EXP” for =5000, 7500, 10000,12500,15000 Ar(i, i(0,15000)
Read Departure Instances “General” for μ=5001, 7501,10001,12501,15001
Drr(i, i(0,15000)
i=1
S(t)[i]=[No of arrival Ar(j)<Dr(j)] – [i-1]
SUM=0
SUM=SUM+ S(t)[i]
i=i+1
IS i=N?
S(t)[i] = SUM/N
[image:6.595.322.513.360.521.2]whilst the cloud network takes care of the rest. The comprehensive architecture is depicted in Figure 8.
6.1 Step by Step architecture explanation
As illustrated in Figure 8, all the clients requests is being received at the Web Server. Since, there is an adoption of General Independent distribution; the Web Server transfers the requests to one of the distribution channels. Since, five different distributions are used in the proposed architecture, which is shown using five straight lines in the figure (Figure 8). Job Pooling Server executes the software code for the arrival instances (flowchart given in Figure 3) and merges all the requests into one queue and transfers the requests to the Cloud Computing environment. In the cloud computing environment, the requests are being received by Application Server on FCFS basis and generate the business logic. Through the pool of database servers, the Application Server generates the response by using the departure instance software program (flowchart given in Figure 4). By the time, the cloud computing environment generates the responses, the Job Pooling system, generates another queue to the executed. Upon receiving the response, Job Pooling system executes the software program to evaluate the service time, S(t).
In order to evaluate the service time, a mathematical study is being conducted by using the “curve-fitting technique”, which is also known as Regression Technique. The complete mathematical evaluation is taken in the next section.
7 EVALUATION OF SERVICE TIME IN
THE
ELECTRONIC
COMMERCE
ARCHITECTURE
USING
REGRESSION/CURVE
FITTING
TECHNIQUE IN A CLOUD COMPUTING
ENVIRONMENT
Based on observation from Figure 7, the equation for service time for the GI/G/1queuing model can be assumed as:
(3)
What is required now, is to calculate the values of a0,a1 and a2 for the best fitted curve which has minimal error. To have minimal error in regression, mean square error is made minimal to give good result.
It is assumed at xi represents the rate of arrival of the requests on
the web server in the Electronic Commerce architecture, then, the value of Service time, will be represented by yi is represented by
(4) where, a0,a1 and a2 are coefficients of polynomial for GI/G/1model.
It must be also noted that, equation (6) is valid for larger rates of arrival of requests, which includes CASUAL EFFECT. This cannot be employed for lower rates of arrival.
If “S” represents the error in computation and real values of Service time, then, “S”, which is square of derivation, is mathematically represented as:
= (5)
If we differentiate S w.r.t., a0,a1,a2 and setting each of these coefficients equal to zero, we get
2
0 1 i 2 i i
na
a
x
a
x
y
(6)2 3
0 i 1 i 2 i i i
a
x
a
x
a
x
x y
(7)2 3 4 2
0 i 1 i 2 i i i
a
x
a
x
a
x
x y
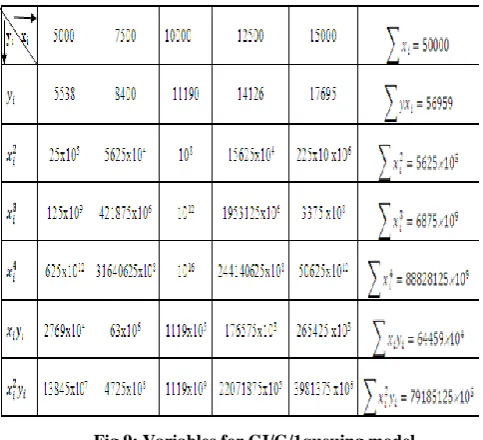
(8) where, “n” represents the degree of polynomials as “n” equations are formed for the summation. Equations (6), (7) and (8) are three linear equations in three unknowns. These are called normal equations for quadratic regression and can be solved by Gaussian Elimination technique. [image:7.595.41.280.102.213.2]Figure 9 is being constructed to the calculation of coefficients of polynomial.
Fig 9: Variables for GI/G/1queuing model
The last column of Table 2 are substituted in the normal equations (as envisaged in equations (6), (7) and (8)), the following set of equations are obtained:
By Gaussian elimination and using back substitution, the values of a0, a1 and a2 are as follows:
Based on equation (3), the mathematical equation for Service time is:
S(t)= (9)
[image:7.595.313.538.182.249.2] [image:7.595.301.543.338.558.2]From equation (9), the service time computations for the job scheduling algorithm in a Cloud Computing environment is given in Figure 10.
Response generated by the System (Service time/s) in a Cloud Computing environment
5000 4670.857
7500 7340.571
10000 10233.14
12500 13348.57
15000 16686.86
Fig10: Service Time Computations
8 PERFORMANCE ANALYSIS
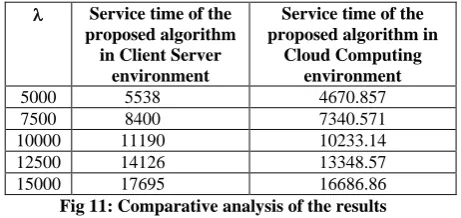
[image:8.595.46.277.309.418.2]The preeminent slant for the performance analysis is to weigh against the outcome obtained in Figure 10 and bout with the results of Figure 6 and formulate elucidations accordingly.
Fig 11: Comparative analysis of the results
[image:8.595.43.277.455.638.2]The results obtained are depicted by means of graph for an effortless performance investigation in Figure 12.
Fig 12: Graphical representation of the Job scheduling algorithm in both the environment
Figure 12 clearly depicts that the proposed Job scheduling algorithm takes quite a less service time in Cloud computing environment than on the Client Server environment, which proves the effectiveness and efficiency of the proposed algorithm.
9 CONCLUSION
The study proposed the Job scheduling algorithm based on GI/G/1queuing representation. The algorithm was implemented in Electronic Commerce architecture both in Client Server environment and Cloud computing setting. The study demonstrates that the algorithm gives the enhanced consequences in a Cloud computing scenario. The result was based on 15000 requests being received per unit time, wherein, each of the distribution channels was allocated 3000 requests apiece. The algorithm was based on ergodic condition and permanence was maintained and scrutinized throughout the implementation of the experimentation. The study is premeditated to be demeanor even advance, when elevated amount of requests being acknowledged and Service time being assessed accordingly.
10 REFERENCES
[1] “Technologies for Next Generation Networks”, http://www.fub.it/it/aree/tecnologieretinuovagenerazione, 17/09/2011.
[2] "INTERNET USAGE STATISTICS, The Internet Big Picture", http://www.internetworldstats.com/stats.htm, 23/09/2011.
[3] “CLOUD COMPUTING – An Overview”,
http://www.thbs.com/pdfs/Cloud-Computing-Overview.pdf, 30/09/2011.
[4] Riktesh Srivastava et.al, “Design and Implementation of G/G/1 Queuing Model Algorithm w.r.t. its Applicability for Internet Gateway Server”, International Arab Journal of Information Technology (IAJIT), Volume 5, Number. 4, October 2008, ISSN: 1683-3198.
[5] Riktesh Srivastava, et.al, “Memory Estimation of Internet Server using Queuing Theory: Comparative Study between M/G/1, G/M/1 and G/G/1 Queuing Model”, International Journal of Computer and Information Science and Engineering (IJCISE), Volume 1 Number 2, 2007 ISSN: 1307-4164.
[6] Riktesh Srivastava, et. al, “Estimation of Buffer Size of Internet Gateway Server via G/M/1 Queuing Model”, International Journal of Applied Science, Engineering and Technology, Volume 19, pp. 474-482, January 2007. [7] Riktesh Srivastava, et. al, “Estimation of Buffer Size of Internet Gateway Server via G/M/1 Queuing Model”, International Journal of Applied Science, Engineering and Technology, (IJASET) Volume4, Number 1, 2007, ISSN: 1307-4318.
Service time of the proposed algorithm
in Client Server environment
Service time of the proposed algorithm in
Cloud Computing environment
5000 5538 4670.857
7500 8400 7340.571
10000 11190 10233.14
12500 14126 13348.57