9
Simulation based analysis of RTT with PER, Buffer Size
and Congestion Levels for Satellite based Networks
Mohanchur Sarkar
SATCOM Application Area Space Applications Centre, ISRO
Ahmedabad, India
K. K. Shukla
Department of Computer Engineering
Institute of Technology, BHU Varanasi, India
K. S. Dasgupta
Indian Institute of Space Science and Technology (IIST) Thiruvananthapuram, India
ABSTRACT
Round Trip Time values constitute one of the significant parameter available to a TCP sender for estimating the network conditions. The RTT has a significant effect on the throughput of a connection and creates the performance bottleneck for traditional AIMD TCP Protocol variants mainly when used for GEO satellite networks and other long fat networks. Many Transport Protocols like Vegas, Proactive TCP, and Westwood uses the RTT measurement for adjusting the congestion window and refining the Loss Detection Algorithms, which eventually determines the performance of the Protocol. RTT also appears in the empirical formulation of TCP throughput and protocols based on these empirical estimates. RTT is generally considered an independent parameter mainly dependent on the access delay, queuing delay, and the propagation delay of the concerned channel. In this paper, we have analyzed the dynamics of RTT behavior and shown how the congestion levels in the network, packet error rates and available buffer capacity affects the RTT measurements. The Mean RTT and the rate of change of RTT Mean values have been analyzed in different network conditions. These analysis have been carried out by simulation using ns2 considering a GEO Satellite network.
General Terms
TCP Vegas, Proactive TCP, RTT, GEO, RTT Mean, ns2
Keywords
RTT Analysis, Correlation, Congestion Epoch, Loss Detection Algorithm
1.INTRODUCTION
Round Trip Time (RTT), values constitute one of the significant parameter available to a TCP sender for estimating the network conditions. The RTT has a significant effect on the throughput of a connection and creates the performance bottleneck for traditional AIMD TCP Protocol variants mainly when used for GEO Satellite Networks and in other long fat networks [1], [12], [35], [36], [37]. Many Transport Protocols like Vegas [40], Proactive TCP [4], and Westwood [23] uses the RTT measurement for adjusting the congestion window and refining the Loss Detection Algorithms, which eventually determines the performance of the Protocol. One of the major problems in a satellite-based network is the random packet
errors, which are not common in the wired counterpart [30], [31], [32]. The RTT is constrained by the speed of light and the total amount of data that needs to be sent in one RTT is given by the bandwidth-delay product of the link concerned and is not really achieved by the acknowledgement driven logic of TCP [1], [3], [6]. Moreover, there are problems because of bandwidth asymmetry and intermittency of the link. Generally, probing is done in protocols like Peach [26], Peach+ [21], TP-Planet [20], and RCS [10], [16]. Other approaches to transport protocol design are found in [1], [2], [4], [5], [15], [17], [22], [23], [25], [28], [29], [33], [34], [38], [40], [41], and [42] where the transport protocol stack in the sender and receiver are only modified. Transport protocols with network-assisted operation are given in [8], [9], [11], [13], [14], [18], [19], [24] and [27].
In this paper through a series of simulation based experiments an attempt has been made to characterize the RTT dynamics, find its relation with packet error rate (PER), and congestion levels in the network.
Fig1. Simulation Scenario
As shown in Fig.1, a simulation scenario where 10 senders transmit data to 10 receivers through a satellite channel. The 10 streams are multiplexed in Earth Station A, whose buffer can accommodate 25 segments. The segments may get lost with a packet error rate (PER). In this experiment, all the 10 senders are each connected to the Earth station A, with a link of bandwidth 500kbps and RTT of 10ms. All the 10 receivers are connected to Earth station B with a 500kbps link with RTT 10ms. The receiver window (rwnd) is set to 64 segments, the link between Earth Station A to B via satellite to be 5Mb and Connection1
Sender
Connection2 Sender
Connection 10 Sender
Earth Stat ion A
Earth Station B
Connection1 Receiver
Connection2 Receiver
Connection 10 Receiver Simulated
GEO Satellite Channel RTT
10 the RTT between the two stations as 550ms. The time of
simulation have been kept to 550 seconds, which is 1000 times the round trip time. All the nodes are continuously sending packets to the destination node.
For performing the analysis, the RTT experienced by a single connection is considered. Since 10 connections share a 5Mbps link for a single connection the bandwidth available is 500 kbps and RTT is 550 ms with TCP Packet Size = 1000 bytes. Therefore, the Bandwidth Delay Product (BDP) is 275000 bits or 34 TCP packets approximately. This means that as per the raw channel bandwidth is concerned sending of 34 TCP packets in one RTT i.e. within 550ms will fully utilize the channel. Conversely, we can say that if the protocol wants to pump more than 34 packets/segments of 1000 bytes each the link will not be able to sustain this load and congestion will likely to be generated in the network. That will initially lead to an increase in the RTT experienced by the packets as the queue will start growing as the destination/router queue will try to accommodate the packets arriving till the size of the queue is reached. As long as the buffer can accommodate the incoming packets, the only tangible parameter of the progressing loading of the network will be the increase in the RTT values. After the queue is much overloaded, the packets have to be dropped from the queue and the sender will start receiving Duplicate packets as Congestion based loss of packet will start.
Moreover, loss of packets can also happen when the packets are corrupted by channel noise and reach the destination with erroneous bits and are rejected and the sender receives a Duplicate Acknowledgement [1], [2], [3]. For an efficient design of Transport Protocol for satellite-based networks, designers analyze this phenomenon and try to see how it can be concluded with some amount of confidence that what was the actual cause of the lost packet [30], [31], [32], [39].
For doing this sort of analysis, it is seen that the only information, which is available with the sender, is the RTT values. In this work, an attempt is being made to find out that from the RTT values, whether we can make some idea about the network condition. By the network condition, we mean (i) The level of congestion in the network and (ii) The level of corruption in the network.
The value of the RTT and the way they change i.e. the rate in which the RTT increase, decrease, or remain constant has some relation with the level of congestion or corruption in the network. Here we will try to see the impact of Packet Error rates and Congestion on the Rate of Increase/Decrease or constant pattern of the RTTthrough simulations performed in ns2.
2 RTT MEAN ANALYSIS
The RTT in general is considered an independent parameter. While a TCP connection proceeds, if we measure the individual RTT values for every window for all the segments transmitted in that window it will not convey much information regarding the condition of the network as the transient RTT values are dependent on many dynamic network parameters which
changes so frequently that no stable conclusion can be drawn from them. Moreover, the frequency with which we sample the RTT values is generally less than the Nyquist sampling frequency requirement if we consider the RTT samples as a time varying signal. So as the sampling is done at a rate lower than needed, a proper reconstruction of the signal will not be possible, and there is a chance to respond to values corrupted with noise. Another important point is that in a network there are many connections sharing a shared bandwidth [7] so an increase or decrease in RTT cannot be attributed to be happening because of that particular connection so taking action on the individual RTT values may not generate optimal conclusion.
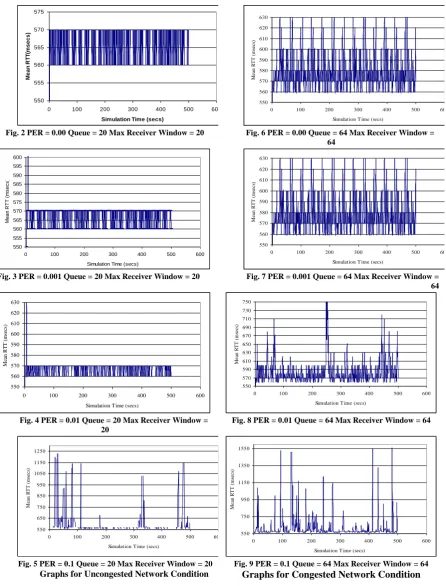
In this paper, we have performed some simulation-based experiments using ns2 [43] to find out the impact of network congestion and packet error rates on the RTT values. We have assumed that the mean of all the RTT values in a window convey more information or may be thought of a more representative value of the RTT for that specific window. In the simulation, we have performed two classes of experiments (i) considering an uncongested network, (ii) considering a congested network and (iii) progressive levels of network congestion. In Fig.2 to Fig. 10, the mean RTT value is plotted with simulation time for a TCP connection as the Simulation progresses. First we have considered the packet error rate to be 0 and it can be seen from Fig. 2, that the mean RTT remains in a closed range of 560 to 570 ms. On the contrary, in Fig. 6 even with PER zero, the mean RTT values shown are more dispersed which shows the effect of congestion on the RTT values. In both the network conditions we have gradually increased the packet error rate from PER 0.001 to PER 0.1 and it has been observed that as we increase the PER, for uncongested network the values are seen to have more frequent flickers and dispersion increases. In a congested network condition, the effect is more pronounced than its uncongested peer for the same PER. It has also been observed that congested network condition leads to an increase in the DC value of the concerned parameter. It has also been observed that during PER = 0.1 the variability in the mean RTT is less than that at PER = 0.01, which is against our proposition that increased PER leads larger dispersion and flickering of mean RTT values. This is because of the fact, that for any congestion control protocol a very high PER naturally reduces the transmission rate as the AIMD protocols are mislead by the high degree of wireless channel errors as a sign of congestion. With this decreased transmission rate the queuing delay decreases and the rate of change of RTT is less.
2.1. Mean RTT Variation with Increasing
Congestion
11
550 555 560 565 570 575
0 100 200 300 400 500 600
Simulation Time (secs)
Me
a
n
R
T
T
(m
s
e
c
s
)
550 560 570 580 590 600 610 620 630
0 100 200 300 400 500 600
Simulation T ime (secs)
M
ea
n
R
T
T
(
m
se
cs
)
Fig. 2 PER = 0.00 Queue = 20 Max Receiver Window = 20 Fig. 6 PER = 0.00 Queue = 64 Max Receiver Window = 64
550 555 560 565 570 575 580 585 590 595 600
0 100 200 300 400 500 600
Simulation Time (secs)
M
e
a
n
R
T
T
(
m
s
e
c
s
)
550 560 570 580 590 600 610 620 630
0 100 200 300 400 500 600
Simulation T ime (secs)
M
ea
n
R
T
T
(
m
se
cs
)
Fig. 3 PER = 0.001 Queue = 20 Max Receiver Window = 20 Fig. 7 PER = 0.001 Queue = 64 Max Receiver Window = 64
550 560 570 580 590 600 610 620 630
0 100 200 300 400 500 600
Simulation Time (secs)
M
ea
n RT
T
(m
se
cs
)
550 570 590 610 630 650 670 690 710 730 750
0 100 200 300 400 500 600
Simulation T ime (secs)
M
ea
n
R
T
T
(
m
se
cs
)
Fig. 4 PER = 0.01 Queue = 20 Max Receiver Window = 20
Fig. 8 PER = 0.01 Queue = 64 Max Receiver Window = 64
550 650 750 850 950 1050 1150 1250
0 100 200 300 400 500 600
Simulation T ime (secs)
M
ea
n
R
T
T
(
m
se
cs
)
550 750 950 1150 1350 1550
0 100 200 300 400 500 600
Simulation T ime (secs)
M
ea
n
R
T
T
(
m
se
cs
)
Fig. 5 PER = 0.1 Queue = 20 Max Receiver Window = 20 Fig. 9 PER = 0.1 Queue = 64 Max Receiver Window = 64
[image:3.595.79.526.69.656.2]12 500
1000 1500 2000 2500 3000
0 100 200 300 400 500 600
Simulation Time (secs)
M
ea
n
R
T
T
(
m
s)
[image:4.595.56.284.71.203.2]B = 500 kbps B = 400 kbps B = 300 kbps B = 200 kbps B = 100 kbps
Fig.10 RTT Mean Variation For Different Congestion Levels
required is .5 kbps. Fig.10 directly depicts the high correlation of the DC value of the RTT mean has with increasing levels of congestion. Since the experiment is considering a GEO satellite link, with typical RTT aroung 550 to 570 ms and in Fig. 10 higher values even upto 2700ms is observed in 0.1kbps case of highest congestion level. So, a very high increase in the DC value of Mean RTT can be concluded to be an effect of very high congestion in the network. From these experiments, we can conclude that RTT has multivariate correlation with congestion and PER prevailing in the network.
3.RTT RATE ANALYSIS
The rate with which the Mean RTT increases is a measure of how fast the congestion is growing in a network and the rate with which is falls signals how efficiently the congestion control algorithm is handling the increased load in the network. As we are doing, a simulation based analysis of the impact of congestion and PER on RTT an analysis has been made to comprehend the impact of congestion and wireless channel error rates on the rate of increase and decrease of the Mean RTT.
To perform the analysis we have considered simulation scenarios for an uncongested network condition, congested network condition and varying levels of congestion.
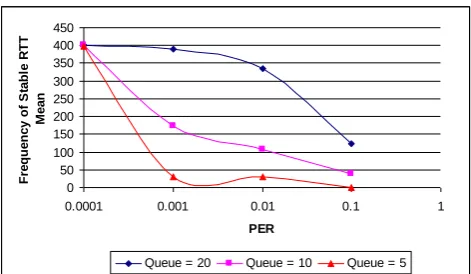
Fig11 shows the mean percentage rate increase for different Packet Error rates considering different buffer space available for the connections. The x-axis shows the PER from 0.0001 to 0.1. It can be seen that the Rate of Mean RTT Increase, increases with increasing PER. Moreover, the rate of Mean RTT Incresae is seen to increase with lower buffer space available. Therefore, when the queue is only 5 packets the rate of increase is much more than when the queue is 20 or 10 packets. It is observed that even in uncongested network condition an increase in packet error rate from 0.0001 to 0.1 increases the rate of increase from 2% to 15%. This shows the positive correlation the rate has on PER. The effect is more pronounced when the buffer availability is less in which case a 25% increase is observed under 0.01 PER. An important observation in Fig 11 is that the mean rate increase for 0.01 PER is more than 0.1 PER. This is because of the fact that with very high error level of 0.1 the transmission rate in the
Un congested Network
0 5 10 15 20 25 30
0.0001 0.001 0.01 0.1 1
PER
M
e
a
n
P
e
rc
e
n
ta
g
e
R
T
T
_
R
a
te
I
n
c
re
a
s
e
[image:4.595.309.543.78.268.2]Queue = 20 Queue = 10 Queue = 5
Fig 11 Mean RTT_Rate Increase with PER and Buffer Size
0 5 10 15 20 25
0.0001 0.001 0.01 0.1 1
PER
M
e
a
n
P
e
rc
e
n
ta
g
e
R
T
T
R
a
te
D
e
c
re
a
s
e
queue = 20 queue = 10 queue = 5
Fig 12 Mean RTT_Rate Increase with PER and Buffer Size
0 50 100 150 200 250 300 350 400 450
0.0001 0.001 0.01 0.1 1
PER
Fre
qu
e
nc
y
of
S
ta
bl
e
R
TT
M
e
a
n
Queue = 20 Queue = 10 Queue = 5
Fig 13 Frequency of Stable Mean RTT with PER and Buffer Size
[image:4.595.309.541.283.447.2] [image:4.595.309.545.465.602.2]13 Fig 12 shows the rate of decrease of RTT with respect to PER
and different buffer space available. The rate of decrease also increases with PER and paucity of buffer space but less than that of RTT rate increase.
Rate with different network condition
0 5 10 15 20 25 30 35 40 45 50
0.0001 0.001 0.01 0.1 1
PER
R
T
T
_
In
c
re
a
s
e
_
R
a
te
(%
)
[image:5.595.56.283.313.663.2]Uncongested Optimal Congestion Congested
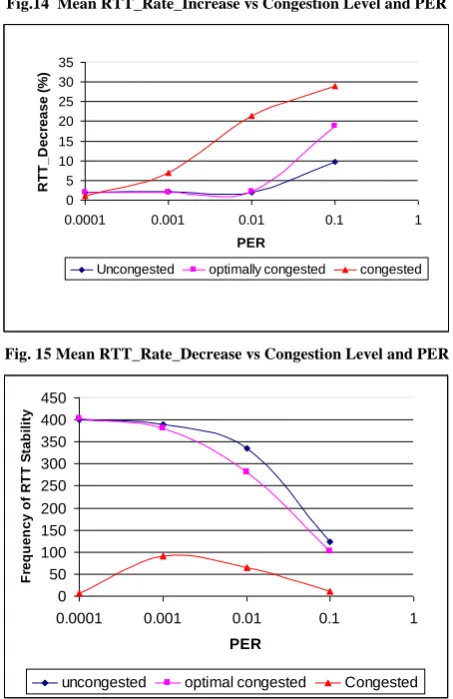
Fig.14 Mean RTT_Rate_Increase vs Congestion Level and PER
0 5 10 15 20 25 30 35
0.0001 0.001 0.01 0.1 1
PER
R
T
T
_
D
e
c
re
a
s
e
(
%
)
Uncongested optimally congested congested
Fig. 15 Mean RTT_Rate_Decrease vs Congestion Level and PER
0 50 100 150 200 250 300 350 400 450
0.0001 0.001 0.01 0.1 1
PER
F
re
q
u
e
n
c
y
o
f
R
T
T
S
ta
b
il
it
y
uncongested optimal congested Congested
Fig.16 Frequency of Stable RTT vs Congestion Level and PER
In Fig 13 shows the frequency of Mean RTT stability. This is a measure, which shows how many times throughout the simulation process consecutive Mean RTTs have remained almost same or deviated by very less amount. This parameter, which is named as stability, is a very good measure to find the impact of congestion and corruption on RTT values.
This is very important parameter to differentiate the varying levels of congestion and corruption in a connection. It decreases with more PER and less buffer size. It is a measure of how much jitter will be experienced by a connection RTT values. In Fig 13, it can be observed that the buffer space is a very important requirement for a good RTT stability. With less buffer the stability comes to almost zero at PER of 0.001. Therefore, stability is a good measure of the extent of congestion in the network as it can be seen that with adequate buffer space the stability is better even at 0.1 PER. Thus, it can be inferred that a low stability value is a very good indication of congestion.
In Fig. 14, Fig. 15 and Fig. 16 the rate of increase, decrease and stability is shown to vary with PER considering different levels of congestion in the network. It has been observed that Mean RTT Increase and Decrease Rates are directly proportional to Congestion and Packet error rate and inversely proportional to Buffer Size. Stability is inversely proportional to the degree of congestion and packet error rate.
Table1. Correlation Coefficient for RTT Rate Increase, Decrease and Stability with PER for different network congestion levels
Un-congested
Moderately Congested
Highly Congested
RTT Rate Increase
0.995709 0.996295 0.854919
RTT Rate Decrease
0.996293 0.996925 0.803154
RTT Stability
-0.99129 -0.95484 -0.50853
Table2. Correlation Coefficient for RTT Rate Increase, Decrease and Stability with PER for different network congestion levels
Queue = 20 Queue = 10 Queue = 5
RTT Rate Increase
0.995709 0.999763 0.452355
RTT Rate Decrease
0.996293 0.991094 0.803638
RTT Stability
-0.99129 -0.65120 -0.50853
Table3 Correlation of RTT Mean with Congestion levels for No error condition
Increasing Congestion Levels Mean RTT in ms
1 570ms
2 760ms
3 910ms
4 1400ms
5 2700ms
14
0 500 1000 1500 2000 2500 3000
0 1 2 3 4 5 6
Increasing Congestion Levels
M
e
a
n
R
T
T
V
a
lu
e
s
(
m
s
)
Fig17. Mean RTT Increase with Increasing Congestion level
As shown in Fig17 the mean RTT values is seen to increase with increasing congestion levels. It can be seen that the increase is slower with initial congestion levels but as congestion becomes very high, the increase is quite drastic. When congestion levels are very high, as seen in Fig. 17 that from congestion level 4 to 5 the Mean RTT has doubled.
4.
A
MATHEMATICAL
INTERPRETATION
OF
THIS
RELATIONSHIP
In this section, an attempt has been made to provide a mathematical interpretation of the observations. A relation has been established with RTT, Congestion Window, Bandwidth, and Buffer size.
From the point of view of a sender, the network can be thought of as a black box having some Buffer B with the sender pumping packet into it at some rate denoted by I (t). From the point of view of the network, it has a capacity to store data of size B and a capability to move the data from one point to the other at a rate given by say R(t).
Therefore, the time it takes for the buffer to overflow, is equivalent to the congestion epoch, CE (t) which is defined as the time interval between two successive congestion events. The buffer available to a particular connection is time varying and depends on the number of other connections sharing the network so it is B (t). I(t) – R (t) is the amount of data remaining in the network at every secs, and the queue increases when I(t) > R(t). If I (t) < R(t) then whatever data enters the network can be handled by the bandwidth of the network and theoretically there will be no buffer overflow or no congestion in the network. Therefore, CE (t) is given by
)
(
)
(
)
(
)
(
t
R
t
I
t
B
t
CE
(1)
))]
(
)
(
[(
)]
(
[
)]
(
[
t
R
t
I
E
t
B
E
t
CE
E
(2)
)]
(
[
)]
(
[
)]
(
[
)]
(
[
t
R
E
t
I
E
t
B
E
t
CE
E
(3)
E [CE (t)] = Kce, can be considered as constant for a particular protocol and particular network which can be thought of as an average value for the interval when repeated congestion events are experienced.
E[R (t)] = R, can be considered to be the maximum Bandwidth of the channel
Kce
t
B
E
R
t
I
E
[
(
)]
[
(
)]
(4)
E [I (t)] = cwnd (t) / rtt (t), the input rate is equivalent to the prevailing congestion window at that time divided by the RTT
R
Kce
t
B
E
t
rtt
t
cwnd
[
(
)]
)
(
)
(
(5)
R
Kce
t
B
E
t
cwnd
t
rtt
)]
(
[
)
(
)
(
(6)Equation (6) relates the RTT with the congestion window, available buffer and the bandwidth or rate in which data can be transported in the network.
When, congestion starts developing in the network the available buffer space reduces in (6) reduces, and during this time if the sender itself overestimates the network capacity and increases its congestion window there is an decrease in the denominator and increase in the numerator which leads to an increase in the rtt values.
After the congestion the participating senders reduces their rates which eventually reduces the congestion window of the numerator in (6) and the available buffer space B(t) in the denominator starts increasing which signals the network is coming out of congestion and the rtt is seen to reduce. When the congestion window or the rate in which data is being pumped in the network remains stable along with stable buffer availability there is a stable behavior of the RTT perceived.
5. CONCLUSION
15 stability is also compared considering both un-congested
network conditions and network with varying levels of congestion. The paper also finds the correlation coefficients of RTT variation with PER under different network conditions. The inference obtained from these simulations can be used in the development of a more generic loss detection algorithm. A mathematical justification has also been provided which shows analytically the RTT variation corresponding to buffer availability and congestion window variations.
ACKNOWLEDGMENT
Authors would like to thank Mr.Deval Mehta, Head SCTD, Mr. A.P.Shukla, Group Head, DCTG, and Mr.K.S.Parikh, Deputy Director, SNAA of Space Applications Centre (ISRO) for their constant encouragement towards the realization of this work.
REFERENCES
[1] Mohanchur Sarkar, K.K.Shukla and K.S.Dasgupta, Delay Resistant Transport Protocol for Deep Space Communication, International Journal of Communications, Network and System Sciences (IJCNS), Vol. 4, No. 2, February 2011, pp. 122-132.
[2] Mohanchur Sarkar, K.K.Shukla and K.S.Dasgupta, Network State Classification based on the Statistical Properties of RTT for an Adaptive Multi State Proactive Transport Protocol for Satellite based Networks, International Journal of Computer Networks and Communication (IJCNC), Vol. 2, No. 6, November 2010, pp. 155-174.
[3] Mohanchur Sarkar, K.K.Shukla, and K.S.Dasgupta, Performance Analysis of Proactive and Reactive Transport Protocols using a Proactive Congestion Avoidance Model, International Journal of Computer Applications (IJCA), Vol. 6, No. 5, September 2010, pp. 10-17.
[4] Mohanchur Sarkar, K.K.Shukla, and K.S.Dasgupta, A Proactive Transport Protocol for Performance Enhancement of Satellite based Network, International Journal of Computer Applications (IJCA), Vol. 1, No. 16, Feb 2010, pp. 114-121.
[5] L. Xu and I. Rhee, CUBIC: a new TCP-friendly high-speed TCP variant, ACM SIGOPS Operating Systems Review, Vol. 42 Issue 5, July 2008.
[6] R.H. Wang, W.T. Hsu, X. Wu, T. T. Wang and X. B. Wang, Experimental and Comparative Analysis of Channel Delay Impact on Rate-Based and Window-Based Transmission Mechanisms over Space-Internet Links, Proceedings of IEEE International Conference on Communications, Beijing, May 2008, pp. 2990-2994.
[7] S.C. Tsao, Y.C. Lai, and Y.D. Lin, Taxonomy and Evaluation of TCP Friendly Congestion Control Schemes on Fairness, Aggressiveness, and Responsiveness, IEEE Network, Vol. 21, Issue 6, November 2007, pp. 6-15.
[8] Space Communications Protocol Specification (SCPS) - Transport Protocol (SCPS-TP), Recommended Standard CCSDS 714.0-B-2 Blue Book, October 2006.
[9]SatLabs Groups, Interoperable PEP (I-PEP) transport extensions and session framework for satellite communications: air interface specifications, Techinicala Report, Issue 1a-27, October 2005.
[10] I. F. Akyildiz, O. B. Akan, and G. Morabito, A Rate Control Scheme for Adaptive Real-Time Applications in IP Networks with lossy links and long round trip times, IEEE/ACM Transactions on Networking, Vol. 13, Issue 3, June 2005, pp. 554-567.
[11] T. Taleb, N. Kato, and Y. Nemoto, REFWA Plus: Enhancement of REFWA to Combat Link Errors in LEO Satellite Networks, in Proc.2005 IEEE Workshop on High Performance Switching and Routing, Hong Kong, P. R. China, May 2005, pp. 172-176.
[12] C. Liu and E. Modiano, On the performance of additive increase multiplicative decrease (AIMD) protocols in hybrid space terrestrial networks, Elsevier Computer Networks, Vol. 47, Issue 5, April 2005, pp. 661–678.
[13] Kai Xu, Ye Tian and Nirwan Ansari, TCP performance in integrated wireless communications networks, The International Journal of Computer and Telecommunications Networking, Vol. 47, Issue 2, February 2005.
[14] K. Zhou, K. Yeung and V. O. K. Li, P-XCP: A-transport layer protocol for satellite IP network, In Proc. IEEE Globecom, November 2004, pp. 2707-2711.
[15] C. Caini and R. Firrincieli, TCP Hybla: a TCP enhancement for heterogeneous networks, International Journal of Satellite Communication and Networking, Vol. 22, No. 5, September 2004, pp. 547–566.
[16] Jian Fang and Ozgur B. Akan, Performance of Multimedia Rate Control Protocols in InterPlaNetary Internet, IEEE Communications Letters, Vol. 8, No. 8, August 2004, pp. 488-490.
[17] L. Xu, K. Harfoush and I. Rhee, Binary increase congestion control for fast, long distance networks, In Proceedings of IEEE INFOCOM, Hong Kong, Vol. 4, March 2004, pp. 2514-2524.
[18] M. Luglio, M. Sanadidi, M. Gerla, and J. Stepanek, On-board satellite split TCP proxy, IEEE Journal on Selected Areas in Communication (JSAC), Vol. 22, No. 2, February 2004, pp. 362-370.
[19] M. Marchese, M. Rosei and G. Morabito, PETRA: Performance enhancing transport architecture for satellite communications, IEEE Journal on Selected Areas in Communication, Vol. 22, No. 2, February 2004, pp. 320-332.
[20] O. B. Akan, J.Fang and I. F. Akyildiz, TP-Planet: A Reliable Transport Protocol for InterPlaNetary Internet, IEEE/SAC, Vol. 22, No. 2, February 2004, pp 348-61.
[21] K. Fall, W.Hong, and S. Madden, Custody Transfer for Reliable Delivery in Delay Tolerant Networks, Technical Report IRB-TR-03-030, Intel Research, Berkeley, July 2003.
[22] C.P Fu and S.C.Liew, TCP Veno: TCP enhancement for transmission over wireless access networks, IEEE Journal on Selected Areas in Communications, Vol. 21, Issue 2, Feb 2003, pp. 216-228.
16 (WINET) Journal, Vol. 8, Issue 5, September 2002, pp.
467-479.
[24] D. Katabi, M. Handley, and C. Rohrs, Congestion control for high bandwidth-delay product networks, In Proceedings of ACM SIGCOMM02, Pittsburg, August 2002, pp. 89-102.
[25] Ian F. Akyildiz, Xin Zhang and Jian Fang, TCP-Peach+: Enhancement of TCP-Peach for Satellite IP Networks, IEEE COMMUNICATIONS LETTERS, Vol. 6, No. 7, July 2002.
[26] Ian F. Akyildiz, Giacomo Morabito and Sergio Palazzo, TCP-Peach: A New Congestion Control Scheme for Satellite IP Networks, IEEE/ACM TRANSACTIONS ON NETWORKING, Vol. 9, No. 3, June 2001, pp. 307-321.
[27] J. Border, M. Kojo, J. Griner, G. Montenegro, and Z. Shelby, Performance enhancing proxies intended to mitigate link-related degradation, RFC 3135, June 2001.
[28] R. Steward et al., Stream Control Transmission Protocol, Internet Society, Reston, VA, RFC 2960, October 2000.
[29] S. Floyd, M. Handley, J. Padhye, and J. Widmer, Equation-Based Congestion Control for Unicast Applications, ACM SIGCOMM Computer Communication Review, Vol 30, Issue 4, October 2000, pp. 45-56.
[30] M. Allman, S.Dawkinks, et al., Ongoing TCP research related to satellites, RFC 2760, Feb 2000.
[31] C. Barakat, E. Altman, and W. Dabbous, On TCP performance in a heterogeneous network: a survey, IEEE Communications Magazine, Vol. 38, Issue 1, Jan 2000, pp. 40-46.
[32] N. Ghani and S. Dixit, TCP/IP enhancement for satellite networks, IEEE Communication Magazine, Vol. 37, No. 7, July 1999, pp. 64-72.
[33] S. Floyd and T. Henderson, The New Reno Modification to TCP's Fast Recovery Algorithm, RFC 2585, April 1999.
[34] T. Henderson and R. Katz, Transport protocols for Internet-compatible satellite networks, IEEE Journal Selected Areas in Communication, Vol. 17, No. 2, February 1999, pp. 326-344.
[35] C. Metz, TCP over satellite the final frontier, IEEE Internet Computing, Vol. 3, Issue 1, January 1999, pp. 76– 80.
[36] C. Partridge and T. J. Shepard, TCP/IP performance over satellite links, IEEE Network Magazine, Vol 11, Issue 5, October 1997, pp. 44–49.
[37] T.V.Lakshman and U.Madhow, The performance of TCP/IP for networks with high bandwidth-delay products and random loss, IEEE/ACM Trans. Networking, Vol. 5, Issue 3, June 1997, pp. 336-350.
[38] Mathis, M., J. Mahdavi, S.Floyd, and A.Romanow, TCP Selective Acknowledgment Options, RFC 2018, April 1996.
[39] H. Balakrishnan, S. Seshan, E. Amir and R. H. Katz, Improving TCP/IP Performance over Wireless Networks, Proc. ACM MOBICOM, November 1995, pp. 2-11. [40] L. S. Brakmo, S. O’Malley and L. L. Peterson, TCP
Vegas: New Techniques for Congestion Detection and Avoidance, ACM SIGCOMM Computer Communication Review, Vol. 24, Issue 4, October 1994, pp. 24-35.
[41] V. Jacobson, Berkeley TCP Evolution from 4.3-Tahoe to 4.3-Reno, Proc. British Columbia Internet Engineering Task Force, July 1990.
[42] V. Jacobson, Congestion avoidance and control , ACM SIGCOMM Computer Communication Review, Vol. 18, Issue 4, August 1988, pp. 314-329.