Journal of Chemical and Pharmaceutical Research, 2015, 7(7):799-807
Research Article
CODEN(USA) : JCPRC5
ISSN : 0975-7384
Study on performance evaluation of green agro-ecological compensation
Miao Tian
Business School, Huanggang Normal University, Huang Gang, HuBei Province, China
_____________________________________________________________________________________________
ABSTRACT
Under the context of global agricultural non-point source pollution increasing and the quality of agricultural products decreasing, to transform the mode of agricultural production is imperative. Due to the green agricultural production have strong positive externalities, ecological compensation as a economic means plays an important role on coordinating ecological environment protection and economic development. However, how effective it is, whether the desired objectives have been reached, these all require some proper methods to evaluate. This paper based on elaborating the connotation, principles and methods of Analytic Hierarchy Process, constructing index system of evaluating ecological compensation, intending to provide references and basis for evaluating the effectiveness of green agro-ecological compensation.
Keywords: green agriculture; ecological compensation; performance evaluation
_____________________________________________________________________________________________
INTRODUCTION
In theory, it is agreed that implementing green agro-ecological compensation could transform the mode of agricultural production and promote sustainable development of agriculture. However, how the effective it is, whether it is valid, these all require a set of appropriate methods to evaluate.
Performance evaluation refers to using some certain evaluation methods, quantitative indicators and evaluation criteria to evaluate the degree of realization and the executed results that in order to achieve this goal.
This paper based on analyzing various methods of performance evaluation, constructing index system of green agro-ecological compensation by Analytic Hierarchy Process, intending to evaluate the performance of the implementation of ecological compensation for green agriculture and put forward suggestions for development.
1.The connotation and function of performance evaluation about green agro-ecological compensation 2.1 The connotation of performance evaluation about green agro-ecological compensation
It means that under certain time and certain conditions of science and technology, people construct some methods based on the realization of agro-ecological compensation which can reflect the effectiveness and influences after the implementation of ecological compensation.[1] Its purpose is by appropriate method, indicator and based on the intrinsic relationship between these indicators to form a comprehensive evaluation system. Using it to reflect and measure the effectiveness of the agro-ecological compensation policies, recognize and diagnose the deficiencies and problems in different regions. Through this way, to draw the basic outline of agro-ecological compensation in different regions, different types and different models, in order to provide work direction and quantify range for efficient agro-ecological compensation countermeasures.
2.2 The functions of performance evaluation about green agro-ecological compensation 2.2.1 To promote the sustainable development of green agriculture
______________________________________________________________________________
the use of high-tech green agricultural technology to form modern industrial system, especially emphasize the protection of agricultural ecological environment[2].
Green agriculture has a strong positive externalities, it is prone to generate "free rider" which could affect the implemented effectiveness and sustainability.
By implementing policy of green agro-ecological compensation and evaluating the performance, it can reveal the hidden ecological costs in the past, force the public and enterprise to take measures reduce the occupation of environmental resources, reduce pollution and destruction, by this way, it is conducive to preventing and control the environmental damages from the source, also it can provide a powerful guarantee for the sustainable development of green agriculture.
2.2.2 To promote coordinating development of agro-ecological environmental protection and economic
At first glance, the relation between agro-ecological environmental protection and economic efficiency is contradicting: agro-ecological protection is bound to sacrifice some economic benefits and strive for more economic benefits is bound to affect the agricultural ecological protection. How to find the balance point of the two parts and achieve optimal development has become the focus. In order to make the protection of effectiveness for agro-ecological resources effectively and obtain considerable economic benefits, the system of agro-ecological compensation is widely used.
However, the mechanism of performance evaluation is conducive to make clear the relations which seemingly contradict, and make people realize the two parts are complementary, furthermore, it is conducive to increase people's awareness of environmental protection, strength efforts to develop agro-ecological compensation, and ultimately promote the coordination development between agriculture and economic.
2.2.3 To monitor the effectiveness of implementation about green agro-ecological compensation
Performance evaluation of agro-ecological compensation must be supported by a series of quantitative indicators, almost all works could not be carried out smoothly and could not obtain high quality results without quantitative researches and quantitative indicators.
Therefore, from the essence, the evaluation index system is a fundamental part of performance evaluation, it derived from all levels of the research process, meanwhile, it service all levels.
3.The performance evaluation methods of green agro-ecological compensation 3.1 Comparative analysis
[image:2.595.63.549.536.721.2]Comparative analysis method is a basic method which is used for evaluating policy, it is a basic framework evaluating activities, all other methods are under the guidance of this approach. By contrasting the differences before and after the implementation of the policy, people can see the apparent effectiveness.
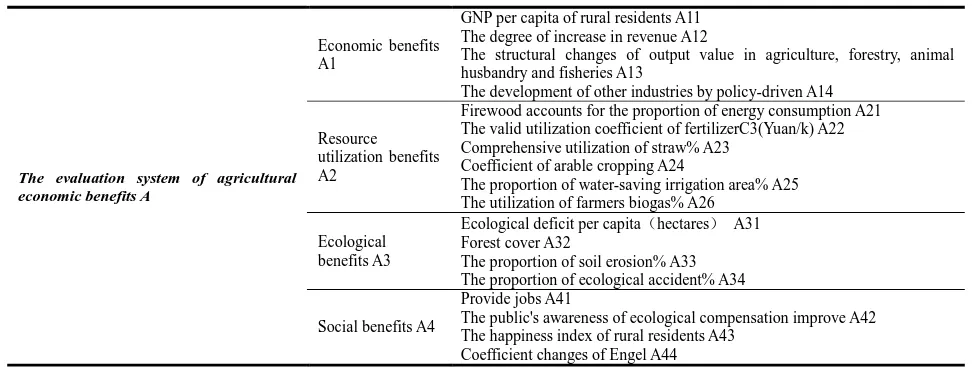
Table 1.The Analysis of Agricultural Benefits
The evaluation system of agricultural economic benefits A
Economic benefits A1
GNP per capita of rural residents A11 The degree of increase in revenue A12
The structural changes of output value in agriculture, forestry, animal husbandry and fisheries A13
The development of other industries by policy-driven A14
Resource utilization benefits A2
Firewood accounts for the proportion of energy consumption A21 The valid utilization coefficient of fertilizerC3(Yuan/k) A22 Comprehensive utilization of straw% A23
Coefficient of arable cropping A24
The proportion of water-saving irrigation area% A25 The utilization of farmers biogas% A26
Ecological benefits A3
Ecological deficit per capita(hectares) A31
Forest cover A32
The proportion of soil erosion% A33 The proportion of ecological accident% A34
Social benefits A4
Provide jobs A41
The public's awareness of ecological compensation improve A42 The happiness index of rural residents A43
Coefficient changes of Engel A44
effectiveness intuitive and quantitative. The analysis method of agricultural is shown in Table1.
∑
∑
= =
+
= 28
21 ) 2 ( 12
11 ) 1 (
i
i A i
i A
A E E
E
EA -Total benefits of agriculture, EA(1i)-The factor's value of the feature layer in the system of agricultural total
benefits, EA(2i)-The factor's value of index layer in the estimating system.
The benefits of agro-ecological compensation:P=EA(Later)-EA(Before)
3.2 Analytic Hierarchy Process
The indicators of performance evaluation are divided into multiple levels, by comparing the importance of these elements in all levels, make person's subjective judgments processed in the form of quantity, in order to calculate the weight coefficients of performance evaluation.
The construction of multi-index comprehensive evaluation model about green agro-ecological compensation including the selection of indicators, the calculation of indicators' weights and environmental performance. General steps are as follows:
Firstly, select and grade the various indicators which influence government environmental performance audit evaluation. According to the index, set at all levels of evaluation factors(F) and evaluation grades(V).The first grade indicators which are selected are three, respectively denoted by F1,F2,F3,these indicators constitute a finite set of evaluation factors: F={F1,F2,F3}.F, including four indicators which are the second grade, the four indicators constitute a set of evaluation factors:F1=={F12,F12,F13,F14},empathy, it can build a set of finite collection F2 and F3.According to actual situation, it is necessary to set four review grades, that are: good, better, in general, poor. The set of evaluation factors and review factors are: F={function indicators, benefit indicators, potential indicators },V={good, better, in general, poor}
Secondly, make a comprehensive analysis the indicators which influence the government's environmental performance evaluation, give them scores by comparing the evaluation criteria and establish the weight of each index (W).
In the system of multi-index comprehensive evaluation, to establish the index weight is a fundamental step, this value influence the results directly, the changes of weights may cause the orders changed. Therefore, establish the index weights scientifically are rather important in the system of multi-index evaluation.
The Analytic Hierarchy Process divides the targets into several levels and a number of indicators, according to different weights to evaluate comprehensively. Using AHP to establish weights need the following five steps: build a hierarchical model, construct a judgment matrix, single-level sorting, hierarchical sorting and consistency check.
Thirdly, get a fuzzy evaluation matrix R through the methods of expert scoring, take the indicators that are settled in the situation of "environment enforcing law" as example, according to the expert survey, the evaluation results of "agricultural environment enforcing law"are:15% people think that “very good",28% people think that"good",47% people think that"general",10%people think that"poor".So the evaluation matrix Ri ={0.15,0.28,0.47,0.10}.It is a subset of R,empathy,it also can receive other evaluation matrix with other factors, furthermore, receive a fuzzy evaluation matrix R:
Rl=〔0.15,0.28,0.47,0.10〕,R2=〔…,…,…,…〕,…,Rn
⋅⋅
⋅
=
n
R
R
R
R
21
______________________________________________________________________________
3.3The method of expert score
Expert scoring method is a qualitative description of the quantities method. Firstly, it selects several evaluation objects according to the specific requirements, secondly, it develops evaluation criteria according to evaluation projects, then, it employs several experts to give some scores by virtue of their experience, finally, it assembles these results. This method is not only used in the field of predicting, but also can widely use in the determination process of setting all systems of indicators and specific targets.
The method of expert scoring has the following advantages: 1.Intuitive, each level of standard reflected by scoring.2.Calculation method is simple and there are a lot of spaces to choose.3.Consider adequately. It concludes all evaluation projects that can be quantitative and cannot be quantitative.
3.3.1. The type of addition evaluation
Make the scores that comes from the evaluation results plus and obtain the sum, using it to evaluate the evaluation results. This method could be applied in the simple indexes that the relationship is simple.
The formula is:
∑
=
=
n ii
W
W
1
[image:4.595.194.419.332.408.2]W—the total scores of evaluation objects; Wi—The score of the i-th index; n—The number of indicators. There are two ways of this method: plus scores and sub-meter addition. such as table2 and Table 2.
Table 2. The Even Add Point rating Method
Evaluation of projects
Rating Standard
scores
Feasible program scores
Ⅰ Ⅱ Ⅲ Ⅳ
A 40 40 35 30 40 B 30 25 30 30 30 C 20 15 15 10 15 D 10 5 10 5 10 Total scores 100 85 90 75 95
Table 3 .The Points Plan Addition Evaluation Method
Rating the project Grades
Rating
Standard scores Scores of feasible program
Ⅰ Ⅱ Ⅲ Ⅳ
A
1 40 40 40 40
2 30 30
3 20 4 10
B
1 30 30 30
2 20 20 20
3 10
C
1 20 20 20
2 15 15
3 10 10
D 1 10 10 10
2 5 5 5
Total scores 100-35 85 90 75 95
3.3.2.The evaluation type of continuous product
Multiply the scores that in all items, and reflect the performance results according to the size of its product.
The formula is:
∏
=
=
n ii
W
W
1
W-the total scores of evaluation object; Wi-the score value of the i-th project; n-the number of index projects.
3.3.3. The evaluation type of several multiply
[image:4.595.168.443.439.589.2]The formula is:
∏
∑
= =
=
mi n
j ij
W
W
1 1
Wij-the index value of the the i-th group the j-th indicator; m-the groups of evaluation objects; n-the number of indicators which are contained in the i-th group.
3.3.4.The type of weighted evaluation
Give each indicator different weights according to the degree of importance, that is, treat them differently.
∑
=
=
n ii i
W
A
W
1
W-the total scores of the evaluation objects;Wi-the scores of the i-th indicator;Ai-i is the weights of the indicators.
And:
1
1
=
∑
=
n
i i
A
;0<Ai≤1.3.3.5. The coefficient method of efficacy
This is a method which can convert multi-objectives into single objective, the evaluators give different efficacy coefficients, so the total efficiency coefficient d is:
dj = 1 represents the j-th target is best; dj = 0 represents the j-th target is worst; 0≤dj≤0.3 is unacceptable range; 0.3<dj≤0.4 is the edge of range; 0.4<dj≤0.7 is sub-optimal range; 0.7<dj≤1 is the optimal range;
4.Performance evaluation of green agro-ecological compensation based on AHP 4.1 Establish a hierarchical structure
The system of performance evaluation which is built before is a hierarchical structure, it consists of three levels of target layer, rule layer and sub-criteria layer. The first level is the overall goal. The second level includes indicators of functions, indicators of benefits, indicators of potential; The third level contains a total of 39 specific evaluation.
4.2 Construct the judgment matrix
When a factor C of the previous level as the comparison criteria, aij can be used as a scale to express the relative awareness of the importance of the next level between the i-th factor and the j-th factor. The value of aij is usually taken positive integer1-9 and their countdown. The matrix which is constructed by aij is called the judgment matrix A=(aij).The rules of valuing aij are shown in Table4.
Table 4. The Value Rules of aij
Elements Scale Rules
aij
1 Take a factor which is in above layer as criterion, i and j are same important 3 Take a factor which is in above layer as criterion, i than j slightly important 5 Take a factor which is in above layer as criterion, i than j obviously important 7 Take a factor which is in above layer as criterion, i than j strongly important 9 Take a factor which is in above layer as criterion,i than j extreme important 2,4,6,8 The compromise of the two adjacent judgments
The countdown of the above numbers If factor i compares j, the result is aij, then factor j compares i, the result is 1/aij.
The characteristics of the comparison judgment matrix:
1.aij>0, i , j =1, 2,…,n
______________________________________________________________________________
3.aii = 1, i , j =1, 2,…,n
According to the above analysis, take O as comparison criteria, all factors in hierarchical A compared with each other can reach the matrix O-A, similarly, take Bi as comparison criteria, all factors in hierarchical C compared with each other can reach the matrix Bi-C. Therefore, we can have the following nine comparison judgment matrix.
Table 5.O-A comparison judgment matrix
[image:6.595.228.382.159.511.2]O-A A1 A2 A3 A1 1 6 1/3 A2 1/6 1 1/5 A3 3 5 1
Table 6. A1-B comparison judgment matrix
A1-B B1 B2 B3 B4 B1 1 1/4 1/5 3 B2 4 1 1/3 1/4 B3 5 1/3 1 4 B4 1/3 4 1/4 1
Table 7. A2-B comparison judgment matrix
A2-B B5 B6 B7 B8 B5 1 3 4 1/3 B6 1/3 1 7 2 B7 1/4 1/7 1 1/7 B8 3 1/2 7 1
Table 8.A3-B comparison judgment matrix
[image:6.595.246.364.233.283.2]A3-B B9 B10 B9 1 1/2 B10 2 1
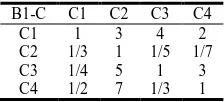
Table 9. B1-C comparison judgment matrix
B1-C C1 C2 C3 C4 C1 1 3 4 2 C2 1/3 1 1/5 1/7 C3 1/4 5 1 3 C4 1/2 7 1/3 1
Table 10.B2-C comparison judgment matrix
[image:6.595.250.362.445.496.2]B2-C C5 C6 C7 C8 C5 1 2 1/6 4 C6 1/2 1 1/2 1/3 C7 6 1/2 1 2 C8 1/4 3 1/2 1
Table 11.B3-C comparison judgment matrix
[image:6.595.248.363.522.575.2]B3-C C9 C10 C11 C12 C13 C9 1 5 1/2 1/3 3 C10 1/5 1 3 4 5 C11 2 1/3 1 1/2 1/3 C12 3 1/4 1/2 1 5 C13 1/3 1/3 3 1/5 1
Table 12.B4-C comparison judgment matrix
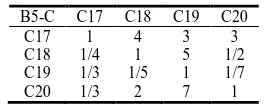
[image:6.595.233.380.600.659.2]Table 13.B5-C comparison judgment matrix
B5-C C17 C18 C19 C20 C17 1 4 3 3 C18 1/4 1 5 1/2 C19 1/3 1/5 1 1/7 C20 1/3 2 7 1
Table 14.B6-C comparison judgment matrix
[image:7.595.243.370.262.312.2]B6-C C21 C22 C23 C24 C25 C26 C21 1 2 2 5 2 3 C22 1/2 1 1/4 7 3 3 C23 1/2 1/2 1 2 1/5 1/2 C24 1/5 1/7 1/2 1 2 2 C25 1/2 1/3 5 1/2 1 3 C26 1/3 1/3 2 1/2 1/3 1
Table 15.B7-C comparison judgment matrix
[image:7.595.241.371.338.389.2]B7-C C27 C28 C29 C30 C27 1 3 2 4 C28 1/3 1 2 6 C29 1/2 2 1 1/3 C30 1/4 1/6 3 1
Table 16.B8-C comparison judgment matrix
[image:7.595.256.355.418.458.2]B8-C C31 C32 C33 C34 C31 1 9 5 1/3 C32 1/9 1 2 1/3 C33 1/5 3 1 1/6 C34 3 3 6 1
Table 17.B9-C comparison judgment matrix
B9-C C35 C36 C37 C35 1 5 2 C36 1/5 1 1/6 C37 1/2 6 1
Table 18.B10-C comparison judgment matrix
B10 C38 C39 C38 1 3 C39 1/3 1
4.3 Determine the single soring of level
The judgment matrix which is listed earlier is for the assessment data that in the above layer, the hierarchical single sorting is to sorting the orders all factors in this layer, it needs calculate based on the judgment matrix.
4.3.1 Calculate the product of element in each row of judgment matrix Mj
Mj =
∏
=
n
j ij
b
1(i = 1,2,…,n)
4.3.2 Calculate the n-the root of Mi:
W
i iW
= n iM
4.3.3 Normalized vector:
W
=[W
1,W
2,…,W
n]Ti
W
=∑
=
n
j i i
W
W
______________________________________________________________________________
W=[W1,W2,…,Wn]T are the eigenvectors that want to require.
4.3.4 Calculate the largest eigenvalue of judgment matrix:
λ
maxλ
max = 1(
)
n
i
i i
AW
nW
=
∑
4.4 Consistency test
In order to ensure the conclusions more reasonable, it needs to judge the consistence of matrix. Take consistency index as quantitative criteria for measuring the inconsistency degree.
CI =
max
1
n
n
λ
−
−
λ
max is the largest eigenvalue of judgment matrix.When the largest eigenvalue of judgment matrix is bigger than n, A has satisfactory agreement, its quantitative criteria is average and random indicators, that is, RI. The random consistency index of evaluation is shown in Table19.
Table 19. The Average Random Consistency Index
n 1 2 3 4 5 6 7 8 9
RI 0 0 0.58 0.94 1.12 1.24 1.32 1.41 1.45
In the Table 5,when n=1,2,RI=0,that's because the 1 and 2-order judgment matrix are always consistent.
When n≥3,make CR =
RI
CI
,that is the consistency proportion. When CR<0.1,it believes that the consistency of judgment matrix is acceptable, otherwise, it should make some amendments for the judgment matrix.
As to these comparison judgment matrix, by the above method, it could calculate the largest eigenvalue and its corresponding eigenvector, after normanizing these eigenvectors, we can obtain the weight vector that is relative important of the level of single sorted, the consistent index CI and the consistent proportion CR.
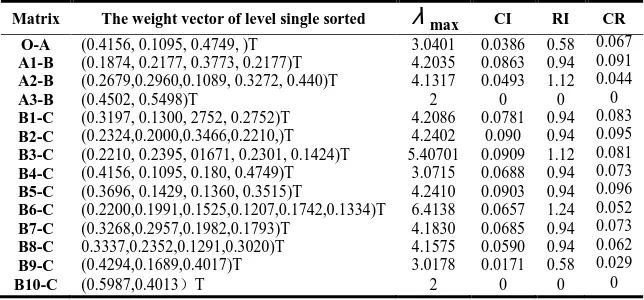
[image:8.595.145.467.530.680.2]The tested results of consistency are shown in Table20.
Table 20.The Results of Consistency Test
Matrix The weight vector of level single sorted
λ
max CI RI CR O-A (0.4156, 0.1095, 0.4749, )T 3.0401 0.0386 0.58 0.067A1-B (0.1874, 0.2177, 0.3773, 0.2177)T 4.2035 0.0863 0.94 0.091
A2-B (0.2679,0.2960,0.1089, 0.3272, 0.440)T 4.1317 0.0493 1.12 0.044
A3-B (0.4502, 0.5498)T 2 0 0 0
B1-C (0.3197, 0.1300, 2752, 0.2752)T 4.2086 0.0781 0.94 0.083
B2-C (0.2324,0.2000,0.3466,0.2210,)T 4.2402 0.090 0.94 0.095
B3-C (0.2210, 0.2395, 01671, 0.2301, 0.1424)T 5.40701 0.0909 1.12 0.081
B4-C (0.4156, 0.1095, 0.180, 0.4749)T 3.0715 0.0688 0.94 0.073
B5-C (0.3696, 0.1429, 0.1360, 0.3515)T 4.2410 0.0903 0.94 0.096
B6-C (0.2200,0.1991,0.1525,0.1207,0.1742,0.1334)T 6.4138 0.0657 1.24 0.052
B7-C (0.3268,0.2957,0.1982,0.1793)T 4.1830 0.0685 0.94 0.073
B8-C 0.3337,0.2352,0.1291,0.3020)T 4.1575 0.0590 0.94 0.062
B9-C (0.4294,0.1689,0.4017)T 3.0178 0.0171 0.58 0.029
B10-C (0.5987,0.4013)T 2 0 0 0
4.5 Establish the total sorting of the level
Using the calculation results of level single sorted, integrate the whole orders.
RESULTS AND DISCUSSION
compensation policy, also considers their relationships. It provides a good foundation for regional ecological compensation.
Acknowledgements
This paper is supported by two projects: The first is the Scientific research project of Hubei Provincial Education Department(Q20142903) ;The second is the Research base Project of humanities and social sciences of Hubei Province(2014000203)
REFERENCES
[1] Huiyan Li;Shurong Zhang.Academic J. RS, Reformation and Strategy.,2012,28(2),89-92.