University of New Orleans University of New Orleans
ScholarWorks@UNO
ScholarWorks@UNO
University of New Orleans Theses and
Dissertations Dissertations and Theses
Summer 8-9-2017
Machine Learning based Protein Sequence to (un)Structure
Machine Learning based Protein Sequence to (un)Structure
Mapping and Interaction Prediction
Mapping and Interaction Prediction
Sumaiya Iqbal
University of New Orleans, New Orleans, [email protected]
Follow this and additional works at: https://scholarworks.uno.edu/td
Part of the Artificial Intelligence and Robotics Commons, Biochemistry, Biophysics, and Structural Biology Commons, Bioinformatics Commons, Computational Biology Commons, Databases and Information Systems Commons, and the Numerical Analysis and Scientific Computing Commons
Recommended Citation Recommended Citation
Iqbal, Sumaiya, "Machine Learning based Protein Sequence to (un)Structure Mapping and Interaction Prediction" (2017). University of New Orleans Theses and Dissertations. 2379.
https://scholarworks.uno.edu/td/2379
This Dissertation is protected by copyright and/or related rights. It has been brought to you by ScholarWorks@UNO with permission from the rights-holder(s). You are free to use this Dissertation in any way that is permitted by the copyright and related rights legislation that applies to your use. For other uses you need to obtain permission from the rights-holder(s) directly, unless additional rights are indicated by a Creative Commons license in the record and/ or on the work itself.
Machine Learning based Protein Sequence to (un)Structure Mapping and
Interaction Prediction
A Dissertation
Submitted to the Graduate Faculty of the
University of New Orleans
in partial fulfillment of the
requirements for the degree of
Doctor of Philosophy
in
Engineering and Applied Science
Computer Science
by
Sumaiya Iqbal
B.Sc. Bangladesh University of Engineering and Technology, 2009
M.Sc. Bangladesh University of Engineering and Technology, 2012
II
III
Acknowledgements
First and foremost, I would like to thank my advisor Dr. Md Tamjidul Hoque for his great guidance and timely support over the past four years. I am greatly thankful that he would take me as a student, teach me the research methodology, guide me in choosing interesting and influential research topics, and encourage me when I am stuck. Besides, I thank Dr. Hoque for giving me the freedom to discover and explore new subjects in machine learning, scientific computing, and computational biology.
My other committee members, Christopher Summa, Shengru Tu, Wendy Schluchter and Huimin Chen, have also been very supportive. I thank all these amazingly helpful professors for their invaluable assistance, feedback, and patience at all stages of this thesis. Their criticisms, comments, and advice are critical in making this dissertation more accurate and complete. In particular, Christopher Summa has been a warm supporter on my endeavor in bioinformatics and computational biology, and a source of new problems and objective opinions from the non-machine-learning community.
I would also like to thank the University of New Orleans for providing me an excellent environment for research and the financial support. In addition, special thanks to my friends and colleagues at UNO with whom I have had the pleasure of working over the years. These include Md Nasrul Islam, Avdesh Mishra, Aisha Ali-Gombe, Denson Smith, Glenn Robert McLellan, and all the members of the Bioinformatics and Machine Learning group. Their friendship and their help have brought me incredible joy during my UNO days.
IV
Table of Contents
List of Figures ... x
List of Tables ... xiv
List of Abbreviations ... xvi
Abstract ... xix
Introduction ... 1
1.1 Thesis Overview ... 4
1.2.1 Statement of Research Problem ... 4
1.1.1 Contribution of The Thesis ... 6
1.2 Technical Results of the Thesis ... 7
1.2.1 An Optimized SVM for Protein Disorder Prediction ... 7
1.2.2 Extraction of Energy Scores from Protein Sequence ... 8
1.2.3 A Reinforced Regression for Accessible Surface Area Prediction ... 8
1.2.4 A Stacked Model for Peptide-Binding Residue Prediction ... 9
1.3 Thesis Organization ... 9
1.4 Related Publications ... 10
DisPredict: A Predictor of Disordered Protein ... 13
2.1 Background and Motivations ... 14
Intrinsically Disordered Proteins Types and Characteristics ... 16
Abundance of Protein Disorder ... 19
Protein Disorderedness and Functions ... 20
Role of in silico Disorder Prediction ... 21
2.2 Review of Disorder Prediction ... 22
2.2.1 Predictors based on Machine Learning ... 22
2.2.2 Predictors based on Physicochemical Properties ... 24
2.2.3 Predictors based on Meta-approach ... 24
V
2.3 Experimental Materials ... 26
2.3.1 Disorder Data Sources ... 26
2.3.2 Datasets ... 26
2.3.2.1 Training Sets ... 26
2.3.2.2 Test Sets ... 27
2.3.3 Input Features ... 28
2.3.3.1 Sequence Information... 28
2.3.3.2 Evolutionary Information ... 29
2.3.3.3 Structural Information ... 30
2.3.4 Performance Evaluation Criteria ... 30
2.4 DisPredict (version 1.0) ... 32
2.4.1 SVM Design and Parameterization ... 32
2.4.2 Implementation and Availability ... 34
2.5 Evaluation of DisPredict1.0 ... 34
2.5.1 10-Fold Cross Validation ... 34
2.5.1.1 Default parameters for SVM ... 34
2.5.1.2 Optimized Parameters for SVM ... 36
2.5.1.3 Probability and Performance Analysis of Residual Overlap for Residue and Chain Level Splitting of Dataset 38 2.5.2 Independent Training and Testing ... 39
2.5.3 Comparison with Other Predictors ... 41
2.5.4 Case Studies: Characteristic Region and Protein Function ... 43
2.5.4.1 UniProtKB – P41212 (ETV6_HUMAN) ... 44
2.5.4.2 UniProtKB – P01116 (RASK_HUMAN) ... 44
2.5.4.3 UniProtKB – P04637 (P53_HUMAN) ... 44
2.6 Result Analysis and Discussions with DisPredict1.0 ... 45
2.6.1 Distribution of Length Disordered Segments in the Datasets ... 46
2.6.2 Feature Correlation Plots and Insights into Possible Noise in the Dataset ... 47
2.6.3 Residual Composition of IDPs/IDRs and their Effect on Prediction ... 48
2.7 DisPredict (version 1.1) ... 50
2.7.1 Datasets ... 50
2.7.2 Predictor Framework ... 50
2.7.3 Evaluation of DisPredict1.1 ... 51
VI
2.7.3.2 Comparison with Other Existing Predictors ... 52
2.8 Summary and Conclusions ... 55
REGAd3p: A Predictor of Protein Accessible Surface Area ... 57
3.1 Background and Motivation ... 58
3.1.1 Role of in silico ASA Prediction ... 61
3.1.2 Review of ASA Prediction ... 62
3.1.3 Our Contributions ... 63
3.2 Materials for ASA Prediction ... 64
2.3.5 Datasets ... 64
2.3.6 Feature Set ... 64
2.3.7 Evaluation Measure ... 66
3.3 REGAd3p: Regularized Regression using Degree 3 Polynomial Kernel and Genetic Algorithm ... 66
3.3.1 Implementation and Availability ... 70
3.4 Evaluation of REGAd3p ... 70
3.4.1. Results of Secondary Structure Prediction ... 70
3.4.2. Result of Accessible Surface Area Prediction ... 71
3.4.2.1. Feature Plan Selection ... 71
3.4.2.2. Kernel Selection ... 72
3.4.2.3. Result of Final Model ... 73
3.4.3. Comparison of ASA Prediction with Existing Methods ... 74
3.4.4. Case Studies with Individual Proteins ... 74
3.5 ASA Prediction Analysis ... 76
3.5.1 Amino Acid Specific Analysis ... 76
3.5.2 Secondary Structure Specific Analysis ... 78
3.5.3 ASA Range Specific Analysis ... 78
3.6 Application of Predicted ASA in the Energy Function, 3DIGARS2.0 ... 79
3.6.1 Experimental Materials ... 80
3.6.1.1 The 3DIGARS Potential ... 80
3.6.1.2 Decoy Sets ... 80
3.6.2 The 3DIGARS2.0 Potential... 81
3.6.3 Performance of 3DIGARS2.0 ... 84
VII
PSEE: Position Specific Estimated Energy ... 87
4.1 Background and Motivations ... 88
4.1.1 Our Contributions ... 92
4.2 Extraction of PSEE from Sequence ... 92
4.2.1 Computation of Proportional Exposure (or Burial) ... 94
4.2.2 Determining Contact Radius (CR) ... 95
4.3 Performance of PSEE in Determining Structural Property ... 97
4.3.1 Ordered and Disordered Residues ... 98
4.3.2 Helix, Beta and Coil Residues ... 99
4.3.3 Hydrophobic and Hydrophilic Residues ... 101
4.4 DisPredict (version 2.0) ... 103
4.4.1 Datasets ... 103
4.4.1.1 Training Set ... 103
4.4.1.2 Test Set ... 103
4.4.2 Feature Set ... 104
4.4.3 Predictor Framework ... 105
3.3.2 Implementation and Availability ... 106
4.5 Evaluation of DisPredict2 ... 106
4.5.1 Performance Measures... 106
4.5.2 Comparison with Other Predictors ... 107
4.5.2.1 Comparison on DD73 Dataset ... 108
4.5.2.2 Comparison on CASP8 Dataset ... 109
4.5.2.3 Comparison on CASP9 Dataset ... 110
4.5.2.4 Comparison on CASP10 Dataset ... 112
4.5.3 Feature Correlation Plots with PSEE ... 113
4.5.4 Amyloidogenic region (AR) prediction by DisPredict2 ... 115
4.5.4.1 UniProtKB – P61769 (B2MG_HUMAN) ... 116
4.5.4.2 UniProtKB – P61626 (LYSC_HUMAN) ... 116
4.5.4.3 UniProtKB – P0DJI8 (SAA1_HUMAN) ... 116
4.5.4.4 UniProtKB – P0DJI9 (SAA2_HUMAN) ... 116
4.5.4.5 UniProtKB – P02766 (TTHY_HUMAN) ... 116
4.5.4.6 UniProtKB – P02743 (SAMP_HUMAN) ... 118
VIII
4.6 Discussion ... 118
PBRpredict: A Peptide-Binding Residue Predictor ... 120
5.1 Background and Motivation ... 122
5.1.1 Role of In Silico Techniques in Peptide-Binding Residue Prediction ... 122
5.1.2 Problem Definition ... 123
5.1.3 Literature Review ... 124
5.1.4 Our Contributions ... 125
5.2 Experimental Materials ... 126
5.2.1 Datasets ... 126
5.2.1.1 Peptide-Recognition Domains in the Dataset ... 127
5.2.1.2 Training Set ... 128
5.2.1.3 Test Set ... 128
5.2.2 Annotation of Peptide-Binding Residues and Regions ... 129
5.2.3 Feature based Sequence Representation ... 131
5.2.4 Evaluation Criteria ... 132
5.3 PBRpredict Framework ... 134
5.3.1 Learning Algorithms ... 134
5.3.2 Training and Test of Base Learners ... 136
5.3.3 Training and Test of Meta Learner ... 136
5.3.4 PBRpredict-Suite ... 137
5.3.5 Implementation and Availability ... 140
5.4 Results ... 140
5.4.1 Feature Selection ... 140
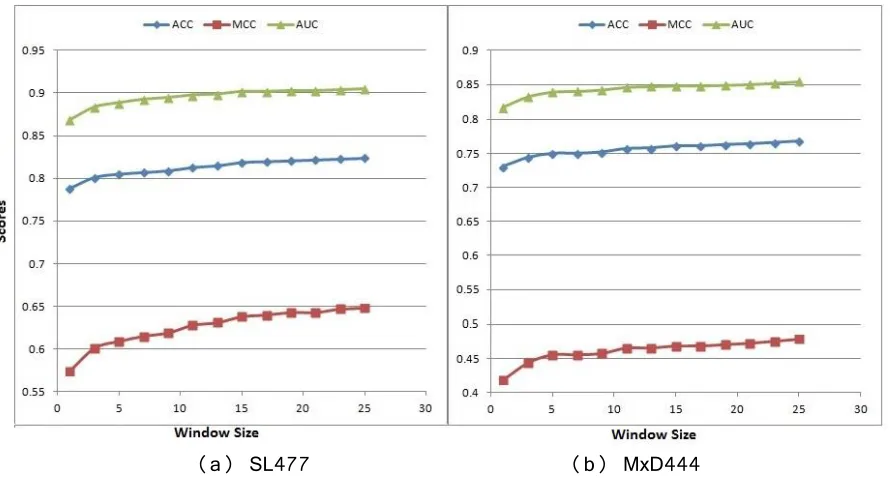
5.4.2 Window Selection ... 141
5.4.3 Performance Analysis of the Base Learners ... 142
5.4.3.1 Correlation Analysis of the Base-Learners ... 144
5.4.4 Parameter Selection for the Stacked Models ... 145
5.4.4.1 Selection of the Base-Level Learners ... 145
5.4.4.2 Combination of Features for Meta-Learner ... 147
5.4.5 Finalizing PBRpredict-Suite Models ... 148
5.4.5.1 Iterative Training of the Base-Learners ... 149
5.4.5.2 Tuning of Thresholds for the Learners ... 150
IX
5.4.7 Case-Studies on Sequence with Known Domains ... 159
5.4.7.1 PDZ Domain (PDB ID – 4NNM) ... 159
5.4.7.2 MHC Domain (PDB ID – 1DL9) ... 160
5.4.7.3 SH2 Domain (PDB ID – 2CIA) ... 161
5.4.7.4 Polo-Box Domain (PDB ID – 4LKL) ... 162
5.4.7.5 Tudor Domain (PDB ID – 3ASK) ... 163
5.4.7.6 14-3-3 Domain (PDB ID – 3MHR) ... 163
5.4.7.7 Bromodomain (PDB ID – 3JVK) ... 164
5.4.8 Case-Studies on sequences with Unknown Domains ... 165
5.4.8.1 MBT Domain ... 165
5.4.8.2 VHS Domain ... 166
5.4.8.3 CW Domain ... 167
5.4.9 Case-Studies with PBRpredict-Suite models on Full-length Sequence ... 168
5.4.9.1 GID4_YEAST (UniProtKB – P38263) ... 168
5.4.9.2 GID4_HUMAN (UniProtKB – Q8IVV7) ... 169
5.4.9.3 GID4_MOUSE (UniProtKB – Q9CPY6) ... 169
5.5 Position Specific Binding Energy (PSBE) ... 170
5.6 Summary and Conclusions ... 174
Conclusions ... 177
6.1 Summary ... 178
6.2 Future Scopes ... 181
6.3 Conclusions ... 183
Bibliography ... 184
X
List of Figures
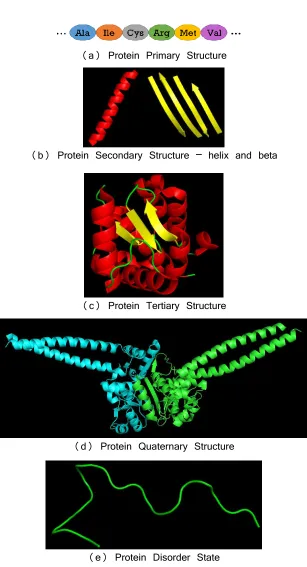
Fig 1. Different levels of protein structures and unstructured state ... 3
Fig 2. Intrinsically disordered proteins or regions in proteins ... 18
Fig 3. Two protein structurefunction paradigms, which emphasize the ordered state of a functional protein as well as consider three possible dynamic states occurred by intrinsic disorder phenomenon ... 19
Fig 4. Density distribution curves of monograms and bigrams for (a) SL477 and (b) MxD444 dataset .... 29
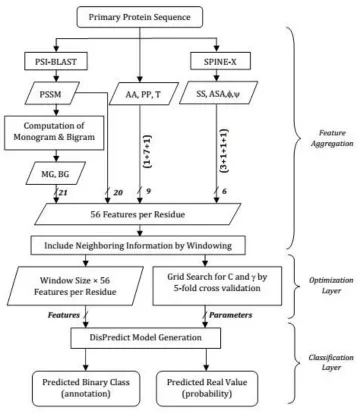
Fig 5. DisPredict Framework: feature aggregation, optimization-layer and classification-layer ... 33
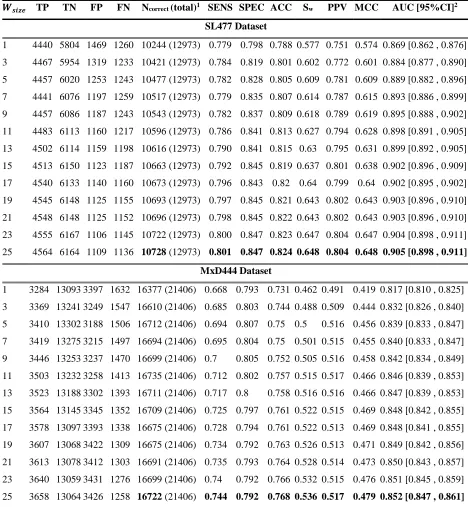
Fig 6. 10-fold cross-validation (default parameter) performance of DisPredict with different window sizes ... 36
Fig 7. ROC curves given by DisPredict on the training dataset (a) SL477 and (b) MxD444 dataset ... 40
Fig 8. (a) ROC and (b) precision-recall curves given by DisPredict (blue), SPINE-D (green) and MFDp (red) while predicting disorder on DD73 dataset ... 43
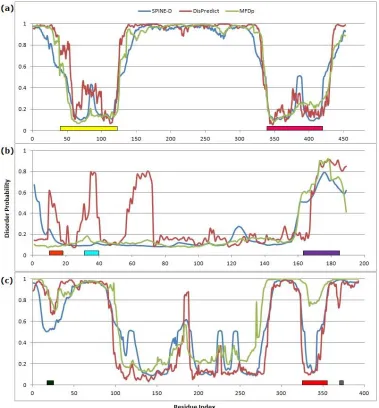
Fig 9. Disorder probability plot for (a) human ETV6 (P41212), (b) human KRAS (P01116) and (c) human p53 (P04637) proteins, given by DisPredict(red), SPINE-D (blue) and MFDp (green) ... 45
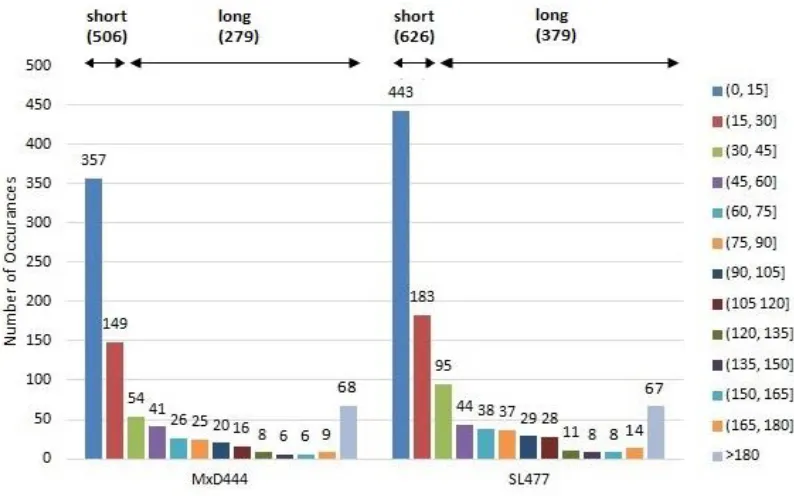
Fig 10. Distribution of disordered regions of different lengths in MxD444 (left) and SL477 (right) dataset. Legends are shown for different range of lengths (with interval size 15) and each bar is labeled with total number of occurrence of a disordered region of this specific length. ... 46
Fig 11. Correlation plot between structural characterizations of ordered (blue) and disordered (red) regions within (a) SL477 and (b) MxD444 dataset ... 47
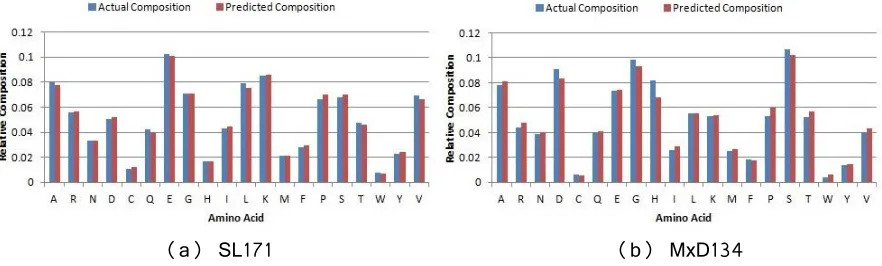
Fig 12. Percentage of amino acid type residues in actual composition (blue or left adjacent bar) and predicted composition (red or right adjacent bar) of (a) SL171 and (b) MxD134 dataset ... 49
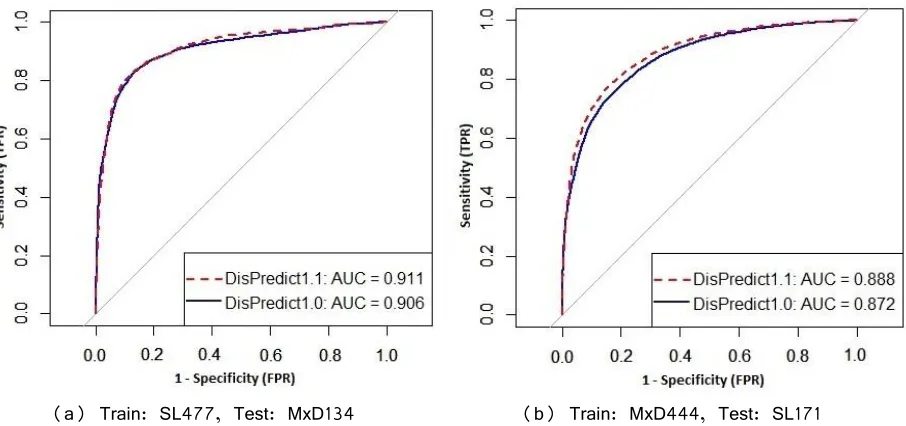
Fig 13. Comparison of ROC curves given by DisPredict1.0 and DisPredict1.1 ... 52
Fig 14. Accessible Surface Area (ASA) of Protein... 59
Fig 15. ASA-structure relationship of protein ... 60
Fig 16. Overview of REGAd3p real value accessible surface area prediction framework ... 69
Fig 17. Overall comparison of performance for different feature plans and kernel functions on SSD_TS298 dataset with GA optimization ... 73
Fig 18. Comparison between REGAd3p and SPINE-X [175] in absolute ASA prediction on SSD_TR1001 and SSD_TS298 dataset ... 74
Fig 19. ASA prediction comparison for individual proteins ... 75
XI
Fig 21. Correlation of predicted ASA and physical properties of different amino acid residues ... 77
Fig 22. ASA prediction performance of REGAd3p on different types of secondary structure residues of SSD_TS298 dataset ... 78
Fig 23. Variation of error in ASA prediction depending on the range of actual ASA values (dataset: SSD_TS298) ... 79
Fig 24. GA optimization result: generations versus fitness graph ... 83
Fig 25. Steps of computing 3DIGARS2.0 potential ... 84
Fig 26. The Energy funnel: a sample energy landscape through which the unfolded linear chain of amino acid residues (primary structure) gains the 3D native structure ... 89
Fig 27. Thermodynamics of protein folding process ... 91
Fig 28. 𝑃𝑆𝐸𝐸̅̅̅̅̅̅̅(𝑜), 𝑃𝑆𝐸𝐸̅̅̅̅̅̅̅(𝑑) and 𝑡(𝑃𝑆𝐸𝐸) for different contact (CR) values ... 96
Fig 29. Performance of ordered and disordered residue classification based on per residue PSEE value calculated using different contact radius (CR) values ... 97
Fig 30. Order versus disorder characterization of PSEE in residue and region level ... 98
Fig 31. PSEE of different length disordered regions and all ordered regions ... 99
Fig 32. Secondary structure residue type characterization by PSEE ... 100
Fig 33. Mean PSEE of hydrophobic and hydrophilic residues. PSEE for hydrophobic (green bar) and hydrophilic (red bar) residues of (a) DisProt680 dataset and (b) SSD dataset ... 101
Fig 34. Correlation between mean PSEE and hydrophobicity index of 20 amino acids ... 102
Fig 35. ROC and precision-recall curves given by 8 disorder predictors for DD73 dataset ... 109
Fig 36. ROC and precision-recall curves given by 8 disorder predictors for CASP8 dataset. Comparison of disorder predictors in terms of (a) ROC curve and (b) precision-recall curve on CASP8 dataset ... 110
Fig 37. ROC and precision-recall curves given by 8 disorder predictors for CASP9 dataset... 111
Fig 38. ROC and precision-recall curves given by 8 disorder predictors for CASP10 dataset... 113
Fig 39. Correlation between PSEE and relative exposure of ordered and disordered regions. PSEE and relative exposure of ordered regions are shown by blue circles and those of disordered regions are shown by red diamonds ... 114
Fig 40. Correlation between PSEE and coil probability of ordered and disordered regions ... 115
Fig 41. Disorder probability plots for proteins with amyloidogenic regions (ARs) given by DisPredict2 ... 117
Fig 42. Coarse-grained view of the underlying problem ... 123
Fig 43. Fine-grained view of the underlying problem ... 124
XII
Fig 45. Two-tier training and validation in stacking ... 137
Fig 46. The workflow of BIRpredict-Suite framework including BIRpredict-strict, BIRpredict-moderate and BIRpredict-flexible ... 139
Fig 47. Feature importance estimation by ET classifier in peptide-binding residue prediction ... 140
Fig 48. Performance comparison with different sliding window sizes for peptide-binding residue prediction using extra-tree classifier ... 142
Fig 49. Peptide-binding residue prediction performance of the base-learners ... 143
Fig 50. ROC and precision-recall curves given by 6 base-learners on peptide-binding residue prediction ... 144
Fig 51. ROC and precision-recall curves given by 4 different stacked models on peptide-binding residue prediction ... 147
Fig 52. Performance of the iterative training and testing of the base-learners: (a) SVM, (b) GBC and (c) KNN ... 150
Fig 53. Probability distributions of different prediction types given by (a) SVM, (b) GBC, (c) KNN and (d) LogReg using the threshold value 0.5 ... 151
Fig 54. The outputs of PBRpredict-Suite models on (a) the structure-specific and (b) the full-length sequence of the same protein ... 156
Fig 55. Performance Comparison of SPRINT and PBRpredict-Suite models in peptide-binding residue prediction, evaluated against synthetic annotation... 157
Fig 56. Performance Comparison of SPRINT and PBRpredict-Suite models in peptide-binding residue prediction, evaluated against actual annotation ... 158
Fig 57. Comparison of ROC curves and AUC values given by SPRINT and PBRpredict-Suite models on 146 chains ... 159
Fig 58. Case study on PDZ domain (PDB ID: 4NNM) ... 160
Fig 59. Case study with MHC molecule (PDB ID: 1DL9) ... 161
Fig 60. Case study with SH2 domain (PDB ID: 2CIA) ... 161
Fig 61. Case study with polo-box domain (PDB ID: 4LKL) ... 162
Fig 62. Case study with tudor domain (PDB ID: 3ASK) ... 163
Fig 63. Case study with 14-3-3 domain (PDB ID: 3MHR) ... 164
Fig 64. Case study with Bromodomain (PDB ID: 3JVK) ... 165
Fig 65. Performance of the PBRpredict-Suite models on MBT domains ... 166
Fig 66. Performance of the PBRpredict-Suite models on VHS domains... 167
Fig 67. Performance of the PBRpredict-Suite models on CW domains ... 167
XIII
XIV
List of Tables
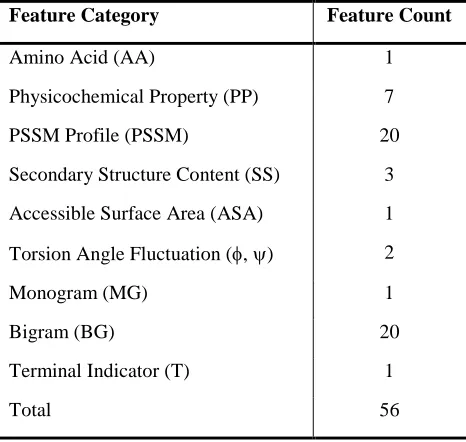
Table 1. List of features used in DisPredict. ... 28
Table 2. 10-fold Cross Validation Performance of DisPredict (Default Parameter). ... 35
Table 3. Optimized Parameters used to build final DisPredict Model. ... 37
Table 4. 10-fold Cross Validation Performance of DisPredict (Optimized Parameter). ... 38
Table 5. Cross-validation performance of DisPredict with residue level and sequence level splitting of SL477 dataset. ... 39
Table 6. Performance Comparison of Cross Validation and Independents Tests. ... 40
Table 7. Comparison of DisPredict with MFDp and SPINE-D respectively on MxD444 and SL477 dataset. ... 41
Table 8. Performance comparison among DisPredict, SPINE-D and MFDp on independent DD73 dataset. ... 42
Table 9. Performance comparison between DisPredict1.0 and DisPredict1.1. ... 51
Table 10. Performance comparison of DisPredict1.0 and DisPredict1.1 with 20 existing predictors when residues without actual annotation are assumed as ordered. ... 53
Table 11. Performance comparison of DisPredict1.0 and DisPredict1.1 with 20 existing predictors when residues without actual annotation are discarded. ... 54
Table 12: List of features used in secondary structure and ASA prediction according to different feature plans. ... 66
Table 13. Performance of secondary structure prediction by four classifiers on SSD_TS298 dataset. ... 71
Table 14. Prediction quality of ASA for different feature plans with 1st order polynomial as kernel. ... 72
Table 15. Prediction accuracy of ASA due to the extension of kernel function from linear to higher order polynomial (Feature-Plan # 2). ... 72
Table 16. Performance of secondary structure prediction and ASA prediction by REGAd3p for Moulder, Rosetta and I-Tasser datasets. ... 81
Table 17. Comparison between DFIRE, RWplus, dDFIRE, GOAP, 3DIGARS and 3DIGARS2.0 based on correct selection of native from their decoy-set and z-score. ... 85
Table 18. Predicted pairwise contact energy matrix derived in [149]. ... 93
Table 19. ASA normalization values for 20 amino acids in Å𝟐, proposed in [309]. ... 95
Table 20. Name and definition of performance measuring parameters. ... 107
XV
Table 22. Disorder prediction performances of 8 disorder predictors based on CASP8 dataset. ... 109
Table 23. Disorder prediction performances of 8 disorder predictors based on CASP9 dataset. ... 111
Table 24. Disorder prediction performances of 8 disorder predictors based on CASP10 dataset. ... 112
Table 25. Name and count of the peptide-recognition domains included in the datasets. ... 129
Table 26. Name and definition of performance measures to evaluate peptide-binding residue prediction. ... 133
Table 27. Performance comparison of different feature sets (training set: rcp_tr475 and test set: rcp_ts169). ... 141
Table 28. Correlation of probability distribution generated by six base-learners on rcp_ts169 dataset. .. 145
Table 29. Comparison of different stacked models in peptide-binding residue prediction on rcp_ts169 dataset. ... 146
Table 30. Comparison of stacked model (sM4) with two different feature plans for meta-learner on rcp_ts169 test set. ... 148
Table 31. Cross-validation performance of SVM, GBC and KNN using 8 different thresholds on the training dataset (rcp_tr475). ... 153
Table 32. Comparison of SVM, GBC and KNN using different thresholds (statistically derived) on rcp_ts169 dataset. ... 154
XVI
List of Abbreviations
3DIGARS 3-Dimentional Ideal Gas Reference State based energy function AA Amino Acid
ACC Balanced Accuracy AR Amyloidogenic Region ASA Accessible Surface Area AUC/AUROC Area Under the Curve
BG, MG Bigram, Monogram
BLAST Basic Local Alignment Search Tool BRCT BRCA1 C Terminus
CASP Critical Assessment of Protein Structure Prediction CC Correlation Coefficient
Chromo Chromatin organization modifier CR Contact Radius
CV Cross Validation DD Disorder Dataset DisPredict Disorder Predictor
DisProt Database of Protein Disorder
DNA/RNA Deoxyribonucleic Acid/Ribonucleic Acid DNN Deep Neural Network
DSSP Dictionary of Protein Secondary Structure ELM Eukaryotic Linear Motif
ET Extremely randomized Tree
FASTA Standard format of protein and nucleic acid sequence FDT Frequency Distribution Table
FHA Fork Head Associated GA Genetic Algorithm
XVII
IDEAL Intrinsically Disordered Proteins with Extensive Annotations and Literature
IDP/IDR Intrinsically Disordered Protein/ Intrinsically Disordered Regions in protein
KNN K Nearest Neighbor classifier LogReg Logistic Regression
MAE Mean Absolute Error MBT Malignant Brain Tumor
MCC Mathews Correlation Coefficient MHC Major Histocompatibility Complex
MxD Mixed Disorder
NCBI National Center for Biotechnology Information NMR Nuclear magnetic Resonance
NR Database Non-Redundant database
PBRpredict Peptide-Binding Residue predictor PCC Persons Correlation Coefficient PDB Protein Data Bank
PID Protein Interaction Domain
PP Physical or Physicochemical Properties PPI Protein-Protein Interaction
PPV Precision PR Precision-Recall
PRD Peptide-Recognition Domain PSBE Position Specific Binding Energy PSEE Position Specific Estimated Energy PSI-BLAST Position Specific Iterated BLAST
PSSM Position Specific Scoring Matrix PTB Phospho-Tyrosine Binding PTM Post-Translational Modification
RBF Radial basis Function
XVIII
REGAd3p Regularized Exact regression with degree 3 polynomial as kernel
and Genetic Algorithm
ROC Receiver Operating Characteristics RSA Relative Accessible Surface Area SH2, SH3 Src Homology 2, 3
SL Short and Long sM Stacked Model
SS Secondary Structure
SSD Secondary Structure Dataset STDEV/std Standard Deviation
XIX
Abstract
Proteins are the fundamental macromolecules within a cell
that carry out most of the biological
functions. The computational study of protein structure and its functions, using
machine learning
and data analytics, is elemental in advancing the life-science research due to the fast-growing
biological data and the extensive complexities involved in their analyses towards discovering
meaningful insights.
Mapping of protein’s primary sequence is not only limited to its structure, we
extend that to its disordered component known as Intrinsically Disordered Proteins or Regions in
proteins (IDPs/IDRs), and hence the involved dynamics, which help us explain complex
interaction within a cell that is otherwise obscured. The objective of this dissertation is to develop
machine learning based effective tools to predict disordered protein, its properties and dynamics,
and interaction paradigm by systematically mining and analyzing large-scale biological data.
In this dissertation,
we propose a robust framework to predict disordered proteins given
only sequence information, using an optimized SVM with RBF kernel. Through appropriate
reasoning, we highlight the structure-like behavior of IDPs in disease-associated complexes.
Further, we develop a fast and effective predictor of Accessible Surface Area (ASA) of protein
residues, a useful structural property that defines protein’s exposure to partners, using regularized
regression with 3
rd-degree polynomial kernel function and genetic algorithm. As a key outcome of
this research, we then introduce a novel method to extract position specific energy (PSEE) of
protein residues by modeling the pairwise thermodynamic interactions and hydrophobic effect.
PSEE is found to be an effective feature in identifying the enthalpy-gain of the folded state of a
protein and otherwise the neutral state of the unstructured proteins. Moreover, we study the
peptide-protein transient interactions that involve the induced folding of short peptides through
disorder-to-order conformational changes to bind to an appropriate partner. A suite of predictors
is developed to identify the residue-patterns of Peptide-Recognition Domains from protein
sequence that can recognize and bind to the peptide-motifs and phospho-peptides with
post-translational-modifications (PTMs) of amino acid, responsible for critical human diseases, using
the stacked generalization ensemble technique. The involved biologically relevant case-studies
demonstrate possibilities of discovering new knowledge using the developed tools.
1
Chapter 1
Introduction
Proteins, made up of smaller units called amino acids, are the fundamental macromolecules within a cell that carry out most of the biological functions and regulations according to the information encoded in the genes. Proteins are responsible for nearly every task of cellular life, including cell shape and inner organization, product manufacturing, waste cleanup, and routine maintenance. Proteins also receive signals from outside the cell and mobilize an intracellular response. They are the workhorse molecules of the cell and perform diverse set of functionalities. Proteins act as enzymes that carry out almost all of the chemical reactions that take place in cells as well as assist with the formation of new molecules by reading the genetic information stored in deoxyribonucleic acid (DNA). Moreover, they may bind to specific foreign particles, such as viruses and bacteria to help protect the body as antibodies. Proteins may serve as hormones, which transmit signals to coordinate biological processes between different cells, tissues, and organs, and as transcription factors that guide the differentiation of the cell and its responses to signals, and participate in the formation of tissues and muscular fiber.
2
sequence to its structure, but also identifies the disordered (or unstructured) component, which helps explain complex interaction within a cell that was otherwise obscured.
Proteins are often described as the building block of smaller substructures in a hierarchical manner. Based on the various level of conformational complexities, the proteins are defined in four different levels:
(1) Primary structure: It is the simplest level of protein structure and is the linear sequence of amino acid residues in a polypeptide chain. The sequence of a protein is encoded by the base-pair pattern of the gene of a DNA. A single nucleotide change in the DNA sequence may lead to a change in the amino acid sequence of the protein, and subsequently may alter the structure and function of the corresponding protein.
(2) Secondary structure: The local conformation of protein structures is determined by the pattern of hydrogen bonds in the biopolymer. There are three types of major secondary structures, known as alpha-helix, beta-pleated sheet sand coils (or loops), having different pattern of hydrogen bond between carbonyl and amino groups.
(3) Tertiary structure: This is the overall three-dimensional structure of a polypeptide. The formation is primarily due to the interactions between the side chains (known as R groups) of the amino acids that make up the protein. Side chain interactions that contribute to tertiary structure include hydrogen bonding, ionic bonding, dipole-dipole interactions, and van der Walls forces. Moreover, a net force that determines the core of the 3D structure is the hydrophobic effect by which hydrophobic R groups cluster together on the inside of the protein, leaving hydrophilic amino acids on the outside to interact with surrounding water (solvent) molecules.
(4) Quaternary structure: It is made up of multiple polypeptide chains, formed as a result of hydrogen bonds between multiple proteins as subunits. The interaction between multiple chains in a complex is the primary determinant of the signal transmission and reception within a cell.
3
(a) Protein Primary Structure
(b) Protein Secondary Structure – helix and beta
(c) Protein Tertiary Structure
(d) Protein Quaternary Structure
(e) Protein Disorder State
Fig 1. Different levels of protein structures and unstructured state. (a) Primary structure, linear sequence
4
In this thesis, we focus on predicting different structural properties of protein residues from protein sequence alone via machine learning approaches, ranging from protein disorder prediction and protein accessible surface area prediction to identification of binding regions in proteins that interact with other proteins (specifically, short peptides) in a complex. Another major contribution of this thesis is to extract energy-like quantities from protein sequence anole that can characterize the structural stability of protein residue, hence can serve as critical feature for protein structure and interaction prediction.
1.1 Thesis Overview
With the exponential growth of proteomic data and the enormous complexities involved in their modeling, bioinformatics becomes essential for the management and mining of biological data in modern biology, medicine and drug discovery. Development of computational tools demands expertise from several core dimensions of computer science discipline, such as i) Data Science in data collection, mining and preparation, ii) Scientific Computing to extract useful knowledge from large sets of data and mathematically quantify the knowledge as characteristics features, iii) Machine Learning to develop of novel algorithms to model the data using features, and iv) Statistical and Probabilistic Analysis to empirically evaluate the model by comparative analysis and visualize the outputs. Over the course of this thesis, we have developed and implemented several tools to predict structural properties of proteins from its sequence using the above-listed areas of expertise.
1.2.1
Statement of Research Problem
5
effective computational methods for correct identification of disordered residues in IDPs or, IDRs become indispensable.
It is found that the primary protein sequence alone has the essential information needed to determine its corresponding secondary and tertiary structures [3]. Therefore, the three-dimensional structures for proteins can be determined by their one-dimensional sequence of amino acid residues, called ab initio protein structure prediction, which is challenging as it requires an efficient sampling algorithm to search in astronomically large conformational space and an accurate energy function to rank the protein structures and guide the conformational search. Thus, development of energy functions and search algorithms are highly demanding in the research area of proteomics.
The thermodynamic hypothesis of Anfinsen [3] explains that a protein in its natively stable structure, gains the lowest free energy. The structural stability of proteins requires large number of inter-residual interactions that contributes to gain in energy, required for protein folding. Therefore, a structured protein usually stay in a favorable (negative) energy state, while an unstable protein cannot gain favorable energy. While most of the available energy functions are based on the structural information, extraction of energy score from sequence only will have higher implication as it will be a useful feature in sequence-based structure prediction.
Both the protein structure prediction and structural state (order or, disorder) identification problems are highly complex but crucial, thus it is essential to use the outputs of many smaller sub-problems to solve the ultimate big problems. A feature that can map one dimensional sequence information into three-dimensional information and guide a machine learning algorithm to learn about the states to be predicted is crucial in developing predictive tools for this research problem. These smaller sub-problems include secondary (SS) prediction, Accessible Surface Area (ASA) prediction, backbone torsion angle ( and ) prediction, and residue exposure. An accurate prediction of these structure properties from protein sequence alone has wide application in the field of bioinformatics and computational biology.
6
disease and drug discovery, offer an essential research dimension in the study of recent bioinformatics and computational biology.
1.1.1
Contribution of The Thesis
Given a primary sequence of protein as input, prediction of structural descriptors or properties of protein, such as its secondary structure, tertiary structure, accessible surface area, torsion angles and flexibilities, thermal factor, contact map, and state of interaction-energy using computational methods, has further implications in the study of the proteins’ functions. The computational tools can recognize patterns within inscrutable datasets, and can generate predictive-solutions fast for these challenging problems with reasonable accuracy, thus became an emerging research area in bioinformatics. Problems in computational and systems biology further vary from understanding sequence data to the analysis of protein shapes and protein classification to well-segregate and better understand their functions.
For some problems, the need of these computational efforts are essential. For instance, to understand the functions of proteins that are Intrinsically Disordered Proteins (IDPs) or have Disordered Regions (IDRs) a computational model can help capture the dynamics which would otherwise unmanageable to surmise. IDPs/IDRs do not adopt well-defined structure; however, they can change their states and fold through binding, and can perform important biological functions. Therefore, experimental investigation of IDPs/IDRs can reveal little information about their possible structures and functionalities. On the other hand, computational tools can provide a supplementary way for large-scale IDPs/IDRs analysis. Besides, the ultimate goal in the description of a protein is essentially to determine its structural properties as well as to determine the state of interactions with other proteins to perform function within a complex cellular network of living cell.
7
We started our work on the above-mentioned research problems from a hypothesis, which was then evolved through theoretical modeling and logical analysis, and eventually proven effective by empirical modeling and simulations. Therefore, the research methodologies described in this thesis is a fusion of theory, model and method development, evaluations and useful applications of the developed methods. Further, the tools developed under this dissertation-works are established as standalone software and has been published online to be utilized by broader scientific community.
1.2 Technical Results of the Thesis
1.2.1
An Optimized SVM for Protein Disorder Prediction
We have developed a framework to predict intrinsically disordered proteins (IDPs), DisPredict [9-11]. In this research, we performed large scale proteomic data collection, purification and analysis from multiple sources such as PDB, DisProt and IDEAL. To develop the predictors, we exercised machine learning algorithms, such as Support Vector Machine (SVM) with Radial Basis Function (RBF) kernel and Deep Neural network (DNN). The final SVM-based predictor was optimized, specifically the cost of SVM and the mode of RBF, using grid search. Such optimized parameter set made the predictor competitive. Moreover, we used three new features, Monogram and Bigram, giving high-dimensional evolutionary profile in DisPredict to predict disorder for the first time.
We developed a residue-wise potential score (PSEE) that can be computed from protein sequence alone and can be utilized for structure prediction from sequence. Towards an application of IDPs/IDRs prediction using the PSEE feature, we developed DisPredict2 [12] using RBF kernel SVM, in which we included PSEE in the feature space and optimized the threshold to segregate the disordered and ordered residues. DisPredict2 performed very well in comparison to several other state-of-the-art predictors. Both DisPredict and DisPredict2 are implemented as a standalone tool in C, and are freely available from GitHub repositories1,2 and Bioinformatics and Machine Learning (BML) lab website3 of Computer Science
department, UNO.
1 DisPredict 1.0: https://github.com/tamjidul/DisPredict_v1.0 2 https://github.com/tamjidul/DisPredict2_PSEE
8
1.2.2
Extraction of Energy Scores from Protein Sequence
Computational tools for existing protein structure prediction problems require features that can capture the complexity of molecular level interactions. With a view to doing this, I proposed a novel approach to quantify position specific estimated energy (PSEE) [11, 13] of a residue using the pairwise thermodynamic interaction energy and solvent accessibility of the residue in local neighborhood. Here, the pairwise interaction captures the sequential environment, whereas the predicted solvent accessibility, which is eventually used to compute relative burial of a residue, includes the hydrophobic effect and captures the respective structural environment in PSEE. It has been verified empirically that PSEE can effectively classify disorder versus ordered residues, can segregate different secondary structure type residues by computing the constituent energies, and the PSEE value for each amino acid strongly correlates with the hydrophobicity value of the corresponding amino acid.
We have further utilized PSEE to compute residue-wise binding energy, position specific binding energy (PSBE) [14] from sequence alone. We performed alanine scanning on protein scanning to recomputed PSEE and the induced gap is formulated as PSBE. The PSBE was found effective in identifying the amino acid residues that gives higher contribution in binding energy.
1.2.3
A Reinforced Regression for Accessible Surface Area Prediction
We have developed a predictor of accessible surface area (ASA) of protein residues as real value. In this research work, we developed a new predictor paradigm, namely REGAd3p [15], for real value prediction through Regularized Exact regression and Genetic Algorithm (GA). GA was used to optimize both Mean Absolute Error (MAE) and Pearson Correlation Coefficient (PCC). Further, the kernel of the exact regression was extended to degree 3 polynomial as this kernel was found to be the best to predict ASA while testing with large datasets collected from PDB. However, the framework is general for any real-value prediction work and the kernel can easily be tuned for a particular application. The predictor is developed in C programming language and it is available online4.
Further, we have applied my tool in several other applications of bioinformatics. I modeled the error between actual and predicted ASA in terms of Energy to discriminate native proteins from their decoys. We combined this ASA based energy linearly with the components of an existing energy function, 3DIGARS [16], using Genetic Algorithm to develop two improved versions subsequently, 3DIGARS2.0
9
[17] and 3DIGARS3.0 [18]. I have further utilized my own ASA predictor to quantify the relative exposure (or burial) component in PSEE.
1.2.4
A Stacked Model for Peptide-Binding Residue Prediction
We have proposed a new computational tool to predict peptide-binding residues of receptor proteins in peptide-protein complex from sequence alone, named PBRpredict. A set of protein complexes with wide range of peptide-binding domains, such as MHC I and II, PDZ, SH2, SH3, WW, 14-3-3, Chromo and Bromo, Polo-Box, PTB, enzyme inhibitor, were collected from PDB and were annotated with interaction information based on atomic distances from peptide residues in the structure. Using a comprehensive set of sequence-based features including chemical and evolutionary profile, secondary structure, surface area and local backbone profile, flexibility and an energy based profile, we guide our predictor to learn about peptide-binding residues using model-stacking approach. To develop the model, we explored six different machine-learning algorithms as base learners, and those are support vector machine, gradient boosting, bagging, random forest, extra tree and k-nearest neighbor classifier. The outputs of the base learners were aggregated using a meta-learner, logistic regression (classifier).
We carried-out a rigorous performance evaluation using statistical metrics and case studies. After careful analysis of the prediction performance, we tuned the classification thresholds of the base-level and the meta-level learners of the stacking approach to trade-off between the true positive rate and false positive rate. Finally, we established three different PBRpredict models of a similar framework that apply different thresholds for segregating binding and non-binding residue under the name PBRpredict-Suite5. The results
manifest that PBRpredict-Suite models provide well-balanced and biologically relevant outputs for proteins of different lengths and with a wide variety of PRDs. As an important outcome, one of the models recognized potential peptide-binding sites in the Gid4 subunit of the ubiquitin ligase GID in the yeast Saccharomyces cerevisiae for which no structure is available to date.
1.3 Thesis Organization
In this thesis, our primary goal is to develop in silico tools that can map protein sequence to its structural properties using machine learning algorithms. In addition, we target at extracting new biological knowledge
10
that can serve as features to best capture the properties of protein structures so that we can contribute both computationally and biologically. Following this guideline, we organize the rest of the thesis as follows:
In Chapter 2, we describe the design and development of DisPredict, a predictor of intrinsically disordered protein. The framework is based on an optimized SVM with RBF kernel. In addition to the development of the predictor, we executed an analysis of the structural features of experimentally annotated disordered and ordered regions of proteins using feature correlation plot. We have also discussed that a post-processing of probabilities can further improve the prediction accuracy of the predictor.
In Chapter 3, we develop a general framework for real-value prediction using regularized exact regression with degree 3 polynomial as kernel, which is further optimized using genetic algorithm, named REGAd3p and tuned specifically for protein accessible surface area (ASA) prediction. The framework is
rigorously evaluated, compared and analyzed. Moreover, we modeled the actual and predicted ASA to develop an energy component, which is integrated in an existing energy function and found effective in improving the performance of the energy function.
In Chapter 4, we describe the formulation of a novel score, position specific estimated energy (PSEE), extracted from protein sequence information only. Computation of PSEE utilizes our previously developed tool, REGAd3p to compute ASA from sequence. Further, we included contact energy in the computation of
PSEE. PSEE is applied as an important feature application for disorder prediction and to develop an improved version of DisPredict, called DisPredcit2. DisPredcit2 is also described and evaluated in the same chapter.
In Chapter 5, we study the complex induced-binding between modular proteins and short peptide-motifs. Specifically, we develop a set of tools to predict the peptide-binding regions of proteins with peptide-recognition domains. The tools are found to be effective for a wide range of peptide-binding domains, which is evaluated through case studies. On the other hand, in this chapter, we have described the extraction of position specific binding energy (PSBE) from protein sequence that can approximate the higher binding energy contribution of peptide hot spots.
In Chapter 6, we conclude the thesis work, state its major contributions and provide brief future directions.
1.4 Related Publications
11 Related publications of Chapter 2:
• Sumaiya Iqbal and Md Tamjidul Hoque. DisPredict: A Predictor of Disordered Protein using Optimized RBF Kernel. PLoS One, 2015, 10(10), e0141551, DOI: 10. 1371/ journal. pone. 0141551.
• Sumaiya Iqbal, Denson Smith, Avdesh Mishra, Md Nasrul Islam, Md Tamjidul Hoque. Disordered Protein Prediction by Spiders. CASP11 proceedings, 2014, pp. 215–216.
• Sumaiya Iqbal, Md Nasrul Islam, Md Tamjidul Hoque. Improved Protein Disorder Predictor by Smoothing Output. IEEE Conference on Computer & Information Technology (ICCIT), 2014, pp. 110–115, DOI: 10.1109/ICCITechn.2014.7073113, Dhaka, Bangladesh.
Related publications of Chapter 3:
• Sumaiya Iqbal, Avdesh Mishra and Md Tamjidul Hoque. Improved Prediction of Accessible Surface Area Results in Efficient Energy Function Application. Journal of Theoretical Biology, 2015, 380, pp. 380–391, DOI: 10.1016/j.jtbi.2015.06.012.
• Avdesh Mishra, Sumaiya Iqbal and Md Tamjidul Hoque. Discriminate Protein Decoys from Native by using a Scoring Function based on Ubiquitous Phi and Psi Angles Computed for All Atom. Journal of Theoretical Biology, 2016, 398, pp. 112–121, DOI: 10.1016/j.jtbi.2016.03.029. • Avdesh Mishra, Sumaiya Iqbal and Md Tamjidul Hoque. An eclectic energy function to
discriminate native from decoys. The 4th Annual LA Conference on Computational Biology and Bioinformatics, 2016, New Orleans, LA.
Related publications of Chapter 4:
• Sumaiya Iqbal and Md Tamjidul Hoque. Estimation of Position Specific Energy as a Feature of Protein Residues from Sequence alone for Structural Classification. PLoS One, 2016, 11(9), pp. e0161452, DOI: 10.1371/journal.pone.0161452.
12
• Sumaiya Iqbal, Denson Smith and Md Tamjidul Hoque. Accurate identification of disordered protein residues using deep neural network. The 4th Annual LA Conference on Computational Biology and Bioinformatics, 2016, New Orleans, LA.
Related publications of Chapter 5:
• Sumaiya Iqbal and Md Tamjidul Hoque, A Study of Disorder-to-Order Transition by Characterizing the Binding Partners using a Statistical Potential, Biophysical Journal, vol. 112, p. 209a, 2017, DOI: 10.1016/j.bpj.2016.11.1153.
• Sumaiya Iqbal and Md Tamjidul Hoque, Prediction of Peptide-Binding Residues of Receptor Proteins in a Complex, in the 5th Annual Conference on Computational Biology and Bioinformatics, New Orleans, LA, 2017.
• Sumaiya Iqbal, Md Tamjidul Hoque, Modeling sequence Pattern of Peptide-Binding Domain Residue using Stacking (submitted), 2017.
• Sumaiya Iqbal, Md Tamjidul Hoque, PBRpredict-Suite: Learning the Residue Pattern of Ppetide-Binding Domains from Sequence using Stacked Generalization (submitted), 2017.
Miscellaneous:
• Sumaiya Iqbal, Tamjidul Hoque. hGRGA: A Scalable Genetic Algorithm with Homologous Gene Schema Replacement. Swarm and Evolutionary Computation, vol. 34, pp. 33 - 49, 2017.
• Sumaiya Iqbal and Md Tamjidul Hoque. A homologous gene replacement based genetic algorithm. Genetic and Evolutionary Computation (GECCO), 2016, Denver, CO
13
Chapter 2
DisPredict: A Predictor of Disordered Protein
A Framework using optimized RBF kernel SVM
Intrinsically Disordered Proteins (or unstructured proteins) constitute a unique class of the protein kingdom, and have been recently recognized as a key player in the functional proteomics. Intrinsically disordered proteins or regions in proteins (IDPs/IDRs) lack rigid three-dimensional (3D) structure under physiological conditions in vitro [2]. However, IDPs, in full or in regions of the sequence, possess important biological functions despite their extremely flexible, essentially non-compact (or extended) structures. While the molecular recognition functions of IDPs/IDRs include pathways to carry out cell division, signaling, recognition and regulation [19], the structural heterogeneity of IDPs are highly linked to the amyloid aggregation that is involved in critical human diseases such as cancers, Parkinson’s disease, Alzheimer’s disease, type II diabetes and others [20]. Accurate identification of IDPs has significant implications in proper annotation of protein function and further understanding of drug design to combat disorder-associated diseases. Fast growing protein sequence repository [21] demands for high throughput computational techniques for identification of disordered residues from protein sequence, which is regarded as an imperative area of research in bioinformatics and computational biology.
14
per-residue probability prediction, specifically in terms of Mathews Correlation Coefficient (MCC) and Area Under the receiver operating characteristics Curve (AUC).
DisPredict is evaluated using a 10-fold cross validation as well as tested with independent test datasets. The use of multiple data sources makes the predictor generic. Moreover, by comparison with other state-of-the-art approaches and case studies, DisPredict is found to be a useful tool with competitive performance. In addition to the development of the predictor, we performed an analysis of the structural features of experimentally annotated disordered and ordered regions of proteins using feature correlation plot. This experiment gave us insight of the collected overlapping annotation of the ordered and disordered segments of proteins in their feature space. The result of this experiment indicates the possible noise in the annotation of disordered and ordered residues in the available databases and instigates to formulate new characteristic feature to segregate disordered and ordered residues more clearly – in this direction, the outline of the rest if the chapter is given as follows.
• We start by giving the background information about intrinsically disordered proteins and their functions, and motivation behind developing a new predictor in Section 2.1.
• Next, we review existing disordered protein predictors in Section 2.2 along with our contribution. • In Section 2.3, we describe the experimental materials, such as data sources, data collection and mining
processes, input features used to train the predictor, and the criteria to evaluate and compare the predictor.
• Section 2.4 describes the first version of the predictor, DisPredict (version 1.0). In this thesis, by ‘DisPredict1.0’ or just by ‘DisPredict’, we refer to the first version of our disorder predictor.
• We described the performance evaluation related to optimal window size and parameter selection and for the comparison of the performance of DisPredict1.0 with existing predictors in Section 2.5. • The analyses of the results and datasets as well as the feature correlation are presented in Section 2.6. • In Section 2.7, we discuss an investigative strategy to make an improvement over DisPredict1.0. Keeping the similar framework and features to build the predictor, we included a post-processing of the output probabilities generated by DisPredci1.0 to develop DisPredic1.1, which improves the accuracy of prediction.
• Finally, we conclude in Section 2.8 with future research directions.
2.1 Background and Motivations
15
understand the mechanism of protein function is of utmost importance in the study of protein science. The well-known protein-structure function paradigm, i.e., “sequencestructure function”, states that the amino acid sequence of a protein specifies a unique (mostly) spatial structure, which represents a kinetically accessible and an energetically favorable state (local or, global minimum energy conformation of the protein). This conformation is usually refer to as the native state of a protein and is a precondition for a protein to be able to perform important biological functions [22]. Existing ample research-works support this view for more than 100 years since Emil Fischer proposed the lock-and-key hypothesis after performing the experimentation with enzyme and glucoside [1, 23], which essentially states that only a correctly shaped substrate (like a key) can fit into the key-hole (active site) of a particular enzyme (lock) to exert a chemical effect on each other. Later, Hsien Wu proposed the theory of protein denaturation [24, 25] that explains that proteins can lose its ordered state (i.e., structure), and then lose its ability to carry out functions due to their exposure to different non-physiological conditions, such as acid, urea or high temperature. In 1950s, Linus Pauling postulated the structural modeling of protein polypeptide chain [26, 27], which was followed by the first crystal structures of globular proteins (myglobin) [28, 29] and of an enzyme (lysozyme) [30]. Consequently, 3D structure was considered as an obligatory form for protein to function, until the early 1990.
The classic experiments of Anfinsen revealed that all the necessary information for the correct folding of protein is included in its amino acid sequence [3] and the kinetics behind the unfolding of proteins due to environmental perturbation and refolding after restoration of physiological state [31, 32]. Many proteins unfold in different non-physiochemical circumstances, such as extreme pH [33] whereas some proteins do not unfold in extreme conditions [34]. While the charge-charge repulsion is found to be the driving force behind the former phenomenon, later is governed by the strong hydrophobic interactions over charge repulsion [2]. Unlike these proteins, the intrinsically disordered proteins do not adopt ordered structure under physiological condition (neutral pH) in vitro or in the absence of a binding partner [2, 6, 7, 35, 36].
16
Although the major contribution of this thesis is to develop in silico framework for mining proteomic data to characterize disordered protein residues and segregate them from the ordered residues in a sequence, before digging into the details of prediction algorithms, in the following sections, we describe the basic characteristics of the IDPs, their abundance and functions, and the role of computational methods in the study of disordered protein.
Intrinsically Disordered Proteins
Types and Characteristics
The intrinsically disordered regions (IDRs) of proteins exist as dynamic ensembles in which the coordinates of the atoms and the backbone Ramachandran angles vary largely over time. In the ordered regions, the coordinates of the atoms can fluctuate due to the random thermal change or conformational change of the local sequence neighborhood. However, this small-amplitude motions of the Ramachandran angles of the ordered residues can be characterized by the equilibrium positions defined by the time-averaged values. On the other hand, the atom positions and dihedral angles of the disordered residues cannot be characterized by an equilibrium state around which the residues stay most of the time, rather the IDRs undergo heterogeneous conformational changes that are random.
The residues in IDPs or IDRs possess several characteristics in terms of structural conformation and sequence composition [6, 8, 36, 46]. In [2], Uversky et al. discussed that the combination of low mean hydrophobicity and relatively large net charge is an important prerequisite for the absence of regular structure in proteins under physiologic conditions, which was further verified using charge-hydropathy (CH) plot [7, 36], showing a linear boundary line to separate ordered and disordered proteins based on their mean net charge and mean hydrophobicity, in early 2000s. The IDPs or IDRs are also found to have a compositional bias in their amino-acid residues; for example, they are depleted in Trp, (W) Tyr (Y), Phe (F), Ile (I), Leu (L), Val (V), Cys (C) and Asn (N), so-called order-promoting amino acids, whereas they are enriched in Ala, Arg (R), Gly (G), Gln (Q), Ser (S), Glu (E), Lys (K) and Pro (P), so-called as disorder-promoting residues. The general properties of IDPs/IDRs are listed as below.
• Sequence based properties
o Presence of charged amino acid residues (especially negative) o Low content of hydrophobic amino acids residues
o Low sequence complexity (use of reduced alphabet out of 20 amino acid) • Structure based properties
17 o Low content of secondary structure
o High amount of flexibility (no specific equilibrium state of the backbone atoms)
IDPs can adopt different conformations under various environmental conditions, such as effects of temperature change, pH change, and presence of ions and ligands [36]. Various degree of disorder has been observed in nature [44]. Fig 2 portrays three samples of intrinsic disorder in monomer and complex structures.
(a) PDB ID: 2JU4
18
(c) PDB ID: 5SVE
Fig 2. Intrinsically disordered proteins or regions in proteins. (a) PDB ID: 2JU4 [47], NMR structure
of intrinsically disordered gamma-subunit (PDEgamma) of cGMP phosphodiesterase. It has extended-disordered N-terminal region (red), whereas residues 46 – 87 (yellow) shows loose structural features, bound to alpha(t) in the transition-state complex. (b) PDB ID: 3J4Q [48], intrinsic disorder within an AKAP-protein kinase A complex. The complex has disorder linker (red) between each PKA regulatory subunit. (b) PDB ID: 5SVE [49], disordered regions in human Calcineurin interaction network with LxVP short linear motif (pink). The complex has Serine/threonine-protein phosphatase 2B catalytic subunit as chain A (green) and Calcineurin subunit as chain B (cyan). Both chains have disordered N-terminals (red). For chain A (green), structure of residues 1 – 10 and that of residues 1 – 4 for chain B are missing in the electron density due to their flexibility. We used PyMOL [50] to view the structures and DSSP to assign the secondary structures [51].
IDPs challenge the classical structure-to-function relationship of protein [8, 20, 46, 52]. Disordered proteins, having no rigid structure can show larger plasticity, can interact with different targets, such as ligands, small molecules, substrates, cofactors, other proteins, peptides, membranes etc. and participate in most of the key biological and disease-associated processes [5, 46, 49]. Some disordered regions are not known to bind to any partner, but they still carry out important functions such as providing flexible linkers between structured domains (seeFig 2 (b), red colored regions) or providing flexible tails that regulate the structured domains [35, 46].
Together with ordered state of the proteins, two different protein structurefunction paradigms were proposed considering the disordered states and the transitions between these states, called Protein Trinity [53] by Dunker et al. (2001) and Protein Quartet [35] by Uversky (2002), shown in Fig 3. Various structural forms of IDPs, discussed in the literature, have been listed below.
19
• Semi-collapsed disorder (pre-molten globules) [56], like polyglutamine regions [58] and polar sequences [59, 60], which arise due to the presence of rapidly exchanging backbone side-chain hydrogen bonds that make the region fail to form specific secondary structure [35, 36, 44]. • Extended disorder (random-coils), like intrinsic coils [20, 53, 54], which are formed by the
combination of low hydrophobicity and high net charge that result only marginal level of residual secondary structure [35, 36, 46].
(a) Protein Trinity (b) Protein Quartet
Fig 3. Two protein structurefunction paradigms, which emphasize the ordered state of a functional protein
as well as consider three possible dynamic states occurred by intrinsic disorder phenomenon. (a) Protein
trinity, includes two different states, fully extended (or random coil) and collapsed (or molten globule), of protein disorder. (b) Protein quartet, includes an additional state of disorder, semi-collapsed or pre-molten globule like state.
Abundance of Protein Disorder
The disordered proteins or residues have been found abundant in nature. Approximately 70% of the structures released by Protein Data Bank (PDB) [61, 62] contain some disordered residues [63]. Significant proportion of some genomes (such as, Eukaryota) encode the proteins with regions of disordered residues [54]. In humans, roughly one-third of all proteins is intrinsically disordered, of which, approximately 50% of these proteins are more than 30 residues long, and 25% of them are fully disordered [64].
20
Protein Disorderedness and Functions
Intrinsically disordered proteins participate in numerous biological functions by exhibiting a multitude of structural conformations and dynamics, such as cell cycle control and cellular signal transduction, transcriptional and translational regulation, membrane fusion and control pathways [5, 69, 70]. Disordered regions in proteins are found to be evolutionary conserved [36], which further confirms their intriguing role in biological processes. Moreover, IDPs are more frequent in eukaryotic genomes in comparison to bacteria and archaea, which supports the need of IDPs/IDRs recognition or prediction in signaling and regulation in nucleated cells [53, 69, 71, 72] as well as its potential involvement in human diseases.
Intrinsic disorder enables a number of capabilities of a protein [36, 44, 73, 74] which are crucial for molecular recognition, such as (i) separation of specificity and affinity due to the free energy penalty paid to fold disordered state; (ii) “binding diversity”, by which a region can fold differently to be recognized by different shaped partners, (iii) “binding commonality”, by which a sequence can fold differently but is recognized by a common surface of a partner; (iv) formation of large interaction surfaces; (v) faster rates of association and disassociation; (vi) reduced life-time in vivo and rapid turnover of regulatory molecules and so on. Besides molecular recognition, IDPs/IDRs participate in molecular assembly and protein modification [70, 75] via protein-protein, protein-nucleic acid and protein-ligand interactions [76-80].
In addition, being rich in binding sites for various partners, IDRs are found to be important loci for
alternative splicing [81] and for enzyme-driven posttranslational modifications (PTM) such as
phosphorylation, methylation, or acetylation [79]. Furthermore, intrinsic disorder plays a fundamental role in the functionality of proteins with PEST sequence, hub proteins, transcription factors, 14-3-3 protein and scaffold proteins [20, 82].