Journal of Chemical and Pharmaceutical Research, 2015, 7(3):1267-1274
Research Article
CODEN(USA) : JCPRC5ISSN : 0975-73843D remote sensing images parallax refining based on HTML5
Qian Pei, Hengjian Tong, Weitao Chen, Hai Wang and Yanrong Feng
School of Computer Sciences, China University of Geoscience, Wuhan, P.R. China
_____________________________________________________________________________________________
ABSTRACT
Horizontal parallax is the foundation of stereoscopic viewing. However, the human eye will feel uncomfortable and it will occur diplopia if horizontal parallax is larger than eye separation. Therefore, we need to do parallax refining before conducting stereoscopic observation. Although some scholars have been devoted to online remote sensing refining, the main work of image refining is completed on the server side. There will be a significant delay when multiple users access the server at the same time. The emergence of HTML5 technology in recent years makes it possible to develop rich browser web application. Authors complete the image parallax refining on the browser side based on HTML5, while server side only need to transfer image data and parallax file to browser side according to the browser’s request. In this way, we can greatly reduce the server CPU load and allow a large number of users to access server in parallel and respond the user’s request quickly.
Keywords: 3D remote sensing images, parallax, online refining, rich browser web application, HTML5
_____________________________________________________________________________________________
INTRODUCTION
Currently online 3D remote sensing image refining, most of the work are completed on the server side. For example, Reference [1] presented a method about online image refining, browser is only responsible for the user’s operation and displays image data coming from the server, but when there are a lot of users simultaneously access the server, the server CPU load will be very large, which then lead to server can’t timely handle the request from browser, and browser have a great delay.
With the help of the HTML5 canvas technology [2], authors have realized the refining 3D remote sensing image on the browser. Server only delivers image data and parallax file to the browser, and browser completes all other work, which greatly reduces the server CPU load pressure, and improves the browser response speed when multiple users access the server at the same time. Moreover, the browser doesn’t need to install any plug-in, which can maintain user’s computer and network security.
The organization of 3d remote sensing image data
As is known to all, remote sensing image file size is very huge, remote sensing image data of a city tend to be more than 4G [3]. The largest RAM which can be supported by the 32-bit windows system is 4G, so it is impossible to deal directly with the whole remote sensing image in memory. It requires us to cut the remote sensing image into many small pieces for processing [4].
The organization form of 3D remote sensing images has been clearly described in the Reference [5]. In order to make readers understand the online 3D remote sensing image refining procedure better, authors decide to introduce the main contents of the remote sensing image data structure.
[image:2.595.165.453.126.346.2]
Authors have built a hierarchical pyramid structure and the logical structure is shown in Figure 1. The pyramid is divided into many layers, and each layer consists of many image tiles which size is 256*256 pixels. Each layer of the pyramid represents different resolution of remote sensing images. Server returns the image tiles data to the browser on demand according to requirement of the browser.
FIGURE 1. Hierarchical pyramid matrix logical structure
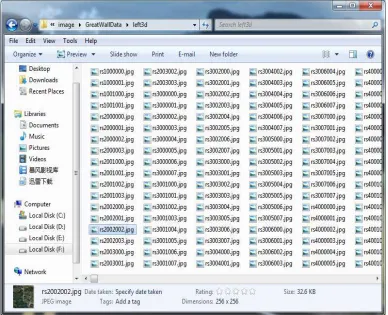
The physical structure is shown in Figure 2. Image tiles is named by their position in the hierarchical pyramid logical structure. For example, rs2002002.jpg file is representative of second layer, second row and second column image tile in the hierarchical pyramid logical structure.
[image:2.595.113.501.424.739.2]
Refining method for 3d remote sensing image 3.1 Refining Algorithm
3D remote sensing image data obtained directly by aerial photography usually exist parallax. Some high altitudes have larger horizontal parallax [7]. Therefore, some homologous image points may have immoderate horizontal parallax. If horizontal parallax is larger than eye separation, 3D remote sensing image will lost the stereoscopic effect and user’s eye may feel uncomfortable, such as eyestrain or headaches [8]. Reference [6] proved that the overall image parallax can be reduced by shifting image pixel data, thus the whole image can be maintained in an acceptable parallax range. But how many pixels should be shifted for reducing overall maximum horizontal parallax? Authors refer to the refining method in Reference [1]. In the process of refining, firstly calculate the image tile’s maximum and minimum parallax in the browser display window, then compute the numbers of pixels which need to be shifted according to the following algorithm.
After calculate the shift value according to the parallax file, then we use the value to shift the right red band and combine it with left green and blue band to form a new refining image [9]. When all the image tiles have been refined, we combing these refined image tiles to a whole image and display this image to the browser, so that user can see the refining image while they press the refining button. The combine procedure is shown in Figure 3.
left right
According to the calculated value of the parallax file to shift the red band
+
3.2 Existing Online 3D Remote Sensing Image Refining Method
An existing server-based online 3D remote sensing image refining method has been completed by Dr. Yun Zhang’s research group at Department of Geodesy and Geomatics Engineering, University of New Brunswick [1]. The refining procedure is as shown in Figure 4.
Browser
1.3D image browsing system interface
2.Users press
‘Refining’button
3.Compute image coordinate range of display window
4.Compute begin row, end row, begin column and end column of image tiles in display window
5.Request Server to do refining operation
Server
10.Return the refined image to Browser
9.Combine blue ,green channels of left image with red channel image of shifted right image to produce a new refined image
8.Shift red channel image of right image
7.Compute the shift parallax
6.Open parallax information file
FIGURE 4. Online refining procedure based on serve side
The server will handle multiple browsers’ request and calculate the parallax, refine parallax and composite image tiles, when multiple users access the server at the same time, server CPU load will be very large, and the browser will have a serious delay. It can’t make user feel smooth effect.
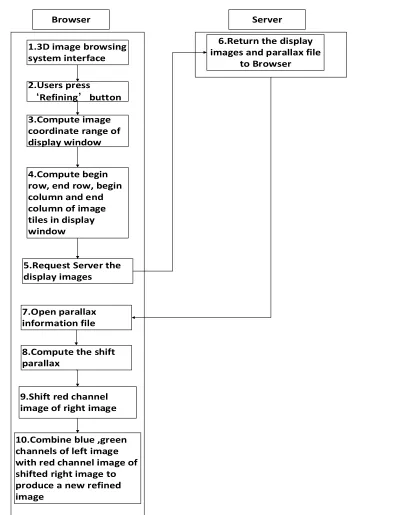
1.3 Refining Process Based on HTML5
Browser
1.3D image browsing system interface
2.Users press
‘Refining’button
3.Compute image coordinate range of display window
4.Compute begin row, end row, begin column and end column of image tiles in display window
5.Request Server the display images
Server 6.Return the display images and parallax file
to Browser
10.Combine blue ,green channels of left image with red channel image of shifted right image to produce a new refined image
9.Shift red channel image of right image
8.Compute the shift parallax
[image:5.595.127.526.66.581.2]7.Open parallax information file
FIGURE 5. Online refining procedure based on HTML5
Use getImageData() to obtain the whole image pixels data
Use the parallax file which transmitted from serve to calculate how many pixels
need to shift
After all the image pixels data have been shifted, use putImageData() to display the
refined image
Use drawImage() to put all the image tiles which need to be displayed into the
canvas
FIGURE 6. The browser specific refining process
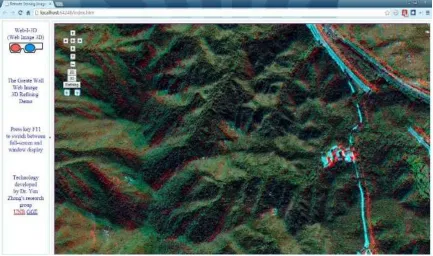
[image:6.595.90.523.387.643.2]The 3D remote sensing image before refining is shown in Figure 7, and Figure 8 shows the refined 3D remote sensing image. The Refining button is automatic refining according to the parallax file, the blue left and right button are doing manual refining operation. It has a great improvement in 3D visualization effect.
FIGURE 8. 3D remote sensing image after online refining
CONCLUSION
This paper is based on Professor Tong Hengjian’s research. The main work of the paper is transferring 3D remote sensing image refining work from server side to browser side by using HTML5 technology.
The new system has the following advantages: (1) 3D remote sensing image refining work is executed in Browser side; Therefore, it reduces the CPU load of the server side when multi-users access the server at the same time and improves the performance of the system. (2) Browser doesn’t not need to install any plug-in. It is cross-platform and is not depend on the operation system and special browser only if the browser supports the HTML5.
Acknowledgment
This research was supported by National Natural Science Foundation of China under Grant No.41171339. The Youth Science and Technology Morning Program of Wuhan under Grant No. 2013070104010027. Experience Technology Research Project of China University of Geosciences (Wuhan) under Grant No.SJ-201327, 2013.
REFERENCES
[1]Tong H, Zhang Y, Shao Z 2009 3D remote sensing images online refining 17th International Conference on
Geoinformatics, Geoinformatics.
[2]HTML 5 Canvas http://www.w3school.com.cn/tags/HTML_ref_canvas.asp Oct. 26, 2014
[3]Xie P 2004 A Web-based 3D Visualization Prototype System for Highresolution Satellite Colour Stereo Images
M.Sc.E.thesis, Department of Geodesy and Geomatics Engineering Technical Report No. 223 :Fredericton New
Brunswick Canada pp 188
[4]Wartell Z, Hodges L, Ribasky W 1999 Balancing Fusion,Image Depth and Distortion in Stereoscopic Head-Tracked Displays in Computer Graphics Proceedings, Annual Conference Series 351-358
[5]Tong H, Zhang Y, Shao Z 2008 3D remote sensing images data organization and web publication The
International Society for Optical Engineering 7285 72853L
[6]Wartell Z, Hodges L, Ribasky W 2002 IEEE Transactions on Visualization andComputer Graphics 8(2) 129-143
[7]Jung C, Wang L, Zhu X, Jiao L 2014 2d to 3d conversion with motion-type adaptive depth estimation
Multimedia Systems article in press
[8]Niu B, Sang X Z, Chen D, Cai Y F 2013 Reconstruction of 3D scenes from sequences of images The
International Society for Optical Engineering 8913 89130H
Imaging
[10]Liu W T 2014 Applied Information Technology in Graphics Algorithm Implementation Based on the Web Canvas Advanced Materials Research 908 543-546
[11]Hayakawa T, Hikita T 2014 Proposal for virtual web browser by using HTML5 Lecture Notes in Electrical