Journal of Chemical and Pharmaceutical Research, 2015, 7(6):60-70
Research Article
ISSN : 0975-7384
CODEN(USA) : JCPRC5
Development and validation of stability indicating RP-HPLC with UV
detection method: Analysis of Dutasteride in pharmaceutical dosage forms
Atkuru Veera Venkata Naga Krishna Sunil Kumar
1*, Chandra Bala Sekaran
2and Tamanampudi Varahala Reddy
31
Department of Chemistry, NRI Institute of Technology, Pothavarappadu, Andhra Pradesh, India
2Department of Pharmaceutical Biotechnology, Medarametla Anjamma Mastan Rao College of Pharmacy,
Narasaraopet, Andhra Pradesh, India
3Department of Chemistry, Mallareddy College of engineering, Secundrabad, Andhra Pradesh, India _____________________________________________________________________________________________
ABSTRACT
A simple and rapid stability indicating liquid chromatographic method with UV detection was developed and validated for the determination of dutasteride in bulk drug and pharmaceutical dosage form. Chromatographic separation has been achieved within 5 minutes by using an Agilent Zorebax SB Phenyl analytical column (250 mm × 4.6 mm, 5 µm) as the stationary phase with a mobile phase consisted of orthophosphoric and methanol (60:40 v/v) at a flow rate of 1.0 ml/min. Using an UV detector, detection was performed at 248 nm. The method was validated in accordance with International Conference on Harmonization guidelines with respect to linearity, sensitivity, selectivity, accuracy, precision, specificity and robustness. Regression analysis showed good correlations (R2=0.9994) for dutasteride in the concentration range of 4-60 µg/ml. The dutasteride was exposed to acidic, basic, oxidation, photo degradation and dry heat stress conditions. The developed HPLC method can efficiently separate the dutasteride from its degradation products. Therefore, it can be employed as stability-indicating method. The percentage recovery was in the range of 99.84–100.13% with relative standard deviation in the range of 0.046– 0.076 %, for dutasteride from the pharmaceutical dosage form. The proposed method is suitable for determination of dutasteride in bulk drug and in its pharmaceutical dosage form.
Keywords: Dutasteride, Agilent Zorebax SB Phenyl column, HPLC analysis, pharmaceutical dosage form.
_____________________________________________________________________________________________
INTRODUCTION
Dutasteride (DST) is a 5-α-reductase inhibitor. DST inhibits the conversion of testosterone to dihydrotestosterone by blocking the action of the 5-α- reductase enzyme. DST is approved for the treatment of benign prostatic hyperplasia by the food and drug administration [1-3]. Chemically, DST is known as (5 alpha, 17 beta)-N-{2, 5 bis(trifluoromethyl)phenyl}-3-oxo-4-azaandrost-l-ene-17-carboxamide (Fig. 1).
Figure 1: Structure of dutasteride
The LC–MS [8,9,10], HPTLC [11]and enzyme-linked immunosorbent assay [12]techniques may have the highest
sensitivity, but the determination process is complicated, costly and time consuming. In addition enzyme immune assay [12], LC–MS [8,9,10] methods were not applied to pharmaceutical formulations. Although the UV spectrophotometric methods [4,5] are simple and easy to perform, they suffers from decreased selectivity due to measurement in ultraviolet region. The visible spectrophometric methods [6,7] suffers from disadvantages such as use of costly reagent, extraction of colored complex, use of more volume of organic solvents and narrow range of linearity. Most of the reported HPLC [14,15] are utilized for the determination of dutasteride in combination with other drugs (tamsulosin hydrochloride/alfuzosin hydrochloride). Only a few stability indicating RP-HPLC with UV detection methods [16,17] have been reported for the quantification of dutasteride alone in bulk and pharmaceutical dosage forms. However the reported stability indicating RP-HPLC with UV detection methods [16,17] suffer from the lack of broad linearity range, sensitivity, precision and accuracy. In addition, the retention time of DST in the reported stability indicating RP-HPLC methods [16,17] is greater than four minutes which in turn increases the time of analysis.
By considering into the above disadvantages of the reported methods, the aim of the present work was to develop and validate a rapid, sensitive, precise and accurate stability indicating RP-HPLC with UV detection method, without the use of internal standard, for determination of DST in bulk and in pharmaceutical dosage forms.
EXPERIMENTAL SECTION
Chemicals and Reagents:
All chemicals and solvents were analytical and HPLC grade, respectively and used as received. All solutions were prepared in Milli-Q water from Merck Specialties Private Ltd, Hyderabad, India. Pharmaceutical grade DST was obtained as gift sample from the Hetero Drugs Limited, Hyderabad, India. Tablet dosage forms of DSE such as Duprost (labeled to contain 0.5 mg/tablet, manufactured by Dr. Reddy’s Lab. Ltd., H. P., India), Dutas (labeled to contain 0.5 mg/tablet, manufactured by Dr. Reddy’s Lab. Ltd., H. P., India) and Sterdu (labeled to contain 0.5 mg/tablet, manufactured by Mercury, Lab. Ltd., H. P., India) were purchased from local pharmacy market. Orthophosphoric acid and methanol were obtained from Sd fine-chem Ltd, Mumbai, India.
Apparatus and Chromatographic Conditions:
Samples were analyzed on a Waters Alliance HPLC system equipped with 2695 separation modules having 2996 photodiode array detector. The detector wavelength was fixed at 248 nm and peak areas were integrated automatically using the Millennium 32 software program. Other apparatus included a Shimazdu (Tokyo, Japan) electronic weighing balance model BL 220 H for weighing the samples and an Elico pH meter (Hyderabad, India) LI 120 model.
Preparation of Standard Solutions:
Standard stock solution of DST (1 mg/ml) was prepared in mobile phase. Series of working standard solutions were diluted with the same solvent to the desired concentration for linearity (4, 8, 15, 20, 30, 40, 50 and 60 µg/ml), system suitability studies (40 µg/ml), sensitivity (4 µg/ml), selectivity (40 µg/ml), accuracy (4, 40, 60 µg/ml), precision (4, 40, 60 µg/ml) and robustness (4, 60 µg/ml).
Preparation of tablet sample solution:
To determine the concentration of DST in tablet dosage forms (label claim: 0.5 mg per tablet), 100 tablets were weighed, their mean weight was determined and they are finely powdered. A precisely weighed powder sample equivalent to 25 mg of DST was transferred into a 25 ml volumetric flask containing 15 ml mobile phase. The content of the flask was sonicated for 15 min and the resulting solution was filtered through 0.45 µm membrane filter. The volume was completed with mobile phase and the solution reached 1 mg/ml (stock solution). An appropriate aliquot of the stock solution was transferred into a volumetric flask and diluted with the mobile phase to obtain concentration equal to 40 µg/ml of DST. The solution was filtered through 0.45 µm membrane filter before analysis.
Preparation Placebo blank solution:
A placebo blank containing starch (10 mg), acacia (10 mg), hydroxyl cellulose (10 mg), sodium citrate (10 mg), talc (10 mg), magnesium stearate (10 mg), lactose (10 mg), glucose (10 mg) and sodium alginate (10 mg) was prepared and extracted with 20 ml mobile phase. The placebo blank solution was prepared as described under section “Preparation of tablet sample solution”.
Preparation of Solutions for degradation studies: Acid degradation:
For acid degradation study, 50 mg of DST was taken in 50 ml volumetric flask. 5 ml of 0.1 N HCl was added in the flask and heated on water bath at 80ºC for 2 hours. After completion of the stress the solution was neutralized by using 0.1 N NaOH and completed up to the mark with mobile phase.
Alkali degradation:
For alkali degradation study, 50 mg of DST was taken in 50 ml volumetric flask. Five ml of 0.1 N NaOH was added in the flask and heated on water bath at 80ºC for 2 hours. After completion of the stress, the solution was neutralized by using 0.1 N HCl and completed up to the mark with mobile phase.
Oxidative degradation:
For oxidative degradation study, 50 mg of DST was taken in 50 ml volumetric flask. Ten ml of 3% H2O2 was added
in the flask and sonicated for 30 minutes. After completion of the stress, the 50 ml flask was completed up to the mark with mobile phase.
Dry heat degradation:
For dry heat degradation study, 50 mg of DST was taken in glass petri dish and placed in hot air oven at 105°C for 2 hours. After 2 hours, the sample was cooled and transferred to a 50 ml volumetric flask containing 15 ml of mobile phase and mixed well. The volume of the flask was made up to mark with mobile phase.
Photolytic degradation:
For photolytic degradation study, 50 mg of DST was taken in a glass petri dish and placed in the sunlight for 24 hrs. After completion of the stress, the sample was transferred to a 50 ml volumetric flask containing 15 ml of mobile phase and mixed well. The volume of the flask was completed up to mark with mobile phase.
RESULTS AND DISCUSSION
Method Development:
To develop an efficient and simple stability indicating HPLC method for the assay of DST, preliminary tests were conducted to select the suitable and optimum conditions. HPLC parameters, such as detection wavelength, ideal mobile phase and their proportions, flow rate and column temperature were carefully studied. The HPLC parameters were finally chosen based on the criteria of peak properties like height, area, retention time and peak symmetry.
The ultraviolet spectra of DST dissolved in mobile phase showed the maximum absorption wavelength at 248 nm. Therefore, 248 nm was selected as detection wavelength. Different combinations of acetonitrile, methanol, propanol, dichloromethane, orthophosphoric, dipotassium hydrogen phosphate buffer & formate buffer were tested. The optimum condition at orthophosphoric-methanol (60:40, v/v), was reached. The mobile phase with different pH (2-5) was tried. The best peak shape and tailing factor with reasonable analysis time for DST was accomplished at pH 2.5. Therefore, mobile phase with pH 2.5 was chosen. Two different stationary phases (Agilent Zorebax RX C8, 150 mm x 4.6 mm, 5 µm particle size and Agilent Zorebax SB Phenyl, 250 mm x 4.6 mm, 5 µm particle size) were investigated and the peak properties were compared. The best peak properties were obtained by using Agilent Zorebax SB Phenyl Column (250 mm x 4.6 mm, 5 µm particle size). The mobile phase with flow rates in the range 0.8-1.6 ml/min was investigated. At the flow rate 1.0 ml/min, symmetric and well retained peak was obtained. Therefore, the flow rate 1.0 ml/min was selected. The effect of temperature on the column efficiency was studied. Different temperatures of 15°C-35°C with 5°C increments were evaluated. The chromatograms were recorded. It was found that the peak shape was good at 300C temperature, therefore 300C temperature was chosen. Under the described chromatographic conditions, the retention time of dutasteride was 3.172 minutes.
HPLC Method Validation:
After the successful optimization, the optimized HPLC method was validated in accordance to the International Conference on Harmonization guidelines [18,19]. Parameters such as system suitability, selectivity, sensitivity, linearity range, accuracy, precision, specificity and robustness were all validated.
System Suitability:
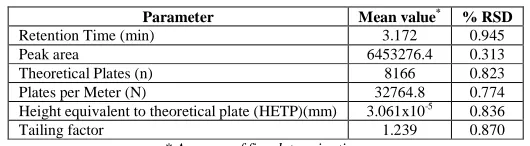
[image:4.595.165.430.501.574.2]The system suitability was determined by injecting six replicates of the DST standard solutions (40 µg/ml) and analyzing for its retention time, peak area, theoretical plates, plates per meter, height equivalent to theoretical plate, and peak asymmetry. The system suitability results revealed %RSD of less than 1.0% for all the parameters. As shown in Table 1, the proposed method meets the accepted requirements.
Table 1: System suitability parameters
Parameter Mean value* % RSD
Retention Time (min) 3.172 0.945
Peak area 6453276.4 0.313
Theoretical Plates (n) 8166 0.823
Plates per Meter (N) 32764.8 0.774
Height equivalent to theoretical plate (HETP)(mm) 3.061x10⁻⁵ 0.836
Tailing factor 1.239 0.870
* Average of five determinations
Selectivity:
Figure 2: Chromatogram of mobile phase blank
Figure 3: Chromatogram of placebo blank
Figure 4: Chromatogram of standard dutasteride sample (40 µg/ml)
Sensitivity:
The sensitivity of the proposed method was investigated via measurement of the limit of detection (LOD) and limit of quantitation (LOQ) at a signal-to-noise ratio of 3 and 10, respectively. It was achieved by injecting working standard solution of DST with known concentration (4 µg/ml) into the HPLC column five times. The LOD and LOQ were found to be 0.103 µg/ml and 0.342 µg/ml, respectively. These values suggest that the developed method is sensitive to quantify DST.
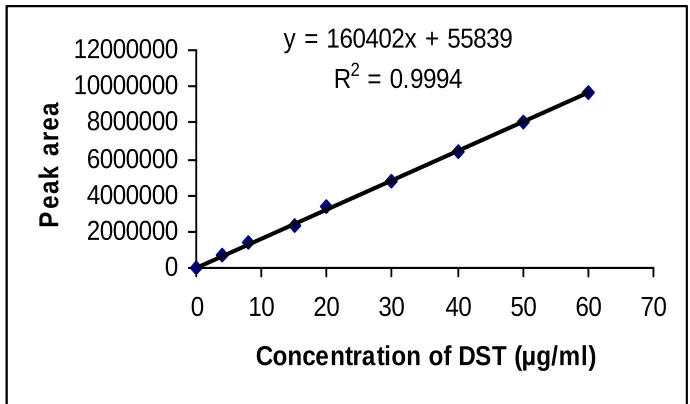
Linearity:
An eight-point (4, 8, 15, 20, 30, 40, 50 and 60 µg/ml) calibration curve was prepared. The peak area for each concentration was obtained by injecting 10 µl of the each DST working standard solution into the column. Calibration curve was plotted by taking the peak area on the y-axis and the concentration of DST (µg/ml) on the x-axis (Figure 5). The linearity was assessed by the least square regression method. The regression line confirmed linearity in the tested range (4-60 µg/ml). The linear regression equation was y = 160402x + 55839 (y = peak area: x = concentration of DST in µg/ml). The regression line was linear with R2 of 0.9994.
y = 160402x + 55839
R
2= 0.9994
0
2000000
4000000
6000000
8000000
10000000
12000000
0
10
20
30
40
50
60
70
Concentration of DST (
µ
g/ml)
P
e
a
k
a
re
a
Figure 5: Linearity of dutasteride
Precision and Accuracy:
[image:6.595.124.469.467.669.2]injections of the standard solutions of DST at concentrations 4, 40 and 60 µg/ml prepared. The intra-day variation was assessed over one day, while inter-day assay was carried out over 3 days. Table 2 provides data obtained from the intra-day & inter-day experiments. The relative standard deviation values for intra-day and inter-day precision were in the range of 0.029-0.684% and 0.025-0.688% (acceptance criteria proposed: RSD <2.0%), respectively. The percent recovery values for intra-day and inter-day accuracy were in the range of 100.02% and 100.01-100.20% (acceptance criteria proposed: %Recovery range - 80 to 120%), respectively. The results (Table 2) indicating that the method has sufficient precision and accuracy.
Table 2: Precision and accuracy
Concentration of DST(µg/ml)
%RSD % Recovery % Error Taken Found* ± SD
Intra-day assay
4 4.001±0.0274 0.684 100.02 0.020
40 40.010±0.023 0.058 100.02 0.02
60 60.010±0.0179 0.029 100.01 0.01
Inter-day assay
4 4.008 ±0.0276 0.688 100.2 0.20
40 40.008±0.0113 0.0283 100.2 0.20
60 60.006±0.0153 0.0254 100.01 0.01
* Average of five determinations
Recovery:
[image:7.595.191.405.400.460.2]Accuracy was further determined by the recovery study of known concentration of DST standard added to a preanalysed tablet sample solution. The recovery study was performed five times. The average recovery data (Table 3) of DST showed results between 99.84% and 100.13% with relative standard deviation between 0.046% and 0.076%.
Table 3: Recovery study
Concentration of DST (mg) %
RSD % Recovery In tablet + Spiked Found*± SD
0.5+0.25 0.751±0.000577 0.0768 100.133
0.5+0.5 0.999±0.000577 0.0582 99.90
0.5+0.75 1.248±0.000577 0.0462 99.84
* Average of five determinations
Specificity:
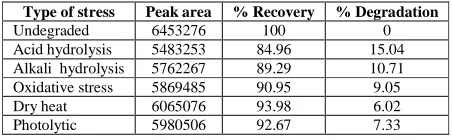
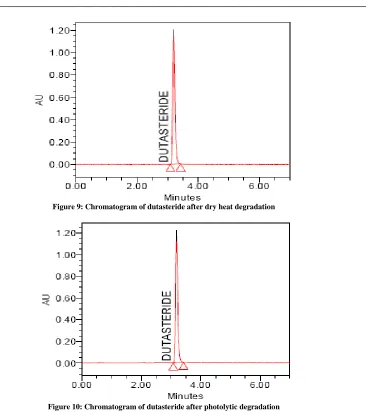
In order to evaluate the specificity of the proposed method, stress degradation studies were performed using different ICH prescribed stress conditions such as acidic, alkali, oxidative, thermal and photolytic stresses.
Under acidic conditions DST was degraded up to 15.04%. Under alkali stress DST was degraded up to 10.71%. Under oxidative stress DST was degraded up to 9.01 %. Only a small percent of degradation occurred in dry heat and photolytic stresses. Under dry heat and photolytic stresses, the percent of DST degradation was 6.02% and 7.33%, respectively. From these stress studies it is therefore concluded that DST was degraded more in the applied acidic, alkali and oxidative stress conditions whereas least percent of degradation occurred in dry heat and photolytic stress conditions. The results are summarized in Table 4.
Table 4: Percentage of degradation
Type of stress Peak area % Recovery % Degradation
Undegraded 6453276 100 0
Acid hydrolysis 5483253 84.96 15.04
Alkali hydrolysis 5762267 89.29 10.71
Oxidative stress 5869485 90.95 9.05
Dry heat 6065076 93.98 6.02
Photolytic 5980506 92.67 7.33
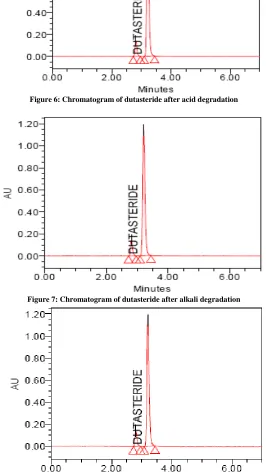
[image:7.595.185.411.608.678.2]separated the degradation product from analyte peak. As a result, the proposed method is considered specific for determination of DST in the presence of degradation products.
Figure 6: Chromatogram of dutasteride after acid degradation
Figure 7: Chromatogram of dutasteride after alkali degradation
[image:8.595.164.430.227.703.2]Figure 9: Chromatogram of dutasteride after dry heat degradation
[image:9.595.98.497.521.662.2]Figure 10: Chromatogram of dutasteride after photolytic degradation
Table 5: Method robustness
Experimental variable Investigated range 4 µg/ml 60 µg/ml Mean Peak area* %RSD Mean Peak area* %RSD
Mobile phase ratio** (v/v)
58:42
646924 0.472 9455489 0.204
60:40 62:38
pH of mobile phase
2.3
645739 0.645 9676123 0.190
2.4 2.5
Temperature of the column (oC)
28
645665 0.548 9676112 0.462
30 32
Flow rate of mobile phase (ml/min)
0.9
645171 0.679 9676109 0.357
1.0 1.1
* Average of three values **
mobile phase composition: orthophosphoric acid and methanol
the varying conditions. The relative standard deviation is in the range of 0.472%-0.679% at 4 µg/ml concentration level and in the range of 0.190%-0.462% at 60 µg/ml concentration level. The proposed method thus remained unaffected by slight but deliberate changes in the analytical conditions (Table 5).
Application of the proposed method to assay of DST in pharmaceutical dosage forms:
The above-mentioned validation results indicated that the proposed method gave satisfactory results with DST in bulk. Therefore its pharmaceutical dosage forms [Duprost (labeled to contain 0.5 mg/tablet, manufactured by Dr. Reddy’s Lab. Ltd., H. P., India), Dutas (labeled to contain 0.5 mg/tablet, manufactured by Dr. Reddy’s Lab. Ltd., H. P., India) and Sterdu (labeled to contain 0.5 mg/tablet, manufactured by Mercury, Lab. Ltd., H. P., India)] were subjected to the assay of their DST contents by the proposed method. The label claim percentages were in the range of 99.40 ± 0.673% to 101.60 ± 0.1.279% (Table 6). Good recoveries with low relative standard deviation values indicate the non interference of excipients commonly present in the pharmaceutical dosage form.
Comparison with the reported UV spectrophotometric method:
The results obtained above were compared with that obtained from the reported UV spectrophotometric method [4] by statistical analysis with respect to the accuracy (by student t-test) and precision (by variance F-test). At 95% confidence level, no significant differences were found between the calculated and theoretical values of t- and F-tests confirming similar accuracy and precision in the determination of DST by both methods (Table 6).
Table 6: Determination of dutasteride in dosage forms and statistical comparison with the reference method
Method Dosage form value (mg) Declared
Found value (mg)
± S.D*
RSD (%)
Recovery (%)
t
Value** ValueF **
Reference
Duprost 0.5 0.502±0.0048 0.956 100.40 - -
Dutas 0.5 0.491±0.0064 1.303 98.20 - -
Sterdu 0.5 0.505±0.0071 1.405 101.00 - -
Proposed
Duprost 0.5 0.508±0.0065 1.279 101.60 1.89 5.28
Dutas 0.5 0.497±0.0052 1.046 99.40 1.79 4.59
Sterdu 0.5 0.505±0.0034 0.673 101.00 1.58 4.34
*Average of five determinations
** Tabulated t value at 95 % confidence level = 2.77 and Tabulated F value at 95% confidence level = 6.39.
CONCLUSION
A simple and rapid stability indicating HPLC with UV detection method equipped with UV detection at 248 nm has been developed for the quantification of DST. The results of validation undertaken according to the International Conference on Harmonization guidelines reveal that the method is linear, sensitive, selective, accurate, precise, specific and robust. The method is appropriate for the routine analysis of DST in either bulk or in pharmaceutical dosage forms.
Acknowledgements
One of the authors, A.V.V.N.K.S. Kumar, expresses their gratitude to the management Department of Chemistry, NRI College, Vijayawada for their continuous support & encouragement and Rainbow Pharma Training Lab, Hyderabad for providing the necessary research facilities.
REFERENCES
[1]Walsh PC. New Engl. J. Med., 2010, 362 (13), 1237-1238.
[2]Clark RV; Hermann DJ; Cunningham GR; Wilson TH; Morrill BB; Hobbs S. J. Clin. Endocrinol. Metab., 2004, 89 (5), 2179-2184.
[3]Wurzel R; Ray P; Major-Walker K; Shannon J; Rittmaster R. Prostate Cancer Prostatic Diseases., 2006, 10 (2), 149-152.
[4]Kamila MM; Mondal N; Ghosh LK. Int. J. PharmTech Res., 2010, 2 (1), 113-117.
[5]Amin MR; Hasan M; Masud AA; Hanifuddin M; Hasanuzzaman M; Islam MK. Pharmacie Globale., 2011, 2 (4), 1-3.
61-[7]Sunil Kumar AVVNK; Vijaya Saradhi S; Sekaran CB; Reddy TV. Chem. Sci. J., 2012, Vol. 2012: CSJ-47, 1-16. [8]Gomes NA; Pudage A; Joshi SS; Vaidya VV; Parekh SA; Tamhankar AV. Chromatographia., 2009, 69 (1-2), 9-18.
[9]Sangita A; Gowda KV; Sarkar AK; Debotri G; Uttam B; Kumar CT; Pal TK. Chromatographia., 2008, 67 (11-12), 893-903.
[10]Ramakrishna NVS; Vishwottam KN; Puran S; Koteshwara M; Manoj S. J. Chromatogr. B., 2004, 809 (1), 117-124.
[11]Kamat SS; Vele VT; Choudhari VC; Prabhune SS. Asian J. Chem., 2008, 20 (7), 5514-5518.
[12]Bruna EM; Torresa A; Venturab R; Puchadesa R; Maquieiraa A. Anal. Chim. Acta., 2010, 671 (1-2), 70-79. [13]Patel DB; Patel NJ; Patel SK; Prajapati AM; Patel SA. Indian J. Pharma. Sci., 2010, 72 (1), 113-116. [14]Deshmukh SS; Havele SS; Musale VV; Dhaneshwar SR. Der Pharmacia Lettre., 2010, 2 (6), 342-349. [15]Patel DB; Patel N. Acta Chromatogr., 2010, 22 (3), 419-431.
[16] Kamat SS; Choudhari VB; Vele VT; Prabhune SS. Chromatographia., 2008, 67(11-12), 911-916. [17]Rao DVS; Radhakrishnanand P. Chromatographia., 2008, 67 (9-10), 841-845.
[18]International Conference on Harmonisation of technical requirements for registration of pharmaceuticals for human use guidelines, Q1A(R2): Stability testing of new drug substances and products. 2003, 1-24.